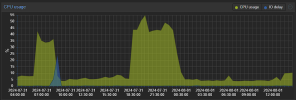
PVE 100%CPU on all kvm while vms are idle at 0-5% cpu

Hi Fiona,
I have a positive update. It seems that that this issue is not specific to Proxmox. Our CU vendor, who had supplied the instructions on how to setup this virtual machine, have observed a similar behaviour on Vmware as well. Digging further, it seems that this issue comes after executing the last step in below series of steps.

1. Install real-time kernel on the VM and check that it should be 5.14.0-162.12.1.rt21.175.el9_1.x86_64.
2. systemctl disable firewalld --now.
3. sudo setenforce 0.
4. sudo sed -i 's/^SELINUX=enforcing$/SELINUX=disabled/' /etc/selinux/config.
5. sudo sed -i 's/blacklist/#blacklist/' /etc/modprobe.d/sctp*.
6. Edit /etc/tuned/realtime-virtual-host-variables.conf and set "isolated_cores=2-15".
7. tuned-adm profile realtime-virtual-host.
8. Edit /etc/default/grub and set
GRUB_CMDLINE_LINUX="crashkernel=1G-4G:192M,4G-64G:256M,64G-:512M rd.lvm.lv=rl/root processor.max_cstate=1 intel_idle.max_cstate=0 intel_pstate=disable idle=poll default_hugepagesz=1G hugepagesz=1G hugepages=1 intel_iommu=on iommu=pt selinux=0 enforcing=0 nmi_watchdog=0 audit=0 mce=off".
9. Add below 2 entries to grub file:
GRUB_CMDLINE_LINUX_DEFAULT="${GRUB_CMDLINE_LINUX_DEFAULT:+$GRUB_CMDLINE_LINUX_DEFAULT}\$tuned_params" GRUB_INITRD_OVERLAY="${GRUB_INITRD_OVERLAY:+$GRUB_INITRD_OVERLAY }\$tuned_initrd"
10. grub2-mkconfig -o /boot/grub2/grub.cfg.
11. reboot

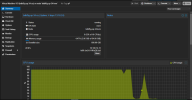
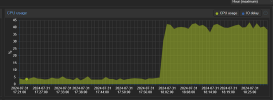
This is where both Proxmox and Vmware show the same behaviour and show that the CPU utilization of the VM is 100%.

They are currently working on trying to figure out why this is happening. In case you spot something unusual in above commands (especially for a VM), please let me know. I would be really greatful.

Will keep you posted.


Regards,
Vikrant
 
  • Like
Reactions: fiona
Hi Fiona,
I have a positive update. It seems that that this issue is not specific to Proxmox. Our CU vendor, who had supplied the instructions on how to setup this virtual machine, have observed a similar behaviour on Vmware as well. Digging further, it seems that this issue comes after executing the last step in below series of steps.

1. Install real-time kernel on the VM and check that it should be 5.14.0-162.12.1.rt21.175.el9_1.x86_64.
2. systemctl disable firewalld --now.
3. sudo setenforce 0.
4. sudo sed -i 's/^SELINUX=enforcing$/SELINUX=disabled/' /etc/selinux/config.
5. sudo sed -i 's/blacklist/#blacklist/' /etc/modprobe.d/sctp*.
6. Edit /etc/tuned/realtime-virtual-host-variables.conf and set "isolated_cores=2-15".
7. tuned-adm profile realtime-virtual-host.
8. Edit /etc/default/grub and set
GRUB_CMDLINE_LINUX="crashkernel=1G-4G:192M,4G-64G:256M,64G-:512M rd.lvm.lv=rl/root processor.max_cstate=1 intel_idle.max_cstate=0 intel_pstate=disable idle=poll default_hugepagesz=1G hugepagesz=1G hugepages=1 intel_iommu=on iommu=pt selinux=0 enforcing=0 nmi_watchdog=0 audit=0 mce=off".
9. Add below 2 entries to grub file:
GRUB_CMDLINE_LINUX_DEFAULT="${GRUB_CMDLINE_LINUX_DEFAULT:+$GRUB_CMDLINE_LINUX_DEFAULT}\$tuned_params" GRUB_INITRD_OVERLAY="${GRUB_INITRD_OVERLAY:+$GRUB_INITRD_OVERLAY }\$tuned_initrd"
10. grub2-mkconfig -o /boot/grub2/grub.cfg.
11. reboot

This is where both Proxmox and Vmware show the same behaviour and show that the CPU utilization of the VM is 100%.

They are currently working on trying to figure out why this is happening. In case you spot something unusual in above commands (especially for a VM), please let me know. I would be really greatful.
There is a lot of modification of kernel commandline. Just a wild guess, but maybe the cstate-related settings? Otherwise, you'll probably have to "bisect" the settings somehow to find the problematic one(s).
 
There is a lot of modification of kernel commandline. Just a wild guess, but maybe the cstate-related settings? Otherwise, you'll probably have to "bisect" the settings somehow to find the problematic one(s).
Hi,

There are some further updates on this matter, just in case someone is curious to know.
The exact issue causing this lies in step 8.
If i leave out "idle=poll" from this step and set the corresponding parameters as below, the issue gets resolved.

GRUB_CMDLINE_LINUX="crashkernel=1G-4G:192M,4G-64G:256M,64G-:512M rd.lvm.lv=rl/root processor.max_cstate=1 intel_idle.max_cstate=0 intel_pstate=disable default_hugepagesz=1G hugepagesz=1G hugepages=1 intel_iommu=on iommu=pt selinux=0 enforcing=0 nmi_watchdog=0 audit=0 mce=off"


1711538661781.png
 
  • Like
Reactions: fiona
Hi there,
Same issue for me trying to install Proxmox Backup Server as a VM on Proxmox. KVM usage is at 100% when the VM runs.

I have tried pve-qemu-kvm 8.1.2-4, 8.1.2-5, 8.1.2-6, 8.1.5-2 and the most current version in the repository. Device is set to VirtIO SCSI

# pveversion -v
proxmox-ve: 8.2.0 (running kernel: 6.8.4-3-pve)
pve-manager: 8.2.2 (running version: 8.2.2/9355359cd7afbae4)
proxmox-kernel-helper: 8.1.0
proxmox-kernel-6.8: 6.8.4-3
proxmox-kernel-6.8.4-3-pve-signed: 6.8.4-3
proxmox-kernel-6.8.4-2-pve-signed: 6.8.4-2
ceph-fuse: 17.2.7-pve3
corosync: 3.1.7-pve3
criu: 3.17.1-2
glusterfs-client: 10.3-5
ifupdown2: 3.2.0-1+pmx8
intel-microcode: 3.20240514.1
ksm-control-daemon: 1.5-1
libjs-extjs: 7.0.0-4
libknet1: 1.28-pve1
libproxmox-acme-perl: 1.5.1
libproxmox-backup-qemu0: 1.4.1
libproxmox-rs-perl: 0.3.3
libpve-access-control: 8.1.4
libpve-apiclient-perl: 3.3.2
libpve-cluster-api-perl: 8.0.6
libpve-cluster-perl: 8.0.6
libpve-common-perl: 8.2.1
libpve-guest-common-perl: 5.1.1
libpve-http-server-perl: 5.1.0
libpve-network-perl: 0.9.8
libpve-rs-perl: 0.8.8
libpve-storage-perl: 8.2.1
libspice-server1: 0.15.1-1
lvm2: 2.03.16-2
lxc-pve: 6.0.0-1
lxcfs: 6.0.0-pve2
novnc-pve: 1.4.0-3
proxmox-backup-client: 3.2.2-1
proxmox-backup-file-restore: 3.2.2-1
proxmox-kernel-helper: 8.1.0
proxmox-mail-forward: 0.2.3
proxmox-mini-journalreader: 1.4.0
proxmox-offline-mirror-helper: 0.6.6
proxmox-widget-toolkit: 4.2.3
pve-cluster: 8.0.6
pve-container: 5.1.10
pve-docs: 8.2.2
pve-edk2-firmware: 4.2023.08-4
pve-esxi-import-tools: 0.7.0
pve-firewall: 5.0.7
pve-firmware: 3.11-1
pve-ha-manager: 4.0.4
pve-i18n: 3.2.2
pve-qemu-kvm: 8.1.5-2
pve-xtermjs: 5.3.0-3
qemu-server: 8.2.1
smartmontools: 7.3-pve1
spiceterm: 3.3.0
swtpm: 0.8.0+pve1
vncterm: 1.8.0
zfsutils-linux: 2.2.3-pve2

# qm config 100
balloon: 0
boot: order=scsi1
cores: 4
cpu: x86-64-v2
kvm: 0
machine: q35
memory: 3000
meta: creation-qemu=8.1.5,ctime=1715976988
name: PBSB
net0: virtio=BC:24:11:CC:38:0B,bridge=vmbr0
numa: 0
ostype: l26
scsi0: /dev/disk/by-id/ata-XXXXXXXXXXXXXXXXXXXXXXXXXXXXXX,ssd=1
scsi1: local:iso/proxmox-backup-server_3.2-1.iso,media=cdrom,size=1119264K
scsihw: virtio-scsi-pci
smbios1: uuid=a679faa4-23ee-4f5a-b896-d4dad70f6a4b
sockets: 1
vmgenid: 73c00174-b894-4dbc-9409-49132c80f96a
 
Hi,
# qm config 100
...
kvm: 0
my first guess would be this. It seems like you are not using KVM. This means that every CPU instruction in the guest needs to be emulated on the host and that will require many more CPU instructions overall.
 
Just reporting that this just happened to me on one node, pausing and resuming the VM resolved the issue.

pveversion:

proxmox-ve: 8.2.0 (running kernel: 6.8.8-2-pve)
pve-manager: 8.2.4 (running version: 8.2.4/faa83925c9641325)
proxmox-kernel-helper: 8.1.0
pve-kernel-5.15: 7.4-14
proxmox-kernel-6.8: 6.8.8-2
proxmox-kernel-6.8.8-2-pve-signed: 6.8.8-2
pve-kernel-5.15.158-1-pve: 5.15.158-1
pve-kernel-5.15.143-1-pve: 5.15.143-1
pve-kernel-5.15.131-2-pve: 5.15.131-3
pve-kernel-5.15.102-1-pve: 5.15.102-1
pve-kernel-5.15.30-2-pve: 5.15.30-3
ceph-fuse: 17.2.7-pve3
corosync: 3.1.7-pve3
criu: 3.17.1-2
glusterfs-client: 10.3-5
ifupdown2: 3.2.0-1+pmx8
ksm-control-daemon: 1.5-1
libjs-extjs: 7.0.0-4
libknet1: 1.28-pve1
libproxmox-acme-perl: 1.5.1
libproxmox-backup-qemu0: 1.4.1
libproxmox-rs-perl: 0.3.3
libpve-access-control: 8.1.4
libpve-apiclient-perl: 3.3.2
libpve-cluster-api-perl: 8.0.7
libpve-cluster-perl: 8.0.7
libpve-common-perl: 8.2.1
libpve-guest-common-perl: 5.1.3
libpve-http-server-perl: 5.1.0
libpve-network-perl: 0.9.8
libpve-rs-perl: 0.8.9
libpve-storage-perl: 8.2.3
libspice-server1: 0.15.1-1
lvm2: 2.03.16-2
lxc-pve: 6.0.0-1
lxcfs: 6.0.0-pve2
novnc-pve: 1.4.0-3
proxmox-backup-client: 3.2.4-1
proxmox-backup-file-restore: 3.2.4-1
proxmox-firewall: 0.4.2
proxmox-kernel-helper: 8.1.0
proxmox-mail-forward: 0.2.3
proxmox-mini-journalreader: 1.4.0
proxmox-offline-mirror-helper: 0.6.6
proxmox-widget-toolkit: 4.2.3
pve-cluster: 8.0.7
pve-container: 5.1.12
pve-docs: 8.2.2
pve-edk2-firmware: 4.2023.08-4
pve-esxi-import-tools: 0.7.1
pve-firewall: 5.0.7
pve-firmware: 3.12-1
pve-ha-manager: 4.0.5
pve-i18n: 3.2.2
pve-qemu-kvm: 9.0.0-3
pve-xtermjs: 5.3.0-3
qemu-server: 8.2.1
smartmontools: 7.3-pve1
spiceterm: 3.3.0
swtpm: 0.8.0+pve1
vncterm: 1.8.0
zfsutils-linux: 2.2.4-pve1
 
Hello, this happened again today on the same node, node CPU at 50% while the 3 VMs have very low CPU usage (~5%), however, pausing and resuming the VMs didn't help this time. I also tried systemctl restart pveproxy pvedaemon with no avail.

pveversion:

proxmox-ve: 8.2.0 (running kernel: 5.15.143-1-pve)
pve-manager: 8.2.4 (running version: 8.2.4/faa83925c9641325)
proxmox-kernel-helper: 8.1.0
pve-kernel-5.15: 7.4-14
proxmox-kernel-6.8: 6.8.8-4
proxmox-kernel-6.8.8-4-pve-signed: 6.8.8-4
proxmox-kernel-6.8.8-2-pve-signed: 6.8.8-2
pve-kernel-5.15.158-1-pve: 5.15.158-1
pve-kernel-5.15.143-1-pve: 5.15.143-1
pve-kernel-5.15.131-2-pve: 5.15.131-3
pve-kernel-5.15.102-1-pve: 5.15.102-1
pve-kernel-5.15.30-2-pve: 5.15.30-3
ceph-fuse: 17.2.7-pve3
corosync: 3.1.7-pve3
criu: 3.17.1-2
glusterfs-client: 10.3-5
ifupdown2: 3.2.0-1+pmx9
ksm-control-daemon: 1.5-1
libjs-extjs: 7.0.0-4
libknet1: 1.28-pve1
libproxmox-acme-perl: 1.5.1
libproxmox-backup-qemu0: 1.4.1
libproxmox-rs-perl: 0.3.3
libpve-access-control: 8.1.4
libpve-apiclient-perl: 3.3.2
libpve-cluster-api-perl: 8.0.7
libpve-cluster-perl: 8.0.7
libpve-common-perl: 8.2.1
libpve-guest-common-perl: 5.1.4
libpve-http-server-perl: 5.1.0
libpve-network-perl: 0.9.8
libpve-rs-perl: 0.8.9
libpve-storage-perl: 8.2.3
libspice-server1: 0.15.1-1
lvm2: 2.03.16-2
lxc-pve: 6.0.0-1
lxcfs: 6.0.0-pve2
novnc-pve: 1.4.0-3
proxmox-backup-client: 3.2.7-1
proxmox-backup-file-restore: 3.2.7-1
proxmox-firewall: 0.5.0
proxmox-kernel-helper: 8.1.0
proxmox-mail-forward: 0.2.3
proxmox-mini-journalreader: 1.4.0
proxmox-offline-mirror-helper: 0.6.6
proxmox-widget-toolkit: 4.2.3
pve-cluster: 8.0.7
pve-container: 5.1.12
pve-docs: 8.2.2
pve-edk2-firmware: 4.2023.08-4
pve-esxi-import-tools: 0.7.1
pve-firewall: 5.0.7
pve-firmware: 3.13-1
pve-ha-manager: 4.0.5
pve-i18n: 3.2.2
pve-qemu-kvm: 9.0.0-6
pve-xtermjs: 5.3.0-3
qemu-server: 8.2.3
smartmontools: 7.3-pve1
spiceterm: 3.3.0
swtpm: 0.8.0+pve1
vncterm: 1.8.0
zfsutils-linux: 2.2.4-pve1
 
Hi,
Hello, this happened again today on the same node, node CPU at 50% while the 3 VMs have very low CPU usage (~5%), however, pausing and resuming the VMs didn't help this time. I also tried systemctl restart pveproxy pvedaemon with no avail.
please monitor which process on the host is using the CPU with something like top/htop.

proxmox-ve: 8.2.0 (running kernel: 5.15.143-1-pve)
Any particular reason for using kernel 5.15? Does the issue also occur with kernel 6.8?
 
Hi,

please monitor which process on the host is using the CPU with something like top/htop.

It is KVM, it was high for all 3 vms although the VM CPU was not high in itself.


Any particular reason for using kernel 5.15? Does the issue also occur with kernel 6.8?


I have upgraded from proxmox 7 to 8 and didn't restart the node (same on all nodes), I migrated the VMs and restarted the node and the issue is gone for now.
 
It is KVM, it was high for all 3 vms although the VM CPU was not high in itself.
Should the issue happen again, please share the configuration of the affected VMs (qm config <ID>). Are there any special tasks like backup happening around the time the issue occurs? Is there anything in the host's system log/journal?
 
now I checked and it seems that every time this happened it started at 06:00, I have a backup job (snapshot) at 02:00

I don't have any cronjobs that happen at 06:00 besides the hourly "sync; echo 3 > /proc/sys/vm/drop_caches"

Edit: checked syslog around the time it started happening, besides the hourly cronjobs I have there is no error/warning there


1722412624466.png
 
Last edited:
It happened again, but I couldn't find anything unusual in the syslog.

So it happened at 06:00 and now at 18:00, some kind of ajob that runs every 12h? the issue is that the other nodes are identical and nothing is happening there.
1722443983486.png
1722443806092.png
 
So it happened at 06:00 and now at 18:00, some kind of ajob that runs every 12h? the issue is that the other nodes are identical and nothing is happening there.
Do you mean with the same guest migrated to a different node? Or are these different guests?

Can you share the VM configuration qm config <ID> of these guests? What is running inside the guests (OS/workload/any special jobs in the VM)? How do you check the CPU usage there? Is there heavy IO or network traffic happening in the guests around the time of the issue?
 
I migrated the guests back to the node, the issue persisted overnight. However, the next morning when I checked, it appears that the problem had resolved itself.

All three VMs are running Windows Server 2022. They handle minimal load, primarily a MySQL database and a process that typically consumes less than 10% of CPU resources.

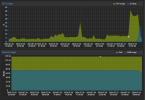
CPU usage within each VM appears normal, both in Task Manager and the Proxmox Summary, but the total CPU usage of the node remains unexpectedly high.

1722515994268.png
VM1:

Code:
agent: 1
args: -vnc 0.0.0.0:3,password=on
balloon: 8192
bios: seabios
boot: cda
bootdisk: virtio0
cores: 4
cpu: cputype=host
cpulimit: 0
memory: 8192
meta: creation-qemu=7.2.0,ctime=1707613238
name: ZdV75mOiVb.mmitech.localhost
net0: virtio=00:16:3e:0e:8b:a6,bridge=vmbr1
numa: 1
onboot: 1
scsihw: virtio-scsi-pci
smbios1: uuid=9ea5b416-e8e8-4cd8-af58-88291c5a27cc
sockets: 1
virtio0: data:vm-1004-dbFBx3GulTW7PaU4-sPvURH8aqmomr1gh,cache=writeback,iops=10000,mbps_rd=650,mbps_wr=650,size=100G
vmgenid: 3cc6ea14-3871-4b59-a6d5-34cc7ed1efdd

VM2:

Code:
agent: 1
args: -vnc 0.0.0.0:2,password=on
balloon: 32768
bios: seabios
boot: cda
bootdisk: virtio0
cores: 16
cpu: cputype=host
cpulimit: 0
localtime: 1
memory: 32768
meta: creation-qemu=9.0.0,ctime=1720097670
name: xQvMrHBxfK.mmitech.localhost
net0: virtio=BC:24:11:DF:2E:5B,bridge=vmbr1
numa: 1
onboot: 1
ostype: other
smbios1: uuid=7a034466-9573-4c18-bccc-90e6e26e52b8
sockets: 1
virtio0: data:vm-1389-disk-0,cache=writeback,format=raw,iops=10000,mbps_rd=500,mbps_wr=500,size=305G
vmgenid: af695852-6fcd-499d-bb22-e04b3e2578ee

VM3:


Code:
agent: 1
args: -vnc 0.0.0.0:1,password=on
balloon: 32768
bios: seabios
boot: cda
bootdisk: virtio0
cores: 16
cpu: cputype=host
cpulimit: 0
localtime: 1
memory: 32768
meta: creation-qemu=9.0.0,ctime=1720567011
name: qjwdid38UX.mmitech.localhost
net0: virtio=00:16:3e:ae:6d:3d,bridge=vmbr1
numa: 1
onboot: 1
ostype: other
smbios1: uuid=d0109856-8a07-4643-92aa-0ccb13b4adf6
sockets: 1
virtio0: data:vm-1392-deiBMqv8jYgi1HL4-Bsc6pugEuKo3Z5E3,cache=writeback,iops=10000,mbps_rd=500,mbps_wr=500,size=300G
vmgenid: baf35a31-3569-4699-aa7d-15534580bc27
 
Last edited:
I don't have any cronjobs that happen at 06:00 besides the hourly "sync; echo 3 > /proc/sys/vm/drop_caches"
Is there any special reason you do this? It's not recommended (from the kernel docs):
Use of this file can cause performance problems. Since it discards cached
objects, it may cost a significant amount of I/O and CPU to recreate the
dropped objects, especially if they were under heavy use. Because of this,
use outside of a testing or debugging environment is not recommended.
 
Is there any special reason you do this? It's not recommended (from the kernel docs):
Yes, I have this from some time ago when a VM disk corrupted after a node crashed unexpectedly (hardware issue) so I was a bit paranoid, but now thinking about it, I think it makes no sense since the same could happen regardless.
 
Hi there,
Same issue for me trying to start a VM on Proxmox. KVM usage is at 100% when the VM runs.
In host, cpu is:
Code:
root@node1:~# top
top - 19:15:23 up 6 days,  2:51,  5 users,  load average: 11.31, 11.11, 11.15
Tasks: 1304 total,   2 running, 1302 sleeping,   0 stopped,   0 zombie
%Cpu(s): 10.2 us,  1.2 sy,  0.0 ni, 80.5 id,  0.0 wa,  0.0 hi,  0.0 si,  0.0 st
MiB Mem : 772498.4 total, 402415.0 free, 120777.5 used, 254304.8 buff/cache     
MiB Swap:   8192.0 total,   8191.7 free,      0.2 used. 651720.9 avail Mem

    PID USER      PR  NI    VIRT    RES    SHR S  %CPU  %MEM     TIME+ COMMAND                                                                                                                                                         
   9042 root      20   0   18.5g   3.9g  26112 S 817.6   0.5     6w+6d kvm                                                                                                                                                             
 738595 root      20   0   43928  36864   9984 R 100.0   0.0   0:00.18 qm                                                                                                                                                               
3056086 root      20   0   68.0g   7.0g  26880 S  58.8   0.9 153:44.64 kvm                                                                                                                                                             
 738594 root      20   0   12420   5376   3072 R  17.6   0.0   0:00.04 top                                                                                                                                                             
2976153 root      20   0 2618752   9216   9216 S  17.6   0.0  78:52.80 kvm                                                                                                                                                             
   3949 ceph      20   0 4802144   3.0g  50688 S  11.8   0.4     13,32 ceph-osd
The thread 9042 cpu usage is 817%.

But cpu usage is 0% in vm.
Code:
root@test-cloud230:~# top
top - 11:04:37 up 6 days,  2:39,  2 users,  load average: 8.00, 8.00, 8.00
Tasks: 168 total,   1 running, 167 sleeping,   0 stopped,   0 zombie
%Cpu(s): 99.9 us,  0.1 sy,  0.0 ni,  0.0 id,  0.0 wa,  0.0 hi,  0.0 si,  0.0 st
MiB Mem :  16254.5 total,  12623.4 free,   3180.4 used,    748.5 buff/cache     
MiB Swap:   4096.0 total,   4096.0 free,      0.0 used.  13074.0 avail Mem

    PID USER      PR  NI    VIRT    RES    SHR S  %CPU  %MEM     TIME+ COMMAND                                                                                                                                                         
 897665 root      20   0       0      0      0 I   0.3   0.0   0:00.03 kworker/u16:2-events_power_efficient                                                                                                                             
1737248 fwupd-r+  20   0  442188  26856  16640 S   0.3   0.2   0:20.47 fwupdmgr                                                                                                                                                         
      1 root      20   0   22204  13220   9380 S   0.0   0.1   1:10.32 systemd                                                                                                                                                         
      2 root      20   0       0      0      0 S   0.0   0.0   0:00.28 kthreadd                                                                                                                                                         
      3 root      20   0       0      0      0 S   0.0   0.0   0:00.00 pool_workqueue_release                                                                                                                                           
      4 root       0 -20       0      0      0 I   0.0   0.0   0:00.00 kworker/R-rcu_g                                                                                                                                                 
      5 root       0 -20       0      0      0 I   0.0   0.0   0:00.00 kworker/R-rcu_p                                                                                                                                                 
      6 root       0 -20       0      0      0 I   0.0   0.0   0:00.00 kworker/R-slub_                                                                                                                                                 
      7 root       0 -20       0      0      0 I   0.0   0.0   0:00.00 kworker/R-netns                                                                                                                                                 
      9 root       0 -20       0      0      0 I   0.0   0.0   0:00.00 kworker/0:0H-events_highpri                                                                                                                                     
     12 root       0 -20       0      0      0 I   0.0   0.0   0:00.00 kworker/R-mm_pe                                                                                                                                                 
     13 root      20   0       0      0      0 I   0.0   0.0   0:00.00 rcu_tasks_kthread                                                                                                                                               
     14 root      20   0       0      0      0 I   0.0   0.0   0:00.00 rcu_tasks_rude_kthread                                                                                                                                           
     15 root      20   0       0      0      0 I   0.0   0.0   0:00.00 rcu_tasks_trace_kthread
My proxmox version is:
Code:
root@node1:/boot/grub# pveversion -v
proxmox-ve: 8.2.0 (running kernel: 6.8.4-2-pve)
pve-manager: 8.2.7 (running version: 8.2.7/47eb7a235c8ed7c0)
proxmox-kernel-helper: 8.1.0
proxmox-kernel-6.8: 6.8.4-2
proxmox-kernel-6.8.4-2-pve-signed: 6.8.4-2
ceph: 18.2.0-pve2
ceph-fuse: 18.2.0-pve2
corosync: 3.1.7-pve3
criu: 3.17.1-2
glusterfs-client: 10.3-5
ifupdown2: 3.2.0-1+pmx8
ksm-control-daemon: 1.5-1
libjs-extjs: 7.0.0-4
libknet1: 1.28-pve1
libproxmox-acme-perl: 1.5.0
libproxmox-backup-qemu0: 1.4.1
libproxmox-rs-perl: 0.3.4
libpve-access-control: 8.2.0
libpve-apiclient-perl: 3.3.2
libpve-cluster-api-perl: 8.0.7
libpve-cluster-perl: 8.0.7
libpve-common-perl: 8.2.3
libpve-guest-common-perl: 5.1.4
libpve-http-server-perl: 5.1.1
libpve-network-perl: 0.9.8
libpve-rs-perl: 0.8.10
libpve-storage-perl: 8.2.6
libqb0: not correctly installed
libspice-server1: 0.15.1-1
lvm2: 2.03.16-2
lxc-pve: 6.0.0-1
lxcfs: 6.0.0-pve2
novnc-pve: 1.4.0-3
openvswitch-switch: 3.1.0-2
proxmox-backup-client: 3.2.7-1
proxmox-backup-file-restore: 3.2.0-1
proxmox-firewall: 0.3.0
proxmox-kernel-helper: 8.1.0
proxmox-mail-forward: 0.2.3
proxmox-mini-journalreader: 1.4.0
proxmox-offline-mirror-helper: 0.6.6
proxmox-widget-toolkit: 4.2.4
pve-cluster: 8.0.6
pve-container: 5.2.0
pve-docs: 8.2.1
pve-edk2-firmware: 4.2023.08-4
pve-esxi-import-tools: 0.7.0
pve-firewall: 5.0.5
pve-firmware: 3.11-1
pve-ha-manager: 4.0.5
pve-i18n: 3.2.2
pve-qemu-kvm: 8.2.2-1
pve-xtermjs: 5.3.0-3
qemu-server: 8.2.1
smartmontools: 7.3-pve1
spiceterm: 3.3.0
swtpm: 0.8.0+pve1
vncterm: 1.8.0
zfsutils-linux: 2.2.3-pve2

My vm config is :
Code:
root@node1:/boot/grub# qm config 7333
agent: 0
boot: order=scsi0;net0
cipassword: **********
ciuser: root
cores: 8
cpu: host
description: test
hotplug: disk,network,usb,memory,cpu
ipconfig0: ip=192.168.2.230/23,gw=192.168.2.1
memory: 16384
meta: creation-qemu=7.2.0,ctime=1728455608
name: txm-test-cloud230
net0: virtio=BC:24:11:24:85:87,bridge=vmbr0,firewall=1
numa: 1
onboot: 1
ostype: l26
scsi0: ceph-nvme-hdd:vm-7333-disk-0,iothread=1,size=100G
scsi1: ceph-nvme-hdd:vm-7333-cloudinit,media=cdrom,size=4M
scsihw: virtio-scsi-single
smbios1: uuid=914984b3-84f0-4ee7-96c1-f1d8134f9651
sockets: 1
vcpus: 8
vmgenid: e55aeeb1-43bf-4417-a0b6-e93b336bc363

This gdb info about kvm in attach file:

The system call statistic is:
Code:
root@node1:~# strace -c -p $(cat /var/run/qemu-server/7333.pid)
strace: Process 9042 attached
^Cstrace: Process 9042 detached
% time     seconds  usecs/call     calls    errors syscall
------ ----------- ----------- --------- --------- ----------------
 40.43    0.073997           2     35627           write
 38.25    0.070005           7      9852           ppoll
 10.38    0.019004           2      9230           read
 10.38    0.018996           2      8645           recvmsg
  0.55    0.000999          29        34           accept4
  0.00    0.000001           0       986           ioctl
  0.00    0.000001           0       316           sendmsg
  0.00    0.000000           0        34           close
  0.00    0.000000           0        34           getsockname
  0.00    0.000000           0        68           fcntl
  0.00    0.000000           0       170         6 futex
------ ----------- ----------- --------- --------- ----------------
100.00    0.183003           2     64996         6 total
root@node1:/boot/grub# strace -c -p $(cat /var/run/qemu-server/7333.pid)
strace: Process 9042 attached
^Cstrace: Process 9042 detached
% time     seconds  usecs/call     calls    errors syscall
------ ----------- ----------- --------- --------- ----------------
 37.76    0.053994           6      8031           ppoll
 37.07    0.053005           1     29140           write
 13.99    0.019999           2      7562           read
 10.49    0.014999           2      7098           recvmsg
  0.70    0.001000           4       203           sendmsg
  0.00    0.000000           0        28           close
  0.00    0.000000           0       854           ioctl
  0.00    0.000000           0        28           getsockname
  0.00    0.000000           0        56           fcntl
  0.00    0.000000           0       127           futex
  0.00    0.000000           0        28           accept4
------ ----------- ----------- --------- --------- ----------------
100.00    0.142997           2     53155           total

root@node1:/boot/grub# strace -c -p $(cat /var/run/qemu-server/7333.pid)
strace: Process 9042 attached
^Cstrace: Process 9042 detached
% time     seconds  usecs/call     calls    errors syscall
------ ----------- ----------- --------- --------- ----------------
 40.30    0.078996           7     10878           ppoll
 30.11    0.059014           1     39415           write
 13.27    0.026003           2      9599           recvmsg
 13.26    0.025997           2     10241           read
  1.53    0.003000          20       144           futex
  1.02    0.002000          52        38           accept4
  0.51    0.001002           3       276           sendmsg
  0.00    0.000001           0      1182           ioctl
  0.00    0.000000           0        38           close
  0.00    0.000000           0        38           getsockname
  0.00    0.000000           0        76           fcntl
------ ----------- ----------- --------- --------- ----------------
100.00    0.196013           2     71925           total

root@node1:/boot/grub# strace -c -p $(cat /var/run/qemu-server/7333.pid)
strace: Process 9042 attached
^Cstrace: Process 9042 detached
% time     seconds  usecs/call     calls    errors syscall
------ ----------- ----------- --------- --------- ----------------
 49.15    0.057992          11      5237           ppoll
 34.74    0.040993           2     18910           write
  8.48    0.010003           2      4905           read
  6.78    0.008004           1      4606           recvmsg
  0.85    0.001000           7       133           sendmsg
  0.00    0.000001           0       584           ioctl
  0.00    0.000000           0        18           close
  0.00    0.000000           0        18           getsockname
  0.00    0.000000           0        36           fcntl
  0.00    0.000000           0        88           futex
  0.00    0.000000           0        18           accept4
------ ----------- ----------- --------- --------- ----------------
100.00    0.117993           3     34553           total
 

Attachments

Hi,
But cpu usage is 0% in vm.
Code:
root@test-cloud230:~# top

top - 11:04:37 up 6 days,  2:39,  2 users,  load average: 8.00, 8.00, 8.00
Tasks: 168 total,   1 running, 167 sleeping,   0 stopped,   0 zombie
%Cpu(s): 99.9 us,  0.1 sy,  0.0 ni,  0.0 id,  0.0 wa,  0.0 hi,  0.0 si,  0.0 st
No, it shows 99.9% user, 0.0% idle. And the load average is also 8.00.
Just a wild guess, but it might be a malicious process that tries to hide itself. Did the issue happen directly after VM creation or start at some later date (you can check the usage graphs for the VM in the UI)? Can you trust the place you got the installation media from?

What is the output of the following command (should show all currently running processes, in particularproc/self is expected)?
Code:
grep 'R (running)' /proc/*/status

My proxmox version is:
Code:
root@node1:/boot/grub# pveversion -v
proxmox-ve: 8.2.0 (running kernel: 6.8.4-2-pve)
Proxmox VE 8.2 is quite old, consider upgrading to a current version:
https://pve.proxmox.com/wiki/Package_Repositories
https://pve.proxmox.com/pve-docs/chapter-sysadmin.html#system_software_updates