Wrong memory usage on KVM VM

decibel83

Renowned Member
Oct 15, 2008
210
1
83
Hi,
I am using a pfSense 2.4 (FreeBSD based) virtual machine on KVM and I see a different RAM usage in Proxmox than in the VM itself.

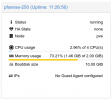
Proxmox shows more than 90% of RAM usage (~ 15Gb of 16 Gb):

Screen Shot 2018-05-14 at 10.45.26.png

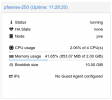
but both pfSense and FreeBSD are showing only 2% of usage:

Screen Shot 2018-05-14 at 10.45.42.png

But the virtual machine is giving me some "Cannot allocate memory" errors, so I am thinking we are having some problems on memory allocation from Proxmox to FreeBSD.

My PVE version:

Code:
root@node03:/# pveversion -v
proxmox-ve: 5.1-38 (running kernel: 4.13.13-5-pve)
pve-manager: 5.1-43 (running version: 5.1-43/bdb08029)
pve-kernel-4.13.4-1-pve: 4.13.4-26
pve-kernel-4.13.13-2-pve: 4.13.13-33
pve-kernel-4.13.13-5-pve: 4.13.13-38
pve-kernel-4.13.13-3-pve: 4.13.13-34
libpve-http-server-perl: 2.0-8
lvm2: 2.02.168-pve6
corosync: 2.4.2-pve3
libqb0: 1.0.1-1
pve-cluster: 5.0-19
qemu-server: 5.0-20
pve-firmware: 2.0-3
libpve-common-perl: 5.0-25
libpve-guest-common-perl: 2.0-14
libpve-access-control: 5.0-7
libpve-storage-perl: 5.0-17
pve-libspice-server1: 0.12.8-3
vncterm: 1.5-3
pve-docs: 5.1-16
pve-qemu-kvm: 2.9.1-6
pve-container: 2.0-18
pve-firewall: 3.0-5
pve-ha-manager: 2.0-4
ksm-control-daemon: 1.2-2
glusterfs-client: 3.8.8-1
lxc-pve: 2.1.1-2
lxcfs: 2.0.8-1
criu: 2.11.1-1~bpo90
novnc-pve: 0.6-4
smartmontools: 6.5+svn4324-1
zfsutils-linux: 0.7.4-pve2~bpo9

My VM configuration:

Code:
root@node03:/# cat /etc/pve/qemu-server/301.conf
#Firewall primario (master)
bootdisk: virtio0
cores: 2
cpu: qemu64
memory: 16384
name: fw1
net0: virtio=AE:07:1B:36:63:36,bridge=vmbr0
net1: virtio=1E:DC:6A:BF:15:74,bridge=vmbr1,tag=11
net2: virtio=FA:2D:27:2B:02:1C,bridge=vmbr1,tag=12
net3: virtio=9E:09:23:ED:37:08,bridge=vmbr1,tag=14
net4: virtio=76:8B:4E:AF:43:1A,bridge=vmbr1,tag=235
net5: virtio=46:BE:88:AD:6F:91,bridge=vmbr1,tag=1988
net6: virtio=AA:4C:A9:70:8C:63,bridge=vmbr1,tag=3297
net7: virtio=5A:90:45:0B:AF:CB,bridge=vmbr1,tag=13
numa: 0
onboot: 1
ostype: other
parent: Before_Upgrade
smbios1: uuid=a0a1af13-55ad-43a9-afa5-770c106f530b
sockets: 1
virtio0: local-lvm:vm-301-disk-1,size=32G

[PENDING]
balloon: 0

[Before_Upgrade]
#Before upgrade to 2.4.1
bootdisk: virtio0
cores: 2
cpu: qemu64
machine: pc-i440fx-2.9
memory: 16384
name: fw1
net0: virtio=AE:07:1B:36:63:36,bridge=vmbr0
net1: virtio=1E:DC:6A:BF:15:74,bridge=vmbr1,tag=11
net2: virtio=FA:2D:27:2B:02:1C,bridge=vmbr1,tag=12
net3: virtio=9E:09:23:ED:37:08,bridge=vmbr1,tag=14
net4: virtio=76:8B:4E:AF:43:1A,bridge=vmbr1,tag=235
net5: virtio=46:BE:88:AD:6F:91,bridge=vmbr1,tag=1988
net6: virtio=AA:4C:A9:70:8C:63,bridge=vmbr1,tag=3297
net7: virtio=5A:90:45:0B:AF:CB,bridge=vmbr1,tag=13
numa: 0
onboot: 1
ostype: other
smbios1: uuid=a0a1af13-55ad-43a9-afa5-770c106f530b
snaptime: 1518724974
sockets: 1
virtio0: local-lvm:vm-301-disk-1,size=32G
vmstate: local-lvm:vm-301-state-Before_Upgrade

What's wrong?
Could you help me please?

Thank you very much!
 
Hi,

check if you have enabled ballooning in the pfsense.

on pfSense 2.2 and later the VirtIO Driver Support enabled by default:
"The following instructions are not necessary on pfSense 2.2 and later, which have the proper drivers built into the kernel."
 
Same problem with Kerio connect and Kerio control apliances (debian based) virtual machines, i'ts like when the VM use in any moment a high RAM usage for e moment Proxxmox get freeze the graph with de higest value in the usage and don't came down ever until reboot VM. Please some ideas are needed to solve the issue. thanks to anyone that help us .
 
already installed quemu-agent in the Kerio's VM and tested with qm agent VM ping from proxxmox console by the way, I don't know any thing more to do
 
I'm having same issue with pfsense run inside a VM.
Proxmox reports 94% Memory use however within the VM it states I'm using 401M of 15G.
 
I have the same problem on Proxmox 6.0-7 and Pfsense 2.4.4-RELEASE-p3
Bumping to see if anyone has thoughts or suggestions on this?

memory.jpg
 
I suspect that the memory "usage" from Proxmox's perspective and pfsense's perspective are different because those "bars" are counting "used" memory in different ways.

If you give a modern OS a bunch of free RAM, it will use RAM as "cache" space. Pfsense is no exception to this. Some pfsense packages will easily "fill" as much RAM as they have available with cached data over time (squid/snort/suricata). This RAM will appear as "unused" from within the OS, since it isn't committed to anything, but might not be distinguishable as unused from the hypervisors perspective. This is common.

If you want pfsense to use less memory (cache less data), provision less memory for its VM. 16GB is a lot of memory for pfsense. If your configuration requires it, sure, go for it, if not, trim back. Most common pfsense deployments run inside of 2-4GB easily.

If you want to see a breakdown of pfsense's memory usage, run top -SH
 
Same problem in 2020.

Different definition of "free" isn't the problem. Running top shows that nearly no RAM is used for buffering and the RAM in the GUI goes to over 90% in less then 10 seconds after booting the VM. Looking at the RAM usage inside the VM using top the VM is never over 20% used including buffer.
 
My opinion, Proxmox "pressure/inflate/deflate on mem. balloon" algorithm is not "aggressiv" enough for FreeBSD.
Maybe new Option (FreeBSD) in OS Type, and more "aggressive" algorithm for mem. balloon handling?

pfsense 2.5.0-DEVELOPMENT (FreeBSD 12.2-STABLE):
Screenshot from 2020-12-09 10-46-15.png

Proxmox Monitor (in my case, for testing only) -> "balloon 1024" wait a bit "balloon 2048"

before and after:
Screenshot from 2020-12-09 10-44-30.pngScreenshot from 2020-12-09 10-45-55.png
 
Last edited:
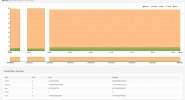
If I see that right OPNsense is telling me that 82% of RAM is really free and not used by the cache. Proxmox tells me that 82% of RAM is being used. Does proxmox interpretes free as used maybe?

ramopnsense.jpg
ramopnsenseproxmox.jpg
 
Last edited:
Did some additional testing:

Changed RAM from 2 to 1 GB and proxmox shows 71% used and OPNsense shows 71% free.
Changed RAM from 1 to 4 GB and proxmox shows 91% used and OPNsense shows 92% free.
Changed RAM from 4GB to 512MB and proxmox shows 56% used and OPNsense shows 56% free.

So really looks like Proxmox is showing an inverted value.

Is there any way to tell proxmox not to invert it?

I'm not using balooning or quemu guest agent because I wan't able to find a version working for FreeBSD. If its just a cosmetic thing its not a big problem but I'm worried that this influences all the ballooning of the over VMs or swapping/KSM behavior on the host itself if the VM is telling that it is using a multiple of the RAM that is used in reality.
 
Last edited:
2021 January, Proxmox Version 6.3-3

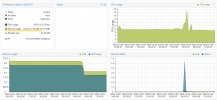
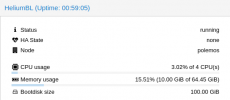
Experiencing the same issue on Helium BunsenLabs VM, my VM was using more and more RAM for a task and at 10GB usage Proxmox stopped updating. I closed the process after I was done, dropping the VM's memory usage to 340MB of RAM, but Proxmox remained stuck at 10GB. After continuing to work on the VM for a short while after, it's still just under 1GB of RAM usage but the Proxmox web interface is stuck at 10GB.

Additionally, my attempts to restart the qemu-guest-agent did not help. All other metrics on my proxmox dashboard are accurate. Using another browser, clearing caches, refreshing the page, do not affect the data, only restarting the VM or the node seems to change anything.

Proxmox Web Int.png Helium BL VM.png
 
Last edited:

About

The Proxmox community has been around for many years and offers help and support for Proxmox VE, Proxmox Backup Server, and Proxmox Mail Gateway.
We think our community is one of the best thanks to people like you!

Get your subscription!

The Proxmox team works very hard to make sure you are running the best software and getting stable updates and security enhancements, as well as quick enterprise support. Tens of thousands of happy customers have a Proxmox subscription. Get yours easily in our online shop.

Buy now!