VM I/O Performance with Ceph Storage

Done a quick Disk Benchmark on my Homeserver (little Xeon with Enterprise-Disks):
The "lost" between PVE Host & Debian VM is lesser than 4% (Writeback Cache enabled)
While Benchmark is running, the I/O-Delay goes max up to 5-10%

If it is your private Hp Server, i would reinstall it from scratch step by step (with the new Disks).

Which Power-Profile is active on your G9? Hopefully Static High-Performance.
 
Last edited:
Nope, as described in the first post it is not just one homeserver but a productive 3 - Node Proxmox / Ceph cluster, running ~30 VMs on it partly used by customers, so reinstalling from scratch would really be "suboptimal"

The Cluster is running for a longer time now with this configuration and - as already mentioned too - the performance was quit ok after freshly installed and in the time after. But somewhen it decreases... slowly over a longer time or suddenly - we can't really figure out.
Ok. First, try a new Disk on one Node and we will see.
 
Ok. First, try a new Disk on one Node and we will see.
Yep, fingers crossed... It's really frustrating, as we are searching for the root cause for some weeks now and didn't really get hands on it till today... and so many contradictory facts / situations... o_O
 
Another question: What about network latencies? We found this:

https://www.cubewerk.de/2020/10/23/ceph-performance-guide-2020-for-ssd-nvme/

There one can read:

What can affect the overall performance of a ceph-cluster?
Slow network (latency!), bad/slow disks, lack of CPU-cycles.
[...]
ping -c 100 IP of your ceph node
Ran above ping test from one node to another.
0.05-0.07ms latency is ok.
[...]
When we do that in our cluster (in the 40Gb RSTP Loop Network, directly connected, no switch involved) we have those values:
172.20.81.11 -> 172.20.81.12:
# ping 172.20.81.12
PING 172.20.81.12 (172.20.81.12) 56(84) bytes of data.
64 bytes from 172.20.81.12: icmp_seq=1 ttl=64 time=0.103 ms
64 bytes from 172.20.81.12: icmp_seq=2 ttl=64 time=0.092 ms
64 bytes from 172.20.81.12: icmp_seq=3 ttl=64 time=0.110 ms
64 bytes from 172.20.81.12: icmp_seq=4 ttl=64 time=0.146 ms
64 bytes from 172.20.81.12: icmp_seq=5 ttl=64 time=0.121 ms
64 bytes from 172.20.81.12: icmp_seq=6 ttl=64 time=0.101 ms
64 bytes from 172.20.81.12: icmp_seq=7 ttl=64 time=0.127 ms
64 bytes from 172.20.81.12: icmp_seq=8 ttl=64 time=0.095 ms
64 bytes from 172.20.81.12: icmp_seq=9 ttl=64 time=0.120 ms
[...]
rtt min/avg/max/mdev = 0.092/0.112/0.146/0.016 ms

172.20.81.11 -> 172.20.81.13:
# ping 172.20.81.13
PING 172.20.81.13 (172.20.81.13) 56(84) bytes of data.
64 bytes from 172.20.81.13: icmp_seq=1 ttl=64 time=0.102 ms
64 bytes from 172.20.81.13: icmp_seq=2 ttl=64 time=0.068 ms
64 bytes from 172.20.81.13: icmp_seq=3 ttl=64 time=0.084 ms
64 bytes from 172.20.81.13: icmp_seq=4 ttl=64 time=0.058 ms
64 bytes from 172.20.81.13: icmp_seq=5 ttl=64 time=0.071 ms
64 bytes from 172.20.81.13: icmp_seq=6 ttl=64 time=0.064 ms
64 bytes from 172.20.81.13: icmp_seq=7 ttl=64 time=0.095 ms
64 bytes from 172.20.81.13: icmp_seq=8 ttl=64 time=0.097 ms
64 bytes from 172.20.81.13: icmp_seq=9 ttl=64 time=0.140 ms
64 bytes from 172.20.81.13: icmp_seq=10 ttl=64 time=0.134 ms
64 bytes from 172.20.81.13: icmp_seq=11 ttl=64 time=0.073 ms
64 bytes from 172.20.81.13: icmp_seq=12 ttl=64 time=0.069 ms
64 bytes from 172.20.81.13: icmp_seq=13 ttl=64 time=0.067 ms
64 bytes from 172.20.81.13: icmp_seq=14 ttl=64 time=0.061 ms
64 bytes from 172.20.81.13: icmp_seq=15 ttl=64 time=0.062 ms
64 bytes from 172.20.81.13: icmp_seq=16 ttl=64 time=0.081 ms
[...]
rtt min/avg/max/mdev = 0.058/0.082/0.140/0.024 ms

172.20.81.12 -> 172.20.81.13:
# ping 172.20.81.13
PING 172.20.81.13 (172.20.81.13) 56(84) bytes of data.
64 bytes from 172.20.81.13: icmp_seq=1 ttl=64 time=0.077 ms
64 bytes from 172.20.81.13: icmp_seq=2 ttl=64 time=0.077 ms
64 bytes from 172.20.81.13: icmp_seq=3 ttl=64 time=0.058 ms
64 bytes from 172.20.81.13: icmp_seq=4 ttl=64 time=0.084 ms
64 bytes from 172.20.81.13: icmp_seq=5 ttl=64 time=0.061 ms
64 bytes from 172.20.81.13: icmp_seq=6 ttl=64 time=0.062 ms
64 bytes from 172.20.81.13: icmp_seq=7 ttl=64 time=0.061 ms
64 bytes from 172.20.81.13: icmp_seq=8 ttl=64 time=0.076 ms
64 bytes from 172.20.81.13: icmp_seq=9 ttl=64 time=0.076 ms
64 bytes from 172.20.81.13: icmp_seq=10 ttl=64 time=0.083 ms
64 bytes from 172.20.81.13: icmp_seq=11 ttl=64 time=0.067 ms
64 bytes from 172.20.81.13: icmp_seq=12 ttl=64 time=0.063 ms
64 bytes from 172.20.81.13: icmp_seq=13 ttl=64 time=0.063 ms
64 bytes from 172.20.81.13: icmp_seq=14 ttl=64 time=0.065 ms
64 bytes from 172.20.81.13: icmp_seq=15 ttl=64 time=0.068 ms
64 bytes from 172.20.81.13: icmp_seq=16 ttl=64 time=0.067 ms
64 bytes from 172.20.81.13: icmp_seq=17 ttl=64 time=0.064 ms
64 bytes from 172.20.81.13: icmp_seq=18 ttl=64 time=0.066 ms
[...]
rtt min/avg/max/mdev = 0.058/0.068/0.084/0.007 ms

Conclusion:
Latencies of Node1 <-> Node2, Node1 <-> Node3 seems to be high (and always higher, than the recommended 0.05-0.07), whereas just the latencies between Node2 <-> and Node3 look slightly better and are in range of 0.05 - 0.07

Could that play a role in our case somehow?
 
do you have results from iperf between the hosts?
overall this could be a relevant issue.

however there is something you said which pretty much matches your issue:
"The Cluster is running for a longer time now with this configuration and - as already mentioned too - the performance was quit ok after freshly installed and in the time after. But somewhen it decreases... slowly over a longer time or suddenly - we can't really figure out."

this is a classic issue for consumer drives. because TRIMM is not enabled, the drives are not doing garbage collection so they start well, but the moment the drives fill up - writes over time,
there is no longer efficiency and that would render the drives close to unusable (this is also why there is always a recommendation to keep around 10% unused for better memory provisioning) to avoid the saturation of the drive.

we saw cases where SSD/NVMe drives (non enterprise as DC/ENT drives have built in garbage collection) they start well and at some point they get to a level of up to 1MB/s making them close to unusable for customers.


I hope you will find the culprit, it does seem like you have more issues than just a simple drive replacement issue.
 
  • Like
Reactions: ITT
1.) replace the Consumer-Grade Disks to Enterprise-Grade
2.) update your Firmware on the Mellanoxes
3.) be happy

EDIT: Your Ping Values are good, nothing worry about.
 
Last edited:
do you have results from iperf between the hosts?
overall this could be a relevant issue.
Yes, we already postet this early:

1673878678985-png.45661


however there is something you said which pretty much matches your issue:
"The Cluster is running for a longer time now with this configuration and - as already mentioned too - the performance was quit ok after freshly installed and in the time after. But somewhen it decreases... slowly over a longer time or suddenly - we can't really figure out."

this is a classic issue for consumer drives. because TRIMM is not enabled, the drives are not doing garbage collection so they start well, but the moment the drives fill up - writes over time,
there is no longer efficiency and that would render the drives close to unusable (this is also why there is always a recommendation to keep around 10% unused for better memory provisioning) to avoid the saturation of the drive.

we saw cases where SSD/NVMe drives (non enterprise as DC/ENT drives have built in garbage collection) they start well and at some point they get to a level of up to 1MB/s making them close to unusable for customers.
I would be completely with you. But as we assumes sth. like that too, we freed the NVMEs, removed /wiped them from ceph and - at the moment - just added the 2TB ones back to ceph. So IMHO they are now completely empty, but the fio tests are as bad as described above (and so are the HDD fio tests). Or have I misunderstood and it doesn't matter if they were cleaned, removed, and added again?

I hope you will find the culprit, it does seem like you have more issues than just a simple drive replacement issue.
That is exactly what I want to say the whole time and what we are afraid of: we are going to replace the NVMes with enterprise ones in the next days, but the problem persists... perhaps not as bad as now, but nevertheless remains...
 
  • Like
Reactions: ITT
When running your fio tests on the host (directly testing the NVME) - can you change the rw parameter from write to randwrite and see how the performance is afterwards? This should more closely resemble how Ceph writes the data to the disk.

edit: You could also try turning off write cache, as described in the respective Ceph documentation [1]

[1] https://docs.ceph.com/en/quincy/start/hardware-recommendations/#write-caches
 
Last edited:
When running your fio tests on the host (directly testing the NVME) - can you change the rw parameter from write to randwrite and see how the performance is afterwards? This should more closely resemble how Ceph writes the data to the disk.
Of course:
Code:
# fio --ioengine=libaio --filename=/dev/nvme0n1 --direct=1 --sync=1 --rw=randwrite --bs=4K --numjobs=1 --iodepth=1 --runtime=60 --time_based --name=fio
fio: (g=0): rw=randwrite, bs=(R) 4096B-4096B, (W) 4096B-4096B, (T) 4096B-4096B, ioengine=libaio, iodepth=1
fio-3.25
Starting 1 process
Jobs: 1 (f=1): [w(1)][100.0%][w=4512KiB/s][w=1128 IOPS][eta 00m:00s]
fio: (groupid=0, jobs=1): err= 0: pid=2445672: Thu Jan 19 11:10:45 2023
  write: IOPS=1148, BW=4596KiB/s (4706kB/s)(269MiB/60001msec); 0 zone resets
    slat (nsec): min=1982, max=965174, avg=11519.80, stdev=6974.54
    clat (usec): min=14, max=20743, avg=853.80, stdev=206.56
     lat (usec): min=414, max=20753, avg=865.65, stdev=206.70
    clat percentiles (usec):
     |  1.00th=[  619],  5.00th=[  783], 10.00th=[  799], 20.00th=[  807],
     | 30.00th=[  816], 40.00th=[  824], 50.00th=[  832], 60.00th=[  840],
     | 70.00th=[  848], 80.00th=[  857], 90.00th=[  898], 95.00th=[ 1090],
     | 99.00th=[ 1188], 99.50th=[ 1565], 99.90th=[ 2278], 99.95th=[ 2507],
     | 99.99th=[13829]
   bw (  KiB/s): min= 4320, max= 4768, per=100.00%, avg=4600.27, stdev=105.82, samples=119
   iops        : min= 1080, max= 1192, avg=1150.07, stdev=26.45, samples=119
  lat (usec)   : 20=0.01%, 500=0.13%, 750=4.49%, 1000=86.02%
  lat (msec)   : 2=9.12%, 4=0.21%, 10=0.01%, 20=0.01%, 50=0.01%
  cpu          : usr=0.97%, sys=2.17%, ctx=80093, majf=0, minf=7469
  IO depths    : 1=100.0%, 2=0.0%, 4=0.0%, 8=0.0%, 16=0.0%, 32=0.0%, >=64=0.0%
     submit    : 0=0.0%, 4=100.0%, 8=0.0%, 16=0.0%, 32=0.0%, 64=0.0%, >=64=0.0%
     complete  : 0=0.0%, 4=100.0%, 8=0.0%, 16=0.0%, 32=0.0%, 64=0.0%, >=64=0.0%
     issued rwts: total=0,68936,0,0 short=0,0,0,0 dropped=0,0,0,0
     latency   : target=0, window=0, percentile=100.00%, depth=1

Run status group 0 (all jobs):
  WRITE: bw=4596KiB/s (4706kB/s), 4596KiB/s-4596KiB/s (4706kB/s-4706kB/s), io=269MiB (282MB), run=60001-60001msec

Disk stats (read/write):
  nvme0n1: ios=43/68791, merge=0/0, ticks=4/58002, in_queue=58005, util=99.88%

==> Nearly identical values, as with rw=write: IOPS=1148, BW=4596KiB/s, lat=0,8msec


edit: You could also try turning off write cache, as described in the respective Ceph documentation [1]

[1] https://docs.ceph.com/en/quincy/start/hardware-recommendations/#write-caches
WCE was disabled by default at all SAS HDDs. During try - and - error we activated it last week, saw a massive decrease in OSD latencies and so thought, this would be better for performance...so it is not, despite lower OSD lats?
 
Can you run the fio benchmarks for 600 seconds instead?
This should help reduce the amount of influence caches possibly have on the results.
 
Can you run the fio benchmarks for 600 seconds instead?
This should help reduce the amount of influence caches possibly have on the results.
Sure, here it is:

Code:
# fio --ioengine=libaio --filename=/dev/nvme0n1 --direct=1 --sync=1 --rw=randwrite --bs=4K --numjobs=1 --iodepth=1 --runtime=600 --time_based --name=fio
fio: (g=0): rw=randwrite, bs=(R) 4096B-4096B, (W) 4096B-4096B, (T) 4096B-4096B, ioengine=libaio, iodepth=1
fio-3.25
Starting 1 process
Jobs: 1 (f=1): [w(1)][100.0%][w=4580KiB/s][w=1145 IOPS][eta 00m:00s]
fio: (groupid=0, jobs=1): err= 0: pid=2651385: Thu Jan 19 12:56:04 2023
  write: IOPS=1156, BW=4625KiB/s (4736kB/s)(2710MiB/600001msec); 0 zone resets
    slat (usec): min=2, max=943, avg=11.07, stdev= 6.96
    clat (usec): min=13, max=47744, avg=849.88, stdev=209.91
     lat (usec): min=404, max=47753, avg=861.28, stdev=210.06
    clat percentiles (usec):
     |  1.00th=[  611],  5.00th=[  775], 10.00th=[  791], 20.00th=[  807],
     | 30.00th=[  816], 40.00th=[  824], 50.00th=[  832], 60.00th=[  832],
     | 70.00th=[  840], 80.00th=[  857], 90.00th=[  898], 95.00th=[ 1074],
     | 99.00th=[ 1287], 99.50th=[ 1696], 99.90th=[ 2442], 99.95th=[ 2638],
     | 99.99th=[13829]
   bw (  KiB/s): min= 4024, max= 4832, per=100.00%, avg=4627.92, stdev=114.85, samples=1199
   iops        : min= 1006, max= 1208, avg=1156.94, stdev=28.70, samples=1199
  lat (usec)   : 20=0.01%, 50=0.01%, 250=0.01%, 500=0.17%, 750=4.75%
  lat (usec)   : 1000=85.70%
  lat (msec)   : 2=9.13%, 4=0.24%, 10=0.01%, 20=0.01%, 50=0.01%
  cpu          : usr=1.02%, sys=1.91%, ctx=805485, majf=0, minf=22842
  IO depths    : 1=100.0%, 2=0.0%, 4=0.0%, 8=0.0%, 16=0.0%, 32=0.0%, >=64=0.0%
     submit    : 0=0.0%, 4=100.0%, 8=0.0%, 16=0.0%, 32=0.0%, 64=0.0%, >=64=0.0%
     complete  : 0=0.0%, 4=100.0%, 8=0.0%, 16=0.0%, 32=0.0%, 64=0.0%, >=64=0.0%
     issued rwts: total=0,693777,0,0 short=0,0,0,0 dropped=0,0,0,0
     latency   : target=0, window=0, percentile=100.00%, depth=1

Run status group 0 (all jobs):
  WRITE: bw=4625KiB/s (4736kB/s), 4625KiB/s-4625KiB/s (4736kB/s-4736kB/s), io=2710MiB (2842MB), run=600001-600001msec

Disk stats (read/write):
  nvme0n1: ios=43/693632, merge=0/0, ticks=4/583120, in_queue=583123, util=100.00%

==> And again identical values: IOPS=1156, BW=4625KiB/s, lat=0,8ms
 
Any news regarding this issue ? One month passed since last comment on this thread :) and people are watching ... If any teachings can be learned from your experience ... you should share it . Thank you and good luck.
 
So for finishing this thread, here the current situation:
First of all, we never really found out, what was going wrong in the Proxmox/Ceph Cluster. What we did till today is this:
  • Took an older HP Proliant Server, installed Proxmox on it
  • Migrated all VMs and their data to this single Server, running just those VMs which where absolutly neccessary
    (BTW: Storage was just a bunch of Linux software (MD) raid 1 with LVM-Thin on top out of a few local cheap SSDs (Not NVMe) and HDDs... I/O Performance was here much better, than ceph was in the problematic cluster)
  • In the meanwhile ordered 3 more 40Gbit Mellanox NICs and 6 NVMes (Kingston Data Center DC1000B) and PCIe Adapters
  • Distributed the new hardware to the 3 former Servers
  • Concerning the NVMes: as there were now 2 per server we made sure to use those PCIe Ports which are "near" to one of the two CPU Socket each.
  • We freshly installed Proxmox on one of the former Proxmox Server, made a bunch of fio benchmarks directly at the new NVMes, saw quit good results.
  • We made a new Proxmox Cluster out of the 3 servers and configured ceph with defaults, just removed all cephx - auth stuff.
  • Partitioned each NVMe with 2 Partitions for having 2 OSDs per NVMe
  • Made Crush Rules which uses the NVMes and HDDs separately, build Proxmox Storage Pools out of them
  • Network is now configured like this:
    • 1 RSTP 40GBit Loop just for Proxmox Cluster/Migration Traffic, MTU=9000
    • 1 RSTP 40GBiT Loop just for Ceph Cluster Traffic. This is also used as the "public" Network for Ceph Clients (the VMs), MTU=9000
    • 4 Ports NiC (1Gbit each) connected to the switch for outside traffic
  • Installed a VM, made further IO Tests and Benchmarks... these where WAY better, than before
  • Migrated back a productive but not as important VM from the Single Proxmox Server to the Cluster... checked I/O Performance... everything good
  • So slowly migrated back one VM after the other back to the Cluster

Conclusion:
  • Today the Cluster is running fine and I/O Performance is as good as it was never before, as far as we can remember
  • Those values are shown in Grafana most of the time, just slightly higher values from time to time:
    1677358197155.png
    (Remember the horrible values we had in the old cluster)
  • This is the OSD view of one Server in Proxmox, again much much better lat. values, even for the HDD OSDs:
    1677358336948.png
  • So we can't imagine that solely the NVMe change is responsible alone for the better performance, as HDD perform better, as well
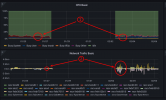
  • The only thing what we noticed is this graph:
    1677358843802.png
    This is showing the CPU / Network stats of one of the Proxmox Server. The left part is during the "old" problematic cluster, the right side the new installed cluster with partly new hardware.
    What can be seen:
    -> Much higher Iowaits than nowadays (1)
    -> Much lower network performance than nowadays (2)
    Could be some sort of explanation....partly.... who knows....
 
Last edited:

About

The Proxmox community has been around for many years and offers help and support for Proxmox VE, Proxmox Backup Server, and Proxmox Mail Gateway.
We think our community is one of the best thanks to people like you!

Get your subscription!

The Proxmox team works very hard to make sure you are running the best software and getting stable updates and security enhancements, as well as quick enterprise support. Tens of thousands of happy customers have a Proxmox subscription. Get yours easily in our online shop.

Buy now!