I have just replaced our backup server with a Dell machine running a pair of 8 core Xeon Gold 6144's with 512GB of RAM, and 24 x 12G 7.68TB SAS SSD's in a hardware RAID 10 on a Dell PERC H740P (I have tested ZFS as well via HBA mode).
The PBS box has a pair of 40Gb NIC's in a LACP to our Nexus rack switches running vPC.
Our proxmox hosts are a pair of 24 core Xeon Platinum 8268's with 1TB of RAM, with 8 x 4TB Data Centre SATA SSD's in a hardware RAID 10 on a Dell PERC H740P.
The proxmox boxes have 2 x 10Gb NIC's in a LACP to our Nexus rack switches running vPC.
No routing between the proxmox hosts and pbs, straight layer 2 connectivity in same VLAN.
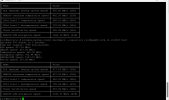
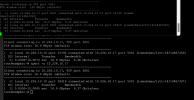
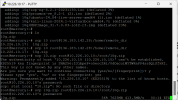
Despite this hardware, backup and restore performance isn't what I was hoping for. Netting what appears to be a consistent 200-300MB/s. See data below showing an SCP transfer able to pull 500MB/s, which obviously includes a TLS overhead, also see an iPERF able to max out the single 10Gbit NIC in any of the bonds on our hosts.
I understand the CPU bound TLS limit, but why am I not hitting this when running backups? Is it related to a chunk verify process which the benchmark shows to be around 250MB/s?
IO Delay is sub 0.1% on all hosts, pretty much 0 all the time. Yet backup performance of a new VM looks like this:
Why so slow? Where can I look for a bottleneck?
Here is a comprehensive set of disk benchmarks on the proxmox nodes:
/dev/sda3 is the main RAID10 on the PVE nodes:
The PBS box has a pair of 40Gb NIC's in a LACP to our Nexus rack switches running vPC.
Our proxmox hosts are a pair of 24 core Xeon Platinum 8268's with 1TB of RAM, with 8 x 4TB Data Centre SATA SSD's in a hardware RAID 10 on a Dell PERC H740P.
The proxmox boxes have 2 x 10Gb NIC's in a LACP to our Nexus rack switches running vPC.
No routing between the proxmox hosts and pbs, straight layer 2 connectivity in same VLAN.
Despite this hardware, backup and restore performance isn't what I was hoping for. Netting what appears to be a consistent 200-300MB/s. See data below showing an SCP transfer able to pull 500MB/s, which obviously includes a TLS overhead, also see an iPERF able to max out the single 10Gbit NIC in any of the bonds on our hosts.
I understand the CPU bound TLS limit, but why am I not hitting this when running backups? Is it related to a chunk verify process which the benchmark shows to be around 250MB/s?


IO Delay is sub 0.1% on all hosts, pretty much 0 all the time. Yet backup performance of a new VM looks like this:
Code:
NFO: scsi0: dirty-bitmap status: created new
INFO:   0% (620.0 MiB of 80.0 GiB) in 3s, read: 206.7 MiB/s, write: 170.7 MiB/s
INFO:   1% (1.0 GiB of 80.0 GiB) in 6s, read: 142.7 MiB/s, write: 142.7 MiB/s
INFO:   2% (1.7 GiB of 80.0 GiB) in 11s, read: 136.8 MiB/s, write: 136.8 MiB/s
INFO:   3% (2.5 GiB of 80.0 GiB) in 17s, read: 138.0 MiB/s, write: 138.0 MiB/s
INFO:   4% (3.3 GiB of 80.0 GiB) in 23s, read: 132.7 MiB/s, write: 132.7 MiB/s
INFO:   5% (4.1 GiB of 80.0 GiB) in 29s, read: 138.7 MiB/s, write: 138.7 MiB/s
INFO:   6% (4.9 GiB of 80.0 GiB) in 35s, read: 130.0 MiB/s, write: 130.0 MiB/s
INFO:   7% (5.6 GiB of 80.0 GiB) in 41s, read: 132.0 MiB/s, write: 132.0 MiB/s
INFO:   8% (6.5 GiB of 80.0 GiB) in 48s, read: 123.4 MiB/s, write: 123.4 MiB/s
INFO:   9% (7.3 GiB of 80.0 GiB) in 55s, read: 125.1 MiB/s, write: 125.1 MiB/s
INFO:  10% (8.1 GiB of 80.0 GiB) in 1m 1s, read: 129.3 MiB/s, write: 129.3 MiB/s
INFO:  11% (8.8 GiB of 80.0 GiB) in 1m 7s, read: 125.3 MiB/s, write: 125.3 MiB/s
INFO:  12% (9.7 GiB of 80.0 GiB) in 1m 14s, read: 128.6 MiB/s, write: 128.6 MiB/s
INFO:  13% (10.4 GiB of 80.0 GiB) in 1m 20s, read: 126.7 MiB/s, write: 126.7 MiB/s
INFO:  14% (11.3 GiB of 80.0 GiB) in 1m 27s, read: 119.4 MiB/s, write: 119.4 MiB/s
INFO:  15% (12.1 GiB of 80.0 GiB) in 1m 33s, read: 136.7 MiB/s, write: 136.0 MiB/s
INFO:  16% (12.8 GiB of 80.0 GiB) in 1m 39s, read: 130.7 MiB/s, write: 130.7 MiB/s
INFO:  17% (13.7 GiB of 80.0 GiB) in 1m 46s, read: 127.4 MiB/s, write: 127.4 MiB/s
INFO:  18% (14.5 GiB of 80.0 GiB) in 1m 52s, read: 130.0 MiB/s, write: 130.0 MiB/s
INFO:  19% (15.3 GiB of 80.0 GiB) in 1m 58s, read: 138.7 MiB/s, write: 138.7 MiB/s
INFO:  20% (16.1 GiB of 80.0 GiB) in 2m 4s, read: 134.7 MiB/s, write: 133.3 MiB/s
INFO:  21% (16.9 GiB of 80.0 GiB) in 2m 10s, read: 141.3 MiB/s, write: 141.3 MiB/s
INFO:  22% (17.7 GiB of 80.0 GiB) in 2m 16s, read: 144.7 MiB/s, write: 144.7 MiB/s
INFO:  23% (18.4 GiB of 80.0 GiB) in 2m 21s, read: 142.4 MiB/s, write: 142.4 MiB/s
INFO:  26% (20.9 GiB of 80.0 GiB) in 2m 24s, read: 844.0 MiB/s, write: 93.3 MiB/s
INFO:  27% (21.9 GiB of 80.0 GiB) in 2m 27s, read: 342.7 MiB/s, write: 117.3 MiB/s
INFO:  28% (22.5 GiB of 80.0 GiB) in 2m 31s, read: 142.0 MiB/s, write: 142.0 MiB/s
INFO:  29% (23.3 GiB of 80.0 GiB) in 2m 38s, read: 128.0 MiB/s, write: 126.9 MiB/s
INFO:  30% (24.0 GiB of 80.0 GiB) in 2m 43s, read: 140.0 MiB/s, write: 139.2 MiB/s
INFO:  31% (24.8 GiB of 80.0 GiB) in 2m 50s, read: 115.4 MiB/s, write: 115.4 MiB/s
INFO:  32% (25.7 GiB of 80.0 GiB) in 2m 57s, read: 132.0 MiB/s, write: 132.0 MiB/s
INFO:  33% (26.5 GiB of 80.0 GiB) in 3m 3s, read: 136.0 MiB/s, write: 136.0 MiB/s
INFO:  34% (27.2 GiB of 80.0 GiB) in 3m 9s, read: 123.3 MiB/s, write: 123.3 MiB/s
INFO:  35% (28.1 GiB of 80.0 GiB) in 3m 16s, read: 124.6 MiB/s, write: 124.6 MiB/s
INFO:  36% (28.8 GiB of 80.0 GiB) in 3m 22s, read: 124.7 MiB/s, write: 124.7 MiB/s
INFO:  37% (29.7 GiB of 80.0 GiB) in 3m 28s, read: 150.7 MiB/s, write: 150.7 MiB/s
INFO:  38% (30.5 GiB of 80.0 GiB) in 3m 35s, read: 119.4 MiB/s, write: 119.4 MiB/s
INFO:  40% (32.3 GiB of 80.0 GiB) in 3m 38s, read: 598.7 MiB/s, write: 114.7 MiB/s
INFO:  41% (32.9 GiB of 80.0 GiB) in 3m 43s, read: 128.8 MiB/s, write: 128.8 MiB/s
INFO:  42% (33.7 GiB of 80.0 GiB) in 3m 48s, read: 161.6 MiB/s, write: 161.6 MiB/s
INFO:  43% (34.4 GiB of 80.0 GiB) in 3m 54s, read: 127.3 MiB/s, write: 127.3 MiB/s
INFO:  44% (35.3 GiB of 80.0 GiB) in 4m 1s, read: 121.7 MiB/s, write: 121.7 MiB/s
INFO:  45% (36.0 GiB of 80.0 GiB) in 4m 7s, read: 129.3 MiB/s, write: 129.3 MiB/s
INFO:  46% (36.8 GiB of 80.0 GiB) in 4m 13s, read: 134.7 MiB/s, write: 134.7 MiB/s
INFO:  47% (37.7 GiB of 80.0 GiB) in 4m 19s, read: 148.0 MiB/s, write: 148.0 MiB/s
INFO:  48% (38.4 GiB of 80.0 GiB) in 4m 25s, read: 127.3 MiB/s, write: 127.3 MiB/s
INFO:  49% (39.3 GiB of 80.0 GiB) in 4m 31s, read: 148.0 MiB/s, write: 148.0 MiB/s
INFO:  50% (40.0 GiB of 80.0 GiB) in 4m 37s, read: 124.0 MiB/s, write: 124.0 MiB/s
INFO:  51% (40.9 GiB of 80.0 GiB) in 4m 41s, read: 220.0 MiB/s, write: 119.0 MiB/s
INFO:  52% (41.7 GiB of 80.0 GiB) in 4m 47s, read: 144.7 MiB/s, write: 140.0 MiB/s
INFO:  53% (42.5 GiB of 80.0 GiB) in 4m 52s, read: 150.4 MiB/s, write: 150.4 MiB/s
INFO:  54% (43.3 GiB of 80.0 GiB) in 4m 59s, read: 122.9 MiB/s, write: 122.9 MiB/s
INFO:  55% (44.0 GiB of 80.0 GiB) in 5m 5s, read: 128.0 MiB/s, write: 128.0 MiB/s
INFO:  56% (44.9 GiB of 80.0 GiB) in 5m 11s, read: 143.3 MiB/s, write: 142.0 MiB/s
INFO:  57% (45.6 GiB of 80.0 GiB) in 5m 17s, read: 123.3 MiB/s, write: 123.3 MiB/s
INFO:  58% (46.5 GiB of 80.0 GiB) in 5m 24s, read: 128.0 MiB/s, write: 128.0 MiB/s
INFO:  59% (47.3 GiB of 80.0 GiB) in 5m 30s, read: 140.0 MiB/s, write: 132.7 MiB/s
INFO:  60% (48.2 GiB of 80.0 GiB) in 5m 36s, read: 145.3 MiB/s, write: 124.7 MiB/s
INFO:  61% (48.9 GiB of 80.0 GiB) in 5m 41s, read: 145.6 MiB/s, write: 144.8 MiB/s
INFO:  62% (49.7 GiB of 80.0 GiB) in 5m 48s, read: 121.7 MiB/s, write: 121.7 MiB/s
INFO:  63% (50.4 GiB of 80.0 GiB) in 5m 54s, read: 122.0 MiB/s, write: 122.0 MiB/s
INFO:  64% (51.3 GiB of 80.0 GiB) in 6m 1s, read: 124.0 MiB/s, write: 124.0 MiB/s
INFO:  65% (52.0 GiB of 80.0 GiB) in 6m 7s, read: 127.3 MiB/s, write: 127.3 MiB/s
INFO:  66% (52.9 GiB of 80.0 GiB) in 6m 14s, read: 125.1 MiB/s, write: 125.1 MiB/s
INFO:  67% (53.7 GiB of 80.0 GiB) in 6m 20s, read: 144.7 MiB/s, write: 144.7 MiB/s
INFO:  68% (54.6 GiB of 80.0 GiB) in 6m 24s, read: 221.0 MiB/s, write: 165.0 MiB/s
INFO:  69% (55.2 GiB of 80.0 GiB) in 6m 29s, read: 132.8 MiB/s, write: 132.8 MiB/s
INFO:  73% (58.7 GiB of 80.0 GiB) in 6m 34s, read: 708.8 MiB/s, write: 133.6 MiB/s
INFO:  89% (71.3 GiB of 80.0 GiB) in 6m 37s, read: 4.2 GiB/s, write: 0 B/s
INFO: 100% (80.0 GiB of 80.0 GiB) in 6m 40s, read: 2.9 GiB/s, write: 1.3 MiB/s
INFO: Waiting for server to finish backup validation...
INFO: backup is sparse: 29.32 GiB (36%) total zero data
INFO: backup was done incrementally, reused 29.35 GiB (36%)
INFO: transferred 80.00 GiB in 401 seconds (204.3 MiB/s)
Why so slow? Where can I look for a bottleneck?
Here is a comprehensive set of disk benchmarks on the proxmox nodes:
/dev/sda3 is the main RAID10 on the PVE nodes:
Code:
1) fio --ioengine=libaio --direct=1 --sync=1 --rw=read --bs=4k --numjobs=1 --iodepth=1 --runtime=30 --time_based --buffered=0 --name XXX --filename=/dev/sda3
2) fio --ioengine=libaio --direct=1 --sync=1 --rw=randread --bs=4k --numjobs=1 --iodepth=1 --runtime=30 --time_based --buffered=0 --name XXX --filename=/dev/sda3
3) fio --ioengine=libaio --direct=1 --sync=1 --rw=randread --bs=4k --numjobs=1 --iodepth=8 --runtime=30 --time_based --buffered=0 --name XXX --filename=/dev/sda3
4) fio --ioengine=libaio --direct=1 --sync=1 --rw=randread --bs=4k --numjobs=1 --iodepth=64 --runtime=30 --time_based --buffered=0 --name XXX --filename=/dev/sda3
5) fio --ioengine=libaio --direct=1 --sync=1 --rw=randread --bs=4k --numjobs=1 --iodepth=256 --runtime=30 --time_based --buffered=0 --name XXX --filename=/dev/sda3
6) fio --ioengine=libaio --direct=1 --sync=1 --rw=read --bs=1M --numjobs=1 --iodepth=1 --runtime=30 --time_based --buffered=0 --name XXX --filename=/dev/sda3
7) fio --ioengine=libaio --direct=1 --sync=1 --rw=read --bs=4M --numjobs=1 --iodepth=1 --runtime=30 --time_based --buffered=0 --name XXX --filename=/dev/sda3
8) fio --ioengine=libaio --direct=1 --sync=1 --rw=write --bs=4k --numjobs=1 --iodepth=1 --runtime=30 --time_based --buffered=0 --name XXX --filename=/dev/sda3
9) fio --ioengine=libaio --direct=1 --sync=1 --rw=randwrite --bs=4k --numjobs=1 --iodepth=1 --runtime=30 --time_based --buffered=0 --name XXX --filename=/dev/sda3
10) fio --ioengine=libaio --direct=1 --sync=1 --rw=randwrite --bs=4k --numjobs=1 --iodepth=8 --runtime=30 --time_based --buffered=0 --name XXX --filename=/dev/sda3
11) fio --ioengine=libaio --direct=1 --sync=1 --rw=randwrite --bs=4k --numjobs=1 --iodepth=64 --runtime=30 --time_based --buffered=0 --name XXX --filename=/dev/sda3
12) fio --ioengine=libaio --direct=1 --sync=1 --rw=randwrite --bs=4k --numjobs=1 --iodepth=256 --runtime=30 --time_based --buffered=0 --name XXX --filename=/dev/sda3
13) fio --ioengine=libaio --direct=1 --sync=1 --rw=write --bs=1M --numjobs=1 --iodepth=1 --runtime=30 --time_based --buffered=0 --name XXX --filename=/dev/sda3
14) fio --ioengine=libaio --direct=1 --sync=1 --rw=write --bs=4M --numjobs=1 --iodepth=1 --runtime=30 --time_based --buffered=0 --name XXX --filename=/dev/sda3
15) fio --ioengine=libaio --direct=1 --sync=1 --randrepeat=1 --rw=randrw --rwmixread=75 --bs=4k --iodepth=64 --runtime=30 --time_based --buffered=0 --name XXX --filename=/dev/sda3


1) [r=147MiB/s][r=37.7k IOPS]
2) [r=97.0MiB/s][r=24.8k IOPS]
3) [r=297MiB/s][r=76.1k IOPS]
4) [r=482MiB/s][r=123k IOPS]
5) [r=507MiB/s][r=130k IOPS]
6) [r=2294MiB/s][r=2294 IOPS]
7) [r=1688MiB/s][r=422 IOPS]
8) [w=144MiB/s][w=36.8k IOPS]
9) [w=78.3MiB/s][w=20.0k IOPS]
10) [w=129MiB/s][w=33.0k IOPS]
11) [w=142MiB/s][w=36.5k IOPS]
12) [w=141MiB/s][w=36.0k IOPS]
13) [w=2017MiB/s][w=2017 IOPS]
14) [w=2016MiB/s][w=504 IOPS]
15) [r=284MiB/s,w=94.6MiB/s][r=72.6k,w=24.2k IOPS]
Last edited:

