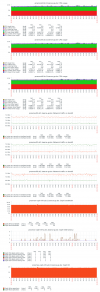
Benchmark: 3 node AMD EPYC 7742 64-Core, 512G RAM, 3x3 6,4TB Micron 9300 MAX NVMe

Rainerle

Renowned Member
Jan 29, 2019
120
33
68
Hi everbody,

we are currently in the process of replacing our VMware ESXi NFS Netapp setup with a ProxMox Ceph configuration.
We purchased 8 nodes with the following configuration:
- ThomasKrenn 1HE AMD Single-CPU RA1112
- AMD EPYC 7742 (2,25 GHz, 64-Core, 256 MB)
- 512 GB RAM
- 2x 240GB SATA III Intel SSD (ZFS Mirror Boot/OS Disk)
- 3x 6,4TB NVMe Micron 9300 MAX (Ceph OSD)
- Dualport 1GBit/s Intel i350-AM2 (onboard, two Corosync networks)
- Dualport 100GBit/s Mellanox ConnectX-5 QSFP28 (Ceph Cluster, Ceph Public, Proxmox Migration and Proxmox Access networks)

The eight nodes are connected using two 100G HPE SN2100M Mellanox switches using a MLAG configuration (active-passive) with Jumbo Frames and two Huawei CE6810-32T16S4Q-LI.

A three node cluster is planned for test, development and infrastructure KVM VMs, a five node cluster is planned for production KVM VMs.

All systems are already monitored using a Zabbix installation. Switches, network card and other firmwares and ProxMox are at the latest version.

We are currently running benchmarks and comparing our results to the 2020 benchmark on the three node cluster.

This thread is our log book of the problems and results we encounter.
 

Attachments

  • hw-info.txt
    11.8 KB · Views: 46
Last edited:
First test is to see if the network configuration is in order. 100GBit is 4 network streams combined, so at least 4 processes are required to test for the maximum.
Code:
root@proxmox04:~# iperf -c 10.33.0.15 -P 4
------------------------------------------------------------
Client connecting to 10.33.0.15, TCP port 5001
TCP window size:  325 KByte (default)
------------------------------------------------------------
[  5] local 10.33.0.14 port 49772 connected with 10.33.0.15 port 5001
[  4] local 10.33.0.14 port 49770 connected with 10.33.0.15 port 5001
[  3] local 10.33.0.14 port 49768 connected with 10.33.0.15 port 5001
[  6] local 10.33.0.14 port 49774 connected with 10.33.0.15 port 5001
[ ID] Interval       Transfer     Bandwidth
[  5]  0.0-10.0 sec  29.0 GBytes  24.9 Gbits/sec
[  4]  0.0-10.0 sec  28.9 GBytes  24.8 Gbits/sec
[  3]  0.0-10.0 sec  28.1 GBytes  24.1 Gbits/sec
[  6]  0.0-10.0 sec  28.9 GBytes  24.9 Gbits/sec
[SUM]  0.0-10.0 sec   115 GBytes  98.7 Gbits/sec
root@proxmox04:~#
 
Last edited:
  • Like
Reactions: datdenkikniet
Adjusted the network settings according to AMD Network Tuning Guide .
We did not use NUMA adjustments as we only have single socket CPUs.

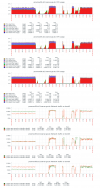
1602521894054.png

So this is a Zabbix screen over the three nodes. Details over the time ranges:
- From 07:00 - 10:25: Performancetest running over the weekend. promox04 performs better than the other three nodes. It took some time to identify that error. The other two nodes used systemd-boot - promox04 used grub to boot. We only configured "amd_iommu=on iommu=pt pcie_aspm=off" on the first node...
- It took some time to switch proxmox04 to use systemd-boot as well and then to configure /etc/kernel/cmdline properly.
- From 12:25 - 13:30: Running the same iperf test again over lunch break. Throughput is much better now and it still seems stable.
- From 14:40 to 14:45: Adjusted TX and RX Ring Sizes to the hardware and ran a test.
- Took some time to fiddle the additional setting into the configuration (we use ansible here...)
- From 15:45 to 16:15: Ran a test where 04 connects to 05, 05 connects to 06 and 06 connects to 04.
- Disabled C-States and cpuidle
- 17:00 - current: Started the overnight test.

Any feedback on further tuning measures is welcome!

To be continued...
 
  • Like
Reactions: datdenkikniet
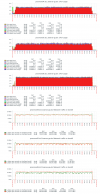
Result from the over night run
1602574039670.png

proxmox05 seems flaky, proxmox06 seems to uses less CPU than the rest. We need to check for configuration missmatches, it seems the nodes still have differences in their configuration.
 
We did not use NUMA adjustments as we only have single socket CPUs.
Depending on the CPU setting changed, the NUMA is adjusted as well. You might see the CPU exposing NUMA to the system.

root@proxmox04:~# iperf -c 10.33.0.15 -P 4
I also recommend qperf for testing. It will also display the latency of the network.

We are currently running benchmarks and comparing our results to the 2020 benchmark on the three node cluster.
And would you please be so kind and cross reference this link on the forum thread of the benchmark paper?
https://forum.proxmox.com/threads/proxmox-ve-ceph-benchmark-2020-09-hyper-converged-with-nvme.76516/
 
  • Like
Reactions: Rainerle
Took some time, but found the difference between the hosts: On the first two from previous tests some /etc/sysctl.d/ parameter files had been left behind...
 
Hi Alwin,
Depending on the CPU setting changed, the NUMA is adjusted as well. You might see the CPU exposing NUMA to the system.
The attachment to the initial post contains the output of lspcu showing "NUMA node(s): 1"

qperf was indeed new to me - will have a look at it.
 
Applied
Code:
root@proxmox04:~# cat /etc/sysctl.d/90-network-tuning.conf
# https://fasterdata.es.net/host-tuning/linux/100g-tuning/
# allow testing with buffers up to 512MB
net.core.rmem_max = 536870912
net.core.wmem_max = 536870912
# increase Linux autotuning TCP buffer limit to 256MB
net.ipv4.tcp_rmem = 4096 87380 268435456
net.ipv4.tcp_wmem = 4096 65536 268435456
# recommended for hosts with jumbo frames enabled
net.ipv4.tcp_mtu_probing=1
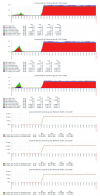
to all three nodes and ran "cpupower frequency-set -g performance" before this test:
1602593616120.png

Looking much better now.
 
Looking much better now.
What looks better? I seem to miss it. Comparing the two graphs, I only see that the first graphs are in 15 min intervals, while the last ones are in 2 min intervals.
 
I compared it to the one from the night (Post 4 ).

Ran the first rados bench (rados bench 60 --pool ceph-proxmox-VMs write -b 4M -t 16 --no-cleanup)
Code:
Total time run:         60.0131
Total writes made:      83597
Write size:             4194304
Object size:            4194304
Bandwidth (MB/sec):     5571.92
Stddev Bandwidth:       113.588
Max bandwidth (MB/sec): 5748
Min bandwidth (MB/sec): 5008
Average IOPS:           1392
Stddev IOPS:            28.3971
Max IOPS:               1437
Min IOPS:               1252
Average Latency(s):     0.0114852
Stddev Latency(s):      0.00977799
Max latency(s):         1.03765
Min latency(s):         0.00483123

How did you run three clients against one pool like in your PDF???

Currently using 4 OSDs per NVMe though...
 
How did you run three clients against one pool like in your PDF???
Hehe. :) I used tmux with synced panels. But you could just run the jobs with cron or at.

Currently using 4 OSDs per NVMe though...
Didn't help in my benchmarks, the write performance was split amongst the OSDs on the U.2. You may see that in your monitoring (atop in my case).

Ran the first rados bench (rados bench 60 --pool ceph-proxmox-VMs write -b 4M -t 16 --no-cleanup)
I suppose you will do it later on anyway, but let the benchmark run for longer. With more usage the performance may decline a little but it might be closer to what you might see in production.
 
So how would you add the three of them up then???
Code:
Total time run:         600.009
Total writes made:      369420
Write size:             4194304
Object size:            4194304
Bandwidth (MB/sec):     2462.76
Stddev Bandwidth:       172.924
Max bandwidth (MB/sec): 4932
Min bandwidth (MB/sec): 1856
Average IOPS:           615
Stddev IOPS:            43.231
Max IOPS:               1233
Min IOPS:               464
Average Latency(s):     0.0259866
Stddev Latency(s):      0.0310216
Max latency(s):         1.31802
Min latency(s):         0.00567992

Code:
Total time run:         600.085
Total writes made:      362959
Write size:             4194304
Object size:            4194304
Bandwidth (MB/sec):     2419.38
Stddev Bandwidth:       143.084
Max bandwidth (MB/sec): 3164
Min bandwidth (MB/sec): 1640
Average IOPS:           604
Stddev IOPS:            35.771
Max IOPS:               791
Min IOPS:               410
Average Latency(s):     0.0264505
Stddev Latency(s):      0.0319855
Max latency(s):         1.39796
Min latency(s):         0.00599677

Code:
Total time run:         600.159
Total writes made:      364969
Write size:             4194304
Object size:            4194304
Bandwidth (MB/sec):     2432.48
Stddev Bandwidth:       192.811
Max bandwidth (MB/sec): 5184
Min bandwidth (MB/sec): 1808
Average IOPS:           608
Stddev IOPS:            48.2027
Max IOPS:               1296
Min IOPS:               452
Average Latency(s):     0.0263094
Stddev Latency(s):      0.0311469
Max latency(s):         0.783012
Min latency(s):         0.00582972

The graph looks ok except for the latency bit...

1602603434709.png
 
So how would you add the three of them up then???
Since they are running in parallel, I just summed them up. Roughly 7.2 GB/s in your post. Just to note, that I have used a bench on each client.

But you may also use fio and run directly against the Ceph pool. This allows for greater flexibility in conducting the benchmark.
 
@Alwin : How did you run three rados bench seq read clients???

First node starts fine, but the next node gives:
Code:
root@proxmox05:~# rados bench 28800 --pool ceph-proxmox-VMs seq -t 16
hints = 1
  sec Cur ops   started  finished  avg MB/s  cur MB/s last lat(s)  avg lat(s)
    0       0         0         0         0         0           -           0
benchmark_data_proxmox05_288534_object2 is not correct!
read got -2
error during benchmark: (2) No such file or directory
error 2: (2) No such file or directory
root@proxmox05
 
I would say it is enough write testing for now...
:) roughly 60 Gb/s. You might be able the get a little more with tuning Ceph. Sadly io_uring is not a "stable" engine yet, that would help as well.

@Alwin : How did you run three rados bench seq read clients???
You need to use a unique --run-name on each bench. This will store the metadata object with that name.
 
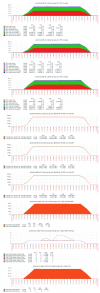
So here is something I do not understand:
Why is there less network traffic when doing sequential reads compared to the Ceph read bandwidth?

1602665527900.png

Had to take care of the RAM replacement scheduling during the tests. Unfortuntely all eight modules have to be replaced since support is not able to identify the broken one from these messages. It is always good to stress new hardware...
Code:
Message from syslogd@proxmox04 at Oct 14 00:56:34 ...
 kernel:[39849.540520] [Hardware Error]: Corrected error, no action required.
Message from syslogd@proxmox04 at Oct 14 00:56:34 ...
 kernel:[39849.541313] [Hardware Error]: CPU:3 (17:31:0) MC17_STATUS[Over|CE|MiscV|AddrV|-|-|SyndV|CECC|-|-|-]: 0xdc2040000000011b
Message from syslogd@proxmox04 at Oct 14 00:56:34 ...
 kernel:[39849.541939] [Hardware Error]: Error Addr: 0x0000000e13c41f40
Message from syslogd@proxmox04 at Oct 14 00:56:34 ...
 kernel:[39849.542552] [Hardware Error]: IPID: 0x0000009600650f00, Syndrome: 0x1b6de27d0a800503
Message from syslogd@proxmox04 at Oct 14 00:56:34 ...
 kernel:[39849.543204] [Hardware Error]: Unified Memory Controller Ext. Error Code: 0, DRAM ECC error.
Message from syslogd@proxmox04 at Oct 14 00:56:34 ...
 kernel:[39849.543820] [Hardware Error]: cache level: L3/GEN, tx: GEN, mem-tx: RD
 
  • Like
Reactions: Alwin

About

The Proxmox community has been around for many years and offers help and support for Proxmox VE, Proxmox Backup Server, and Proxmox Mail Gateway.
We think our community is one of the best thanks to people like you!

Get your subscription!

The Proxmox team works very hard to make sure you are running the best software and getting stable updates and security enhancements, as well as quick enterprise support. Tens of thousands of happy customers have a Proxmox subscription. Get yours easily in our online shop.

Buy now!