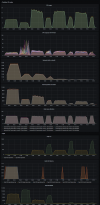
So I updated the Zabbix templates used for the Proxmox nodes and switched to Grafana to render additional graphs. We do have single CPU threads graphs and NVMe utilization percentage over all three nodes and items in one graph.
This is a benchmark run with 4 OSDs per NVMe.
Order is
- 4M blocksize write (10min)
- 4M blocksize read
- 64K blocksize write (10min)
- 64K blocksize read
- 8K blocksize write (10min)
- 8K blocksize read
- 4K blocksize write (10min)
- 4K blocksize read
All 8 tests are bound by the maximum performance of the NVMes (almost always 100% utilization). The "CPU usage per CPU thread" shows spikes of up to 80% during 4M blocksize reads.
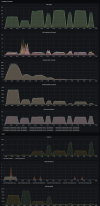
Here a benchmark run with 2 OSDs per NVMe:
Again the NVMe utilization rate is 100%. Here the 4M read causes 100% CPU spikes. But the throughput and IOps is almost as good as the 4 OSDs per NVMe result.
Clearly the NVMes are the limiting factor of our environment. We still do have 7 slots available - if we increase the number in the future by using 4 OSDs per NVMe the CPU might become the limiting factor. Therefore we decided to limit the CPU usage by using 2 OSDs per NVMe.