Benchmark: 3 node AMD EPYC 7742 64-Core, 512G RAM, 3x3 6,4TB Micron 9300 MAX NVMe

So I believe there is nothing left to change on the configuration that would further improve the performance.
One thing you could attempt, would be to use relaxed ordering. That needs to be set in the BIOS and on the Mellonx cards. Yet, on our system that didn't yield any benefit. But I assume that for one the CPU doesn't have enough cores per complex and that our 100 GbE cards are ConnectX-4.
https://hpcadvisorycouncil.atlassia...ing+Guide+for+InfiniBand+HPC#Relaxed-Ordering
 
Benchmark script drop for future reference:
Resides in /etc/pve and is started on all nodes using
bash /etc/pve/radosbench.sh
Code:
#!/bin/bash
LOGDIR=/root
exec >$LOGDIR/$(basename $0 .sh)-$(date +%F-%H_%M).log
exec 2>$LOGDIR/$(basename $0 .sh)-$(date +%F-%H_%M).err
BLOCKSIZES="4M 64K 8K 4K"
for BS in $BLOCKSIZES; do
    TEST="rados bench 600 --pool ceph-proxmox-VMs write --run-name $(hostname) -t 16 --no-cleanup -b $BS"
    echo ${TEST}
    eval ${TEST}
    sleep 120
    TEST="rados bench 600 --pool ceph-proxmox-VMs seq --run-name $(hostname) -t 16"
    echo ${TEST}
    eval ${TEST}
    sleep 120
done
 
Last edited:
@Alwin : I am rebuilding the three nodes again and again using ansible. On each new Deploy I reissue the license as I want to use the Enterprise Repository. After the reissue it takes some time to be able to activate the license in the systems again and it also takes some time until the Enterprise Repository allows to login again.
What are save times to wait here?

Yesterday the reissue took only a few seconds but Enterprise Repository access took about 5 minutes. Currently I am waiting for over 10 minutes for the reissue already...
 
@Alwin : I am rebuilding the three nodes again and again using ansible. On each new Deploy I reissue the license as I want to use the Enterprise Repository. After the reissue it takes some time to be able to activate the license in the systems again and it also takes some time until the Enterprise Repository allows to login again.
What are save times to wait here?
Well, just don't. :) Packages from the pve-no-subscription repository will mostly land in the pve-enterprise. It's the most widely used repository and if no issues arise the package gets pushed to pve-enterprise.

Yesterday the reissue took only a few seconds but Enterprise Repository access took about 5 minutes. Currently I am waiting for over 10 minutes for the reissue already...
At some point a reissue will not be possible and it has to be manually unlocked.
 
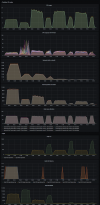
So I updated the Zabbix templates used for the Proxmox nodes and switched to Grafana to render additional graphs. We do have single CPU threads graphs and NVMe utilization percentage over all three nodes and items in one graph.

This is a benchmark run with 4 OSDs per NVMe.

Order is
  1. 4M blocksize write (10min)
  2. 4M blocksize read
  3. 64K blocksize write (10min)
  4. 64K blocksize read
  5. 8K blocksize write (10min)
  6. 8K blocksize read
  7. 4K blocksize write (10min)
  8. 4K blocksize read

1603394475711.png

All 8 tests are bound by the maximum performance of the NVMes (almost always 100% utilization). The "CPU usage per CPU thread" shows spikes of up to 80% during 4M blocksize reads.

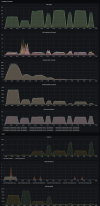
Here a benchmark run with 2 OSDs per NVMe:

1603394856191.png

Again the NVMe utilization rate is 100%. Here the 4M read causes 100% CPU spikes. But the throughput and IOps is almost as good as the 4 OSDs per NVMe result.

Clearly the NVMes are the limiting factor of our environment. We still do have 7 slots available - if we increase the number in the future by using 4 OSDs per NVMe the CPU might become the limiting factor. Therefore we decided to limit the CPU usage by using 2 OSDs per NVMe.
 
Did you use AMD Tuning Guide thats referenced in Proxmox forums post? Can u share concrete settings and details you have changed in your system (BIOS settings), OS-Settings etc. Thanks for your reply.
 
The ThomasKrenn RA1112 1HE pizza box uses an Asus KRPA-U16 motherboard which runs on an AMI BIOS.
The only settings I changed are:
- Pressed F5 for Optimized Defaults
- Disabled CSM support (we only use UEFI)

We wanted to benchmark to compare results and identify problems in the setup. We did not tune for maximum performance at the risk of decreased stablilty or increased power usage. So no overclocking or fixed speeds for memory chips or CPU frequencies.

We use cpupower to set the governor on the OS to performance though.
 
  • Like
Reactions: jsterr
It looks like the amount of OSDs per NVMe does not influence the results too much then?
I'm looking to run similar drives at 1 OSD per NVMe to save CPU power (64C/128T for 20-24 drives).
 
@Rainerle this looks like Grafana Dashboards for Proxmox Ceph HCI Nodes. Is there any possibility that u share the dashboards? Is this all data promoted via Metric-Server Integration via PVE? Thanks
 
@Rainerle this looks like Grafana Dashboards for Proxmox Ceph HCI Nodes. Is there any possibility that u share the dashboards? Is this all data promoted via Metric-Server Integration via PVE? Thanks
The data for these graphs is collected by Zabbix agents into a Zabbix DB. From there I used the Zabbix plugin in Grafana. Our decision to use Zabbix is 10 years old and we moved away from Nagios. As long as we are still able to monitor everything (really everything!) in Zabbix we do not even look at other solutions.
 
  • Like
Reactions: jsterr

About

The Proxmox community has been around for many years and offers help and support for Proxmox VE, Proxmox Backup Server, and Proxmox Mail Gateway.
We think our community is one of the best thanks to people like you!

Get your subscription!

The Proxmox team works very hard to make sure you are running the best software and getting stable updates and security enhancements, as well as quick enterprise support. Tens of thousands of happy customers have a Proxmox subscription. Get yours easily in our online shop.

Buy now!