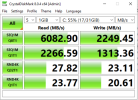
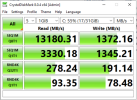
TEST_DIR=/rpool/data/testdir
# Test write throughput by performing sequential writes with multiple parallel streams (16+), using an I/O block size of 1 MB and an I/O depth of at least 64:
    root@compute:/rpool/data# fio --name=write_throughput --directory=/rpool/data/testdir --numjobs=16 \
    --size=10G --time_based --runtime=60s --ramp_time=2s --ioengine=libaio \
    --direct=1 --verify=0 --bs=1M --iodepth=64 --rw=write \
    --group_reporting=1 --iodepth_batch_submit=64 \
    --iodepth_batch_complete_max=64
    write_throughput: (g=0): rw=write, bs=(R) 1024KiB-1024KiB, (W) 1024KiB-1024KiB, (T) 1024KiB-1024KiB, ioengine=libaio, iodepth=64
    ...
    fio-3.25
    Starting 16 processes
    write_throughput: Laying out IO file (1 file / 10240MiB)
    write_throughput: Laying out IO file (1 file / 10240MiB)
    write_throughput: Laying out IO file (1 file / 10240MiB)
    write_throughput: Laying out IO file (1 file / 10240MiB)
    write_throughput: Laying out IO file (1 file / 10240MiB)
    write_throughput: Laying out IO file (1 file / 10240MiB)
    write_throughput: Laying out IO file (1 file / 10240MiB)
    write_throughput: Laying out IO file (1 file / 10240MiB)
    write_throughput: Laying out IO file (1 file / 10240MiB)
    write_throughput: Laying out IO file (1 file / 10240MiB)
    write_throughput: Laying out IO file (1 file / 10240MiB)
    write_throughput: Laying out IO file (1 file / 10240MiB)
    write_throughput: Laying out IO file (1 file / 10240MiB)
    write_throughput: Laying out IO file (1 file / 10240MiB)
    write_throughput: Laying out IO file (1 file / 10240MiB)
    write_throughput: Laying out IO file (1 file / 10240MiB)
    Jobs: 14 (f=13): [_(1),W(1),f(1),_(1),W(12)][34.6%][w=448MiB/s][w=447 IOPS][eta 02m:03s]
    write_throughput: (groupid=0, jobs=16): err= 0: pid=13006: Sat Dec 30 16:52:15 2023
    write: IOPS=445, BW=462MiB/s (484MB/s)(28.0GiB/62088msec); 0 zone resets
        slat (msec): min=973, max=2430, avg=2269.91, stdev=156.12
        clat (nsec): min=3160, max=17820, avg=9812.44, stdev=1311.93
        lat (msec): min=973, max=2430, avg=2287.45, stdev=121.16
        clat percentiles (nsec):
        |  1.00th=[ 5728],  5.00th=[ 8256], 10.00th=[ 8640], 20.00th=[ 9024],
        | 30.00th=[ 9280], 40.00th=[ 9536], 50.00th=[ 9792], 60.00th=[ 9920],
        | 70.00th=[10176], 80.00th=[10432], 90.00th=[10944], 95.00th=[11584],
        | 99.00th=[15936], 99.50th=[16512], 99.90th=[17792], 99.95th=[17792],
        | 99.99th=[17792]
    bw (  MiB/s): min= 1947, max= 2049, per=100.00%, avg=2044.61, stdev= 1.84, samples=432
    iops        : min= 1943, max= 2048, avg=2044.07, stdev= 1.88, samples=432
    lat (usec)   : 4=0.01%, 10=64.19%, 20=35.79%
    cpu          : usr=0.10%, sys=0.84%, ctx=222148, majf=1, minf=945
    IO depths    : 1=0.0%, 2=0.0%, 4=0.0%, 8=0.0%, 16=0.0%, 32=0.0%, >=64=100.0%
        submit    : 0=0.0%, 4=0.0%, 8=0.0%, 16=0.0%, 32=0.0%, 64=100.0%, >=64=0.0%
        complete  : 0=0.0%, 4=0.0%, 8=0.0%, 16=0.0%, 32=0.0%, 64=100.0%, >=64=0.0%
        issued rwts: total=0,27648,0,0 short=0,0,0,0 dropped=0,0,0,0
        latency   : target=0, window=0, percentile=100.00%, depth=64

    Run status group 0 (all jobs):
    WRITE: bw=462MiB/s (484MB/s), 462MiB/s-462MiB/s (484MB/s-484MB/s), io=28.0GiB (30.1GB), run=62088-62088msec


# Test write IOPS by performing random writes, using an I/O block size of 4 KB and an I/O depth of at least 256:
    root@compute:/rpool/data# fio --name=write_iops --directory=$TEST_DIR --size=10G \
    --time_based --runtime=60s --ramp_time=2s --ioengine=libaio --direct=1 \
    --verify=0 --bs=4K --iodepth=256 --rw=randwrite --group_reporting=1  \
    --iodepth_batch_submit=256  --iodepth_batch_complete_max=256
    write_iops: (g=0): rw=randwrite, bs=(R) 4096B-4096B, (W) 4096B-4096B, (T) 4096B-4096B, ioengine=libaio, iodepth=256
    fio-3.25
    Starting 1 process
    write_iops: Laying out IO file (1 file / 10240MiB)
    Jobs: 1 (f=1): [w(1)][100.0%][w=36.0MiB/s][w=9216 IOPS][eta 00m:00s]
    write_iops: (groupid=0, jobs=1): err= 0: pid=46778: Sat Dec 30 16:54:58 2023
    write: IOPS=15.9k, BW=61.0MiB/s (64.0MB/s)(3718MiB/60011msec); 0 zone resets
        slat (msec): min=7, max=168, avg=16.02, stdev= 8.15
        clat (nsec): min=5400, max=51751, avg=18021.34, stdev=3126.49
        lat (msec): min=7, max=168, avg=16.04, stdev= 8.15
        clat percentiles (nsec):
        |  1.00th=[14784],  5.00th=[15424], 10.00th=[15808], 20.00th=[16512],
        | 30.00th=[16768], 40.00th=[17024], 50.00th=[17280], 60.00th=[17536],
        | 70.00th=[18048], 80.00th=[18560], 90.00th=[20352], 95.00th=[25216],
        | 99.00th=[30336], 99.50th=[32640], 99.90th=[46336], 99.95th=[49408],
        | 99.99th=[51968]
    bw (  KiB/s): min=34816, max=116969, per=100.00%, avg=63448.62, stdev=22226.07, samples=120
    iops        : min= 8704, max=29242, avg=15862.11, stdev=5556.53, samples=120
    lat (usec)   : 10=0.37%, 20=88.72%, 50=10.88%, 100=0.03%
    cpu          : usr=1.14%, sys=58.07%, ctx=203468, majf=0, minf=58
    IO depths    : 1=0.0%, 2=0.0%, 4=0.0%, 8=0.0%, 16=0.0%, 32=0.0%, >=64=100.0%
        submit    : 0=0.0%, 4=0.0%, 8=0.0%, 16=0.0%, 32=0.0%, 64=0.0%, >=64=100.0%
        complete  : 0=0.0%, 4=0.0%, 8=0.0%, 16=0.0%, 32=0.0%, 64=0.0%, >=64=100.0%
        issued rwts: total=0,951552,0,0 short=0,0,0,0 dropped=0,0,0,0
        latency   : target=0, window=0, percentile=100.00%, depth=256

    Run status group 0 (all jobs):
    WRITE: bw=61.0MiB/s (64.0MB/s), 61.0MiB/s-61.0MiB/s (64.0MB/s-64.0MB/s), io=3718MiB (3899MB), run=60011-60011msec

# Test read throughput by performing sequential reads with multiple parallel streams (16+), using an I/O block size of 1 MB and an I/O depth of at least 64:
    root@compute:/rpool/data# fio --name=read_throughput --directory=$TEST_DIR --numjobs=16 \
    --size=10G --time_based --runtime=60s --ramp_time=2s --ioengine=libaio \
    --direct=1 --verify=0 --bs=1M --iodepth=64 --rw=read \
    --group_reporting=1 \
    --iodepth_batch_submit=64 --iodepth_batch_complete_max=64
    read_throughput: (g=0): rw=read, bs=(R) 1024KiB-1024KiB, (W) 1024KiB-1024KiB, (T) 1024KiB-1024KiB, ioengine=libaio, iodepth=64
    ...
    fio-3.25
    Starting 16 processes
    read_throughput: Laying out IO file (1 file / 10240MiB)
    read_throughput: Laying out IO file (1 file / 10240MiB)
    read_throughput: Laying out IO file (1 file / 10240MiB)
    read_throughput: Laying out IO file (1 file / 10240MiB)
    read_throughput: Laying out IO file (1 file / 10240MiB)
    read_throughput: Laying out IO file (1 file / 10240MiB)
    read_throughput: Laying out IO file (1 file / 10240MiB)
    read_throughput: Laying out IO file (1 file / 10240MiB)
    read_throughput: Laying out IO file (1 file / 10240MiB)
    read_throughput: Laying out IO file (1 file / 10240MiB)
    read_throughput: Laying out IO file (1 file / 10240MiB)
    read_throughput: Laying out IO file (1 file / 10240MiB)
    read_throughput: Laying out IO file (1 file / 10240MiB)
    read_throughput: Laying out IO file (1 file / 10240MiB)
    read_throughput: Laying out IO file (1 file / 10240MiB)
    read_throughput: Laying out IO file (1 file / 10240MiB)
    Jobs: 15 (f=13): [R(4),f(1),R(2),f(1),R(7),_(1)][51.6%][r=3937MiB/s][r=3936 IOPS][eta 01m:00s]
    read_throughput: (groupid=0, jobs=16): err= 0: pid=707921: Sat Dec 30 17:04:49 2023
    read: IOPS=5477, BW=5495MiB/s (5762MB/s)(328GiB/61151msec)
        slat (msec): min=9, max=2046, avg=188.24, stdev=394.41
        clat (usec): min=3, max=109, avg=12.78, stdev= 4.77
        lat (msec): min=9, max=1849, avg=184.87, stdev=389.53
        clat percentiles (usec):
        |  1.00th=[    8],  5.00th=[   10], 10.00th=[   10], 20.00th=[   11],
        | 30.00th=[   11], 40.00th=[   12], 50.00th=[   12], 60.00th=[   13],
        | 70.00th=[   14], 80.00th=[   15], 90.00th=[   17], 95.00th=[   20],
        | 99.00th=[   33], 99.50th=[   39], 99.90th=[   64], 99.95th=[   74],
        | 99.99th=[  111]
    bw (  MiB/s): min= 1884, max=12922, per=100.00%, avg=7079.36, stdev=336.74, samples=1032
    iops        : min= 1879, max=12919, avg=7078.50, stdev=336.73, samples=1032
    lat (usec)   : 4=0.01%, 10=16.76%, 20=78.78%, 50=4.24%, 100=0.19%
    lat (usec)   : 250=0.02%
    cpu          : usr=0.02%, sys=15.03%, ctx=40945, majf=0, minf=954
    IO depths    : 1=0.0%, 2=0.0%, 4=0.0%, 8=0.0%, 16=0.0%, 32=0.0%, >=64=100.0%
        submit    : 0=0.0%, 4=0.0%, 8=0.0%, 16=0.0%, 32=0.0%, 64=100.0%, >=64=0.0%
        complete  : 0=0.0%, 4=0.0%, 8=0.0%, 16=0.0%, 32=0.0%, 64=100.0%, >=64=0.0%
        issued rwts: total=334976,0,0,0 short=0,0,0,0 dropped=0,0,0,0
        latency   : target=0, window=0, percentile=100.00%, depth=64

    Run status group 0 (all jobs):
    READ: bw=5495MiB/s (5762MB/s), 5495MiB/s-5495MiB/s (5762MB/s-5762MB/s), io=328GiB (352GB), run=61151-61151msec

# Test read IOPS by performing random reads, using an I/O block size of 4 KB and an I/O depth of at least 256:
    root@compute:/rpool/data# fio --name=read_iops --directory=$TEST_DIR --size=10G \
    --time_based --runtime=60s --ramp_time=2s --ioengine=libaio --direct=1 \
    --verify=0 --bs=4K --iodepth=256 --rw=randread --group_reporting=1 \
    --iodepth_batch_submit=256  --iodepth_batch_complete_max=256
    read_iops: (g=0): rw=randread, bs=(R) 4096B-4096B, (W) 4096B-4096B, (T) 4096B-4096B, ioengine=libaio, iodepth=256
    fio-3.25
    Starting 1 process
    read_iops: Laying out IO file (1 file / 10240MiB)
    Jobs: 1 (f=1): [r(1)][100.0%][r=198MiB/s][r=50.7k IOPS][eta 00m:00s]
    read_iops: (groupid=0, jobs=1): err= 0: pid=799909: Sat Dec 30 17:07:09 2023
    read: IOPS=51.2k, BW=200MiB/s (210MB/s)(11.7GiB/60004msec)
        slat (usec): min=1013, max=6544, avg=4920.36, stdev=738.62
        clat (nsec): min=1310, max=83081, avg=15251.98, stdev=2096.12
        lat (usec): min=1019, max=6562, avg=4935.64, stdev=739.61
        clat percentiles (nsec):
        |  1.00th=[ 6816],  5.00th=[13504], 10.00th=[13888], 20.00th=[14144],
        | 30.00th=[14528], 40.00th=[14912], 50.00th=[15168], 60.00th=[15552],
        | 70.00th=[16064], 80.00th=[16512], 90.00th=[17024], 95.00th=[17280],
        | 99.00th=[18816], 99.50th=[20864], 99.90th=[32128], 99.95th=[33536],
        | 99.99th=[70144]
    bw (  KiB/s): min=180224, max=549963, per=100.00%, avg=205051.91, stdev=40550.88, samples=120
    iops        : min=45056, max=137490, avg=51262.87, stdev=10137.68, samples=120
    lat (usec)   : 2=0.01%, 4=0.01%, 10=1.92%, 20=97.49%, 50=0.55%
    lat (usec)   : 100=0.02%
    cpu          : usr=2.03%, sys=97.96%, ctx=100, majf=0, minf=58
    IO depths    : 1=0.0%, 2=0.0%, 4=0.0%, 8=0.0%, 16=0.0%, 32=0.0%, >=64=100.0%
        submit    : 0=0.0%, 4=0.0%, 8=0.0%, 16=0.0%, 32=0.0%, 64=0.0%, >=64=100.0%
        complete  : 0=0.0%, 4=0.0%, 8=0.0%, 16=0.0%, 32=0.0%, 64=0.0%, >=64=100.0%
        issued rwts: total=3074304,0,0,0 short=0,0,0,0 dropped=0,0,0,0
        latency   : target=0, window=0, percentile=100.00%, depth=256

    Run status group 0 (all jobs):
    READ: bw=200MiB/s (210MB/s), 200MiB/s-200MiB/s (210MB/s-210MB/s), io=11.7GiB (12.6GB), run=60004-60004msec


