Hi,
I tried to answer a question with a link explaining Proxmox disk usage displays in the Web GUI, but I did not find a posting explaining it (possibly because I searched wrongly), so I decided to write a brief overview. I try to explain simple, even if sometimes not 100% accurate.
Understanding ZFS usage values can be confusing, as ZFS as a lot of features to consider. Some common aspects are:
Let me explain on one example from one of my test nodes, which has a ~256 GB boot SSD plus ~ TB ZFS pool (single NVMe vdev). By this, we have no disk redundancy and things are a littler simpler.
My Web GUI shows on "summary":

which already can confuse a lot, as it seems to show a way too low HD size (it shows 68 GiB total, but here we have 1,256 GB, haven't we?).
But it is correct, because it does not show the total HD memory, but the size of the root file system, as as
I'm not sure how this helps, but of course never fill up datasets, it just invites all kind of trouble.
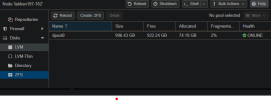
Usually more interesting is the space of the disks (or pools), which can also be found in the menu:

Let's go into detail.
So at first, there are 922 GB free; let's compare with information from the Shell:
OK, "df" here is simply not suited, because it only shows (mounted) datasets, but no volumes. But even the size is different (looks "wrong"). This is, because the mounted dataset size is limited by the other data in the pool. So we could assume having 996-728 ~ 268 GB of other data (like volumes).
So let's show the volumes, too, with zfs list command:
So we have volumes with 127 + 20 + 25 = 172 GB "used" size, but 24+44+48 = 116 GB "refer" size. Hum. Let me come back in a second, but first let's look closer to the space information:
OK, so we see that base actually consumes 24 GB, but reserved 103 GB, giving 127 GB total used size. Reserved here means, that this is a 100 GB volume, which currently has 24 GB "really" used (by a VM). However, (here) the total size is reserved, which means, this space cannot be assigned to other volumes (yes, it is possible: you can assign more in sum than totally available. For example, you can divide a 1 TB pool into 11 volumes with 100 GB each - as long as they do not actually really use all this space. This is called "overprovisioning". This can lead to trouble if then, unexpectedly, all VMs use all their space at the same time). So instead of just the "really used" 24 GB, ZFS here reserves the total 103 GB (Proxmox by default does not reserve, so you could accidentally overprovision).
So This means, we need 103 + 20 + 25 GB = 148 GB. Another new number. But the sum from the zfs list command is even a different one, 172 GB, I come back to in a second, but before I have to come back to the "refer" value.
Above we noticed, that the 507 and 508 disks use 20 and 24 GB, but have a REFER value of 44 GB and 48 GB. "REFER" means, how much data a volume references, that means, how much it can access. But how can that be different from what is "used"? Of course, it's because a ZFS feature: here its a "clone" from an "origin". Data, which is the same on the "clone" as on the "origin", is not stored twice (similar effect as dedup, but working entirely differently; dedup detects blocks as soon as they are written, but here ZFS just starts a clone with zero size and then storing changed data, quite similar to a snapshot; actually, it starts with a snapshot, which forms the base, the origin). If a VM writes such "inherited" data, ZFS needs to create a copy before updating it, and thus this also is called "copy on write".
Let's check the related sizes by letting ZFS show "snapshot" and "origin" information:
NB: Often I use
So we see that __base__ has 24 GB size, so 507 and 508 add 20 GB and 24 GB to that, giving the REFER values 44 and 48 GB we saw in the very first
Let me come back to the sum from the zfs list command, 172 GB. We calculated: 103 GB reserved + 20 GB + 25 GB = 148 GB, but now we see the snapshot. If all the referenced data on 401 would change, we would need to store all this 103 GB, plus the size of the old "before" data, the old size, which is 24 GB, because in worst case we need 103+24 GB and we asked ZFS to reserve this amount. So in total, this is 103 + 24 + 20 + 25 = 172 and we finally know that "zfs used" here actually means: the really used space, plus the reserved space that could be needed (and the latter even honours snapshots).
As a side note: the VMs do not see any of this; each of the 3 VMs sees a plain 103 GB disk image, and see approximately 24, 44 and 48 GB used (this cannot be concluded from ZFS data, as the VM may have data deleted "inside" its file system, but ZFS may not know this, for example, if TRIM / discard was not used inside the VM or is not even configured).
So what is actually stored on the disks, physically? The 103 GB are just reserved; here only 24 GB of Volume 401 are really stored. It has a snapshot, but since 401 never ever had been changed, the snapshot needs 0 GB storage. Volume 507 adds 20 GB, and 508 adds 24 GB, so we have 24+20+24 = 68 GB really physically stored in the pool (please note that I switched from "volumes" to "pool", the storage for the volumes), and ask ZFS:
We find our 68 GB (with a little rounding error as 69 GB) here, finally!
And this is what the Proxmox Web GUI shows us: the physically stored data. However, this does not mean that 859 GB more data can be stored, as for example we have reserved space (103 GB less we can use). Also, ZFS reserves some amount for "urgent data", like ~3% (~28 GB less we can use). so we in fact we could potentially fill only up 928 - 70 - 103 - 28 GB data, that are 727 GB.
And these 727 GB (what we could potentially fill) is what the very first command showed as "AVAIL" (and I hope this know makes sense).
We really came down a long way to these figures, but still this is a simple example. More complex would be:
NB: there also is
Also out of scope is "zpool iostat -v", which also shows sizes.
A simple benchmark is
but way better is
and the usual linux commands:
Steffen
I tried to answer a question with a link explaining Proxmox disk usage displays in the Web GUI, but I did not find a posting explaining it (possibly because I searched wrongly), so I decided to write a brief overview. I try to explain simple, even if sometimes not 100% accurate.
Understanding ZFS usage values can be confusing, as ZFS as a lot of features to consider. Some common aspects are:
- ZFS supports redundancy, for example MIRROR or RAIDZ3. For the redundancy, space is needed. If you, for example, mirror two 1 TB disks, of course you can use only 1 TB of the 2 TB physical memory. A RAIDZ3 tolerates failure of up to 3 disks, so on 4 x 1 TB you can still only use 1 TB, but on 13 x 1 TB , you use 10 TB (this is physical disk space, not what actually will be usable)
- "Padding overhead" can arise (I liked this writeup); also for example, RAIDZ3 is recommended to be used with 11 disks or more for less (in the details it is way more complex of course)
- Blocksizes (such as
ashiftvalues, and of course blocksizes inside the VM, and how they map) can affect storage sizes and performance significantly - Copies: Even inside a dataset or volume could be stored redundant (so-called "copies" feature, where the data is stored in several copies)
- ZFS supports snapshots. By them, you can access an old state of the data, and if data is changed, additional space is needed, because you can access both the old and the new data, so obviously both needs to be stored. Snapshots start with almost zero size (no changed data) and can grow up to the full size of what they were taken from. Similarily, there are "clones".
- ZFS supports compression, so stored data may theoretically use way less storage that file sizes may suggest
- ZFS support deduplication, so copied blocks of data may be stored just once. NB: this sounds as if you always would want it, but by default you probably don't; it has a price, mostly RAM usage, and it may surprise people how less its effect can be in real environments. However, in circumstances, like "clones of big VMs", it can be very effective, although then often other possibilities are available as well (thin cloning for example).
- ZFS may get very slow if too full (>90% or so, so limit to 80%)
- ZFS of course needs space for own data
- ZFS has a reserved amount of space (e.g. 3.2%)
- ZFS volumes may "reserve" their capacity (to avoid "out of disk space" errors in VMs writing image devices, i.e. "their local hard disk")
- RAM usage is an important topic not in scope here (try
arc_summarycommand to get an idea how complex it can be) - Many many parameters can be tuned
- There are Gigabytes (GB) and Gibibytes (GiB) and a "1000 GB" drive may have even less than 1000 GiB capacity (and from this, partition tables, data structures, EFI partitions, alignment and whatnot needs to be subtracted)
Let me explain on one example from one of my test nodes, which has a ~256 GB boot SSD plus ~ TB ZFS pool (single NVMe vdev). By this, we have no disk redundancy and things are a littler simpler.
My Web GUI shows on "summary":
which already can confuse a lot, as it seems to show a way too low HD size (it shows 68 GiB total, but here we have 1,256 GB, haven't we?).
But it is correct, because it does not show the total HD memory, but the size of the root file system, as as
df -h:
Code:
root@labhen197-102:~# df -h /
Filesystem            Size  Used Avail Use% Mounted on
/dev/mapper/pve-root   68G   11G   54G  17% /
I'm not sure how this helps, but of course never fill up datasets, it just invites all kind of trouble.
Usually more interesting is the space of the disks (or pools), which can also be found in the menu:
Let's go into detail.
So at first, there are 922 GB free; let's compare with information from the Shell:
Code:
root@labhen197-102:~# df -h /dpool0
Filesystem      Size  Used Avail Use% Mounted on
dpool0          728G  256K  728G   1% /dpool0
OK, "df" here is simply not suited, because it only shows (mounted) datasets, but no volumes. But even the size is different (looks "wrong"). This is, because the mounted dataset size is limited by the other data in the pool. So we could assume having 996-728 ~ 268 GB of other data (like volumes).
So let's show the volumes, too, with zfs list command:
Code:
root@labhen197-102:~# zfs list
NAME                     USED  AVAIL  REFER  MOUNTPOINT
dpool0                   172G   727G   192K  /dpool0
dpool0/base-401-disk-0   127G   830G  23.9G  -
dpool0/vm-507-disk-0    20.3G   727G  43.9G  -
dpool0/vm-508-disk-0    24.8G   727G  48.4G  -
So we have volumes with 127 + 20 + 25 = 172 GB "used" size, but 24+44+48 = 116 GB "refer" size. Hum. Let me come back in a second, but first let's look closer to the space information:
Code:
root@labhen197-102:~# zfs list -o space
NAME                    AVAIL   USED  USEDSNAP  USEDDS  USEDREFRESERV  USEDCHILD
dpool0                   727G   172G        0B    192K             0B       172G
dpool0/base-401-disk-0   830G   127G        0B   23.9G           103G         0B
dpool0/vm-507-disk-0     727G  20.3G        0B   20.3G             0B         0B
dpool0/vm-508-disk-0     727G  24.8G        0B   24.8G             0B         0B
OK, so we see that base actually consumes 24 GB, but reserved 103 GB, giving 127 GB total used size. Reserved here means, that this is a 100 GB volume, which currently has 24 GB "really" used (by a VM). However, (here) the total size is reserved, which means, this space cannot be assigned to other volumes (yes, it is possible: you can assign more in sum than totally available. For example, you can divide a 1 TB pool into 11 volumes with 100 GB each - as long as they do not actually really use all this space. This is called "overprovisioning". This can lead to trouble if then, unexpectedly, all VMs use all their space at the same time). So instead of just the "really used" 24 GB, ZFS here reserves the total 103 GB (Proxmox by default does not reserve, so you could accidentally overprovision).
So This means, we need 103 + 20 + 25 GB = 148 GB. Another new number. But the sum from the zfs list command is even a different one, 172 GB, I come back to in a second, but before I have to come back to the "refer" value.
Above we noticed, that the 507 and 508 disks use 20 and 24 GB, but have a REFER value of 44 GB and 48 GB. "REFER" means, how much data a volume references, that means, how much it can access. But how can that be different from what is "used"? Of course, it's because a ZFS feature: here its a "clone" from an "origin". Data, which is the same on the "clone" as on the "origin", is not stored twice (similar effect as dedup, but working entirely differently; dedup detects blocks as soon as they are written, but here ZFS just starts a clone with zero size and then storing changed data, quite similar to a snapshot; actually, it starts with a snapshot, which forms the base, the origin). If a VM writes such "inherited" data, ZFS needs to create a copy before updating it, and thus this also is called "copy on write".
Let's check the related sizes by letting ZFS show "snapshot" and "origin" information:
Code:
root@labhen197-102:~# zfs list -t snap
NAME                              USED  AVAIL  REFER  MOUNTPOINT
dpool0/base-401-disk-0@__base__     0B      -  23.9G  -
root@labhen197-102:~#

root@labhen197-102:~# zfs get all dpool0/vm-507-disk-0 | grep origin
dpool0/vm-507-disk-0  origin                dpool0/base-401-disk-0@__base__  -
root@labhen197-102:~# zfs get all dpool0/vm-508-disk-0 | grep origin
dpool0/vm-508-disk-0  origin                dpool0/base-401-disk-0@__base__  -
root@labhen197-102:~#zfs list -t snap straight in the beginning to see all types.So we see that __base__ has 24 GB size, so 507 and 508 add 20 GB and 24 GB to that, giving the REFER values 44 and 48 GB we saw in the very first
zfs list command.Let me come back to the sum from the zfs list command, 172 GB. We calculated: 103 GB reserved + 20 GB + 25 GB = 148 GB, but now we see the snapshot. If all the referenced data on 401 would change, we would need to store all this 103 GB, plus the size of the old "before" data, the old size, which is 24 GB, because in worst case we need 103+24 GB and we asked ZFS to reserve this amount. So in total, this is 103 + 24 + 20 + 25 = 172 and we finally know that "zfs used" here actually means: the really used space, plus the reserved space that could be needed (and the latter even honours snapshots).
As a side note: the VMs do not see any of this; each of the 3 VMs sees a plain 103 GB disk image, and see approximately 24, 44 and 48 GB used (this cannot be concluded from ZFS data, as the VM may have data deleted "inside" its file system, but ZFS may not know this, for example, if TRIM / discard was not used inside the VM or is not even configured).
So what is actually stored on the disks, physically? The 103 GB are just reserved; here only 24 GB of Volume 401 are really stored. It has a snapshot, but since 401 never ever had been changed, the snapshot needs 0 GB storage. Volume 507 adds 20 GB, and 508 adds 24 GB, so we have 24+20+24 = 68 GB really physically stored in the pool (please note that I switched from "volumes" to "pool", the storage for the volumes), and ask ZFS:
Code:
root@labhen197-102:~# zpool list -v
NAME                                                  SIZE  ALLOC   FREE  CKPOINT  EXPANDSZ   FRAG    CAP  DEDUP    HEALTH  ALTROOT
dpool0                                                928G  69.1G   859G        -         -     2%     7%  1.00x    ONLINE  -
  nvme-Samsung_SSD_970_EVO_Plus_1TB_S6P7NF0T409849K   932G  69.1G   859G        -         -     2%  7.44%      -    ONLINE
We find our 68 GB (with a little rounding error as 69 GB) here, finally!
And this is what the Proxmox Web GUI shows us: the physically stored data. However, this does not mean that 859 GB more data can be stored, as for example we have reserved space (103 GB less we can use). Also, ZFS reserves some amount for "urgent data", like ~3% (~28 GB less we can use). so we in fact we could potentially fill only up 928 - 70 - 103 - 28 GB data, that are 727 GB.
And these 727 GB (what we could potentially fill) is what the very first command showed as "AVAIL" (and I hope this know makes sense).
We really came down a long way to these figures, but still this is a simple example. More complex would be:
dpool0/vm-507-disk-0could have snapshotsdpool0/vm-507-disk-0could have snapshots that are referenced by other volume (a clone likedpool0/vm-507-disk-0_clonetotestsomething-- and of course, it can have snapshots and grandgrandgrandchild clones)- compression can affect sizes
- dedup can affect sizes
- data can have redundant "copies"
- quotas (dataset size limitations) may be in place
- there are even "incomplete" snapshots (while receiving snapshots from another ZFS pool, for example by zfs recv, the receiving data becomes a snapshot only after complete receipt, as
zfs recvis "atomic" (ìt either fully works or fully fails) - there are the usual "waste" caused by "blocksizes"
Code:
root@labhen197-102:~# zfs get copies
NAME                             PROPERTY  VALUE   SOURCE
dpool0                           copies    1       default
dpool0/base-401-disk-0           copies    1       default
dpool0/base-401-disk-0@__base__  copies    -       -
dpool0/vm-507-disk-0             copies    1       default
dpool0/vm-508-disk-0             copies    1       default
Code:
root@labhen197-102:~# zfs get copies,compressratio
NAME                             PROPERTY          VALUE     SOURCE
dpool0                           compressratio     1.00x     -
dpool0                           refcompressratio  1.00x     -
dpool0/base-401-disk-0           compressratio     1.01x     -
dpool0/base-401-disk-0           refcompressratio  1.01x     -
dpool0/base-401-disk-0@__base__  compressratio     1.01x     -
dpool0/base-401-disk-0@__base__  refcompressratio  1.01x     -
dpool0/vm-507-disk-0             compressratio     1.00x     -
dpool0/vm-507-disk-0             refcompressratio  1.00x     -
dpool0/vm-508-disk-0             compressratio     1.00x     -
dpool0/vm-508-disk-0             refcompressratio  1.00x     -
NB: there also is
refcompressratio.
Code:
root@labhen197-102:~# zpool status -DstvL
  pool: dpool0
 state: ONLINE
status: Some supported and requested features are not enabled on the pool.
        The pool can still be used, but some features are unavailable.
action: Enable all features using 'zpool upgrade'. Once this is done,
        the pool may no longer be accessible by software that does not support
        the features. See zpool-features(7) for details.
  scan: scrub repaired 0B in 00:00:59 with 0 errors on Sun Mar  9 00:25:00 2025
config:

        NAME        STATE     READ WRITE CKSUM  SLOW
        dpool0      ONLINE       0     0     0     -
          nvme0n1   ONLINE       0     0     0     0  (100% trimmed, completed at Sun Mar  2 00:24:13 2025)

errors: No known data errors

 dedup: no DDT entries
Also out of scope is "zpool iostat -v", which also shows sizes.
Code:
root@labhen197-102:~# zdb -bDDD dpool0
loading concrete vdev 0, metaslab 115 of 116 ...
65.7G completed (9843MB/s) estimated time remaining: 0hr 00min 00sec        All DDTs are empty

Traversing all blocks to verify nothing leaked ...


        No leaks (block sum matches space maps exactly)

        bp count:               8994576
        ganged count:                 0
        bp logical:         75064281600      avg:   8345
        bp physical:        73663378432      avg:   8189     compression:   1.02
        bp allocated:       74187890688      avg:   8248     compression:   1.01
        bp deduped:                   0    ref>1:      0   deduplication:   1.00
        bp cloned:                    0    count:      0
        Normal class:       74187759616     used:  7.51%
        Embedded log class           8192     used:  0.00%

        additional, non-pointer bps of type 0:      51673
        Dittoed blocks on same vdev: 11391
A simple benchmark is
hdpam:
Code:
root@labhen197-102:~# hdparm  -Tt /dev/zvol/dpool0/base-401-disk-0

/dev/zvol/dpool0/base-401-disk-0:
 Timing cached reads:   44380 MB in  1.99 seconds = 22249.27 MB/sec
 Timing buffered disk reads: 4094 MB in  3.00 seconds = 1364.41 MB/sec
but way better is
fio to see the IOPs, but don't accidentally overwrite your disks (so no example here).and the usual linux commands:
- lsblk
- df
- du (I like
du -hx -d 2 / | sort -h) - fdisk (
fdisk -l), gfisk, sfdisk (sfdisk -l), parted, growpart - dmesg
- smartctl (
smartctl -i /dev/nvme1) - free, top, iotop
Steffen
Attachments
Last edited:
