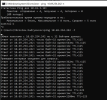
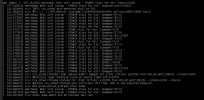
Thanks a lot for the data. According to your
numastat output, roughly 1/3 of the ~128GiB of QEMU process memory are assigned to NUMA node 0 and 2/3 to node 1. In my previous unsuccessful attempts to reproduce the freezes on real NUMA hardware, this was more of a 50:50 split. So I forced a 1/3 vs 2/3 split by allocating memory on NUMA node 0 (using numactl --preferred and stress-ng) before starting the Windows VM, waited until KSM kicked in (until "KSM sharing" showed ~25GiB), and after starting a couple of RDP sessions, I occasionally saw some ping response times of 2-5 seconds. I'll try to look into this further and post updates here.Currently I doubt that mitigations play a huge role (KSM and NUMA balancing seem to be the bigger factors), so I don't think it would pay off to rerun the tests with mitigations enabled if this would disrupt your production traffic.P.S. will try to rerun the latest tests with mitigations enabled (but it's gonna be very painful if it gets worse)


