[SOLVED] One Debian Guest VM extremely slow on Proxmox VE 9 - all other seem fine on the same Host

silverstone

Well-Known Member
Apr 28, 2018
164
20
58
36
I am having a Problem with one Debian Guest VM (running Debian 12 Bookworm AMD64, currently running the Upgrade to Debian 13 Trixie AMD64).
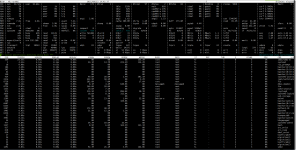
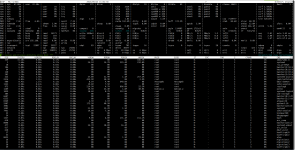
It's extremely sluggish, even to just run apt update.
While compiling Kernel Modules (e.g. zfs via dkms) I can see that the CPU Usage never gets above 15% or so which is weird.

All other VMs on the same Host seem to behave just fine.

At first I thought that maybe it was due to the fact that it was the only VM on that Server that was of q35 Type (all other were i440fx), but even after Switching to i440fx and removing the PCIe Device Passthrough (I was passing a LSI 9211-8i HBA through) the slowness didn't go away :( . I briefly also tried to set the VM Version to 9.0 or even the CPU Type from host to Haswell-NoTSX but Things didn't improve much if at all).

Host: Supermicro X10SLM+-F, Intel Xeon E3-1265L, 32GB RAM, Debian Trixie / Proxmox VE 9

Output of pveversion:
Code:
root@HOST:~# pveversion --verbose
proxmox-ve: 9.0.0 (running kernel: 6.8.12-15-pve)
pve-manager: 9.0.10 (running version: 9.0.10/deb1ca707ec72a89)
proxmox-kernel-helper: 9.0.4
proxmox-kernel-6.14.11-2-pve-signed: 6.14.11-2
proxmox-kernel-6.14: 6.14.11-2
proxmox-kernel-6.8: 6.8.12-15
proxmox-kernel-6.8.12-15-pve-signed: 6.8.12-15
pve-kernel-5.15.158-2-pve: 5.15.158-2
ceph-fuse: 19.2.3-pve1
corosync: 3.1.9-pve2
criu: 4.1.1-1
frr-pythontools: 10.3.1-1+pve4
ifupdown: residual config
ifupdown2: 3.3.0-1+pmx10
intel-microcode: 3.20250512.1
libjs-extjs: 7.0.0-5
libproxmox-acme-perl: 1.7.0
libproxmox-backup-qemu0: 2.0.1
libproxmox-rs-perl: 0.4.1
libpve-access-control: 9.0.3
libpve-apiclient-perl: 3.4.0
libpve-cluster-api-perl: 9.0.6
libpve-cluster-perl: 9.0.6
libpve-common-perl: 9.0.10
libpve-guest-common-perl: 6.0.2
libpve-http-server-perl: 6.0.4
libpve-network-perl: 1.1.8
libpve-rs-perl: 0.10.10
libpve-storage-perl: 9.0.13
libspice-server1: 0.15.2-1+b1
lvm2: 2.03.31-2+pmx1
lxc-pve: 6.0.5-1
lxcfs: 6.0.4-pve1
novnc-pve: 1.6.0-3
proxmox-backup-client: 4.0.15-1
proxmox-backup-file-restore: 4.0.15-1
proxmox-backup-restore-image: 1.0.0
proxmox-firewall: 1.1.2
proxmox-kernel-helper: 9.0.4
proxmox-mail-forward: 1.0.2
proxmox-mini-journalreader: 1.6
proxmox-offline-mirror-helper: 0.7.2
proxmox-widget-toolkit: 5.0.5
pve-cluster: 9.0.6
pve-container: 6.0.13
pve-docs: 9.0.8
pve-edk2-firmware: not correctly installed
pve-esxi-import-tools: 1.0.1
pve-firewall: 6.0.3
pve-firmware: 3.16-4
pve-ha-manager: 5.0.4
pve-i18n: 3.6.0
pve-qemu-kvm: 10.0.2-4
pve-xtermjs: 5.5.0-2
qemu-server: 9.0.22
smartmontools: 7.4-pve1
spiceterm: 3.4.1
swtpm: 0.8.0+pve2
vncterm: 1.9.1
zfsutils-linux: 2.3.4-pve1

Guest: Debian 12 AMD64 (currently upgrading to Debian 13 AMD64)

Any Idea what might cause such poor Performance but only affecting one VM ? Tips to troubleshoot ?
 
it would probably help if you'd include more relevant details
- VM config of the slow one and a fast one
- storage setup
- any relevant logs
- an actual benchmark (CPU, disk, ..) showing the performance difference
 
it would probably help if you'd include more relevant details
- VM config of the slow one and a fast one
- storage setup
- any relevant logs
- an actual benchmark (CPU, disk, ..) showing the performance difference

Thank you @fabian for your quick Reply.

Storage Setup:
Code:
root@pve99:~# zpool status
  pool: rpool
 state: ONLINE
status: Some supported and requested features are not enabled on the pool.
    The pool can still be used, but some features are unavailable.
action: Enable all features using 'zpool upgrade'. Once this is done,
    the pool may no longer be accessible by software that does not support
    the features. See zpool-features(7) for details.
  scan: scrub repaired 0B in 00:12:45 with 0 errors on Sun Jun 13 00:36:46 2021
config:

    NAME                                       STATE     READ WRITE CKSUM
    rpool                                      ONLINE       0     0     0
      mirror-0                                 ONLINE       0     0     0
        ata-CT500MX500SSD1_1828E148572E-part2  ONLINE       0     0     0
        ata-CT500MX500SSD1_1835E14E8C7E-part2  ONLINE       0     0     0

errors: No known data errors
root@pve99:~# zfs list
NAME                                                       USED  AVAIL  REFER  MOUNTPOINT
rpool                                                      218G   231G    96K  /
rpool/ROOT                                                43.2G   231G    96K  none
rpool/ROOT/debian                                         43.2G   231G  36.6G  /
rpool/data                                                 175G   231G    96K  none
rpool/data/vm-151-disk-0                                  17.5G   231G  17.5G  -
rpool/data/vm-151-disk-1                                  27.3G   231G  19.4G  -
rpool/data/vm-152-disk-0                                  13.4G   231G  7.31G  -
rpool/data/vm-152-state-Upgrade_Debian_Bullseye_20220323   243M   231G   243M  -
rpool/data/vm-153-disk-0                                  21.1G   231G  15.8G  -
rpool/data/vm-153-disk-1                                  18.4G   231G  18.4G  -
rpool/data/vm-153-state-Debian_Upgrade_Bullseye_20220323   507M   231G   507M  -
rpool/data/vm-154-disk-1                                  23.7G   231G  21.6G  -
rpool/data/vm-154-state-Update_Debian_Bullseye_20220123    788M   231G   788M  -
rpool/data/vm-155-disk-0                                  17.7G   231G  17.7G  -
rpool/data/vm-156-disk-0                                  14.2G   231G  6.75G  -
rpool/data/vm-156-state-Upgrade_Debian_Bullseye_20220123   250M   231G   250M  -
rpool/data/vm-902-disk-0                                  19.6G   231G  11.6G  -

Please do NOT blame it on the consumer SSDs. I had no trouble updating the other VMs on the same host at reasonable speed, even though of course I couldn't do all of them at once, since that would tank the Performance completely. Nevertheless most VMs updated in like 15 Minutes or less.

The slow one is probably going to take several HOURS.

Slow VM (151):
Code:
root@HOST:~# cat /etc/pve/qemu-server/151.conf
boot: order=scsi0
cores: 4
cpu: Haswell-noTSX
hostpci0: 0000:06:00,pcie=1,rombar=0
machine: q35
memory: 8192
name: MirrorNAS
net0: virtio=EA:F3:3D:D0:B3:84,bridge=vmbr0
net1: virtio=7E:90:41:BB:B1:FC,bridge=vmbr0
numa: 1
onboot: 1
ostype: l26
parent: Debian_Trixie_Upgrade_20250922
scsi0: local-zfs:vm-151-disk-1,discard=on,iothread=1,size=32G,ssd=1
scsi1: local-zfs:vm-151-disk-0,discard=on,iothread=1,size=32G,ssd=1
scsihw: virtio-scsi-pci
smbios1: uuid=384b09a7-5843-4dbb-9630-94c5db8f7f0e
sockets: 1

(keep in Mind CPU Type was host previously, although even that was slow)

Normal VM (156):
Code:
root@HOST:~# cat /etc/pve/qemu-server/156.conf
bootdisk: scsi0
cores: 2
cpu: host
ide2: none,media=cdrom
memory: 2048
name: AptCacherNG
net0: virtio=D2:ED:03:86:1D:8B,bridge=vmbr0
numa: 1
onboot: 1
ostype: l26
parent: Debian_Trixie_Upgrade_20250922
scsi0: local-zfs:vm-156-disk-0,size=10G,ssd=1
scsihw: virtio-scsi-pci
smbios1: uuid=f1a506db-e8f0-45f8-b786-2255d0cbf60d
sockets: 1
vmgenid: ffcc4f16-dfb1-4036-bf94-29d14fbf20f7

I'll using this benchmarking Script (put together from some Benchmarking I did to test Write Amplification a while back at https://github.com/luckylinux/proxmox-tools/blob/main/functions.sh) once the Slow VM will have finished installing fio (so that we avoid getting "skewed" Results):
Code:
#!/bin/bash

# Define Parameters
BENCHMARK_VM_FIO_RANDOM_BLOCK_SIZE=()
BENCHMARK_VM_FIO_RANDOM_BLOCK_SIZE+=("512")
BENCHMARK_VM_FIO_RANDOM_BLOCK_SIZE+=("1K")
BENCHMARK_VM_FIO_RANDOM_BLOCK_SIZE+=("2K")
BENCHMARK_VM_FIO_RANDOM_BLOCK_SIZE+=("4K")
BENCHMARK_VM_FIO_RANDOM_BLOCK_SIZE+=("8K")
BENCHMARK_VM_FIO_RANDOM_BLOCK_SIZE+=("16K")
BENCHMARK_VM_FIO_RANDOM_BLOCK_SIZE+=("32K")
BENCHMARK_VM_FIO_RANDOM_BLOCK_SIZE+=("64K")

BENCHMARK_VM_FIO_RANDOM_QUEUE_DEPTH=()
BENCHMARK_VM_FIO_RANDOM_QUEUE_DEPTH+=("1")
BENCHMARK_VM_FIO_RANDOM_QUEUE_DEPTH+=("8")
BENCHMARK_VM_FIO_RANDOM_QUEUE_DEPTH+=("32")

BENCHMARK_VM_FIO_THROUGHPUT_BLOCK_SIZE=()
BENCHMARK_VM_FIO_THROUGHPUT_BLOCK_SIZE+=("1M")

BENCHMARK_VM_FIO_THROUGHPUT_QUEUE_DEPTH=()
BENCHMARK_VM_FIO_THROUGHPUT_QUEUE_DEPTH+=("32")

BENCHMARK_VM_FIO_SIZE="1G"

# Define global Constants
BYTES_PER_KB=1024
BYTES_PER_MB=1048576
BYTES_PER_GB=1073741824
BYTES_PER_TB=1099511627776

# Define SLEEP_TIME (in Seconds) to ensure that every Test is hopefully going to start from a "fresh State" with the SSD Cache/DRAM fully available
SLEEP_TIME=150

# Define BENCHMARK_FOLDER
BENCHMARK_FOLDER="/usr/src/fio-benchmark/"

# Clear existing Files
rm -rf "${BENCHMARK_FOLDER}"

# Create Folder
mkdir -p "${BENCHMARK_FOLDER}"

# Force Write
sync

# Echo
echo "Sleeping for ${SLEEP_TIME} Seconds before starting Benchmark"

# Wait a bit before starting benchmark
sleep ${SLEEP_TIME}

# Get Raw Number in Bytes
get_bytes_number() {
    # Input Arguments
    local lformattedsize="$1"

    # Define Local Variables
    local lresult
    local lvalue

    # Strip the Unit
    lvalue=$(echo "${lformattedsize:0:-1}")

    if [[ "${lformattedsize: -1}" == "K" ]]
    then
        # Convert Kilobytes to Bytes
        lresult=$(convert_kilobytes_to_bytes "${lvalue}")
    elif [[ "${lformattedsize: -1}" == "M" ]]
    then
        # Convert Megabytes to Bytes
        lresult=$(convert_megabytes_to_bytes "${lvalue}")
    elif [[ "${lformattedsize: -1}" == "G" ]]
    then
        # Convert Gigabytes to Bytes
        lresult=$(convert_gigabytes_to_bytes "${lvalue}")
    elif [[ "${lformattedsize: -1}" == "T" ]]
    then
        # Convert Terabytes to Bytes
        lresult=$(convert_terabytes_to_bytes "${lvalue}")
    else
        # Just use the Value as Bytes
        lresult="${lformattedsize}"
    fi

    # Return Value
    echo "${lresult}"
}

# Math Calculation
math_calculation() {
    # Input Arguments
    local lmathexpression="$1"

    # Compute Result
    local lbcresult
    lbcresult=$(echo "scale=3; ${lmathexpression}" | bc)

    # Strip Thousands Separator
    local lresult
    lresult=$(echo "${lbcresult}" | sed -E "s|,||g")

    # Return Value
    echo "${lresult}"
}

# Convert Kilobytes to Bytes
convert_kilobytes_to_bytes() {
   # Input Arguments
   local lkilobytes="$1"

   # Convert kilobytes -> bytes
   local lbytes
   lbytes=$(math_calculation "${lkilobytes} * ${BYTES_PER_KB}")

   # Return Value
   echo "${lbytes}"
}

# Convert Megabytes to Bytes
convert_megabytes_to_bytes() {
   # Input Arguments
   local lmegabytes="$1"

   # Convert gigabytes -> bytes
   local lbytes
   lbytes=$(math_calculation "${lmegabytes} * ${BYTES_PER_MB}")

   # Return Value
   echo "${lbytes}"
}

# Convert Gigabytes to Bytes
convert_gigabytes_to_bytes() {
   # Input Arguments
   local lgigabytes="$1"

   # Convert gigabytes -> bytes
   local lbytes
   lbytes=$(math_calculation "${lgigabytes} * ${BYTES_PER_GB}")

   # Return Value
   echo "${lbytes}"
}

# Convert Terabytes to Bytes
convert_terabytes_to_bytes() {
   # Input Arguments
   local lterabytes="$1"

   # Convert terabytes -> bytes
   local lbytes
   lbytes=$(math_calculation "${lterabytes} * ${BYTES_PER_TB}")

   # Return Value
   echo "${lbytes}"
}

# Convert Bytes to Gigabytes
convert_bytes_to_gigabytes() {
   # Input Arguments
   local lbytes="$1"

   # Convert bytes -> gigabytes
   local lgigabytes
   lgigabytes=$(math_calculation "${lbytes} / ${BYTES_PER_GB}")

   # Return Value
   # echo "${lgigabytes}" | sed ':a;s/\B[0-9]\{3\}\>/,&/;ta'

   # Return Value
   echo "${lgigabytes}"
}

# End Iteration
end_iteration() {
   # Echo
   echo "Removing Test Files"

   # Cleanup Files
   rm -rf "${BENCHMARK_FOLDER}"
   mkdir -p "${BENCHMARK_FOLDER}"
   
   # Force sync
   sync
   
   # Echo
   echo "Sleeping for ${SLEEP_TIME} Seconds"
   
   # Sleep
   sleep ${SLEEP_TIME}
}

# Perform Random IO Testing
for random_block_size in "${BENCHMARK_VM_FIO_RANDOM_BLOCK_SIZE[@]}"
do
    for random_queue_depth in "${BENCHMARK_VM_FIO_RANDOM_QUEUE_DEPTH[@]}"
    do
        # Calculate Sizes and Number of small Files
        lrawsize=$(get_bytes_number "${BENCHMARK_VM_FIO_SIZE}")
        lrawblocksize=$(get_bytes_number "${random_block_size}")
        
        lnumfiles=$(math_calculation "${lrawsize} / ${lrawblocksize}")
        lnumfiles=$(echo "${lnumfiles}" | awk '{print int($1)}')
    
        # Echo
        echo "FIO RANDOM IO Benchmark for Block Size = ${random_block_size} and Queue Depth = ${random_queue_depth}"
        echo "RAW Size = ${lrawsize} / RAW Block Size = ${lrawblocksize} requires ${lnumfiles} Number of small Files"

        echo "Writing one BIG File for Block Size = ${random_block_size} and Queue Depth = ${random_queue_depth}:"
        echo "=============================================================================================="

        # Write one BIG File
        sudo fio --name=write_iops --directory="${BENCHMARK_FOLDER}" --size="${BENCHMARK_VM_FIO_SIZE}" --runtime=600s --ramp_time=2s --ioengine=libaio --direct=1 --verify=0 --bs="${random_block_size}" --iodepth="${random_queue_depth}" --rw=randwrite --group_reporting=1

        echo "=============================================================================================="

        end_iteration

        echo "Writing lots of SMALL Files for Block Size = ${random_block_size} and Queue Depth = ${random_queue_depth}:"
        echo "=============================================================================================="

        # Write lots of SMALL Files
        sudo fio --name=write_iops --directory="${BENCHMARK_FOLDER}" --size="${BENCHMARK_VM_FIO_SIZE}" --openfiles=512 --nrfiles="${lnumfiles}" --cpus_allowed=0 --runtime=600s --ramp_time=2s --ioengine=libaio --direct=1 --buffered=0 --verify=0 --bs="${random_block_size}" --iodepth="${random_queue_depth}" --rw=randwrite --group_reporting=1

        echo "=============================================================================================="
        
        end_iteration
    done

done

# Perform Throughput IO Testing
for throughput_block_size in "${BENCHMARK_VM_FIO_THROUGHPUT_BLOCK_SIZE[@]}"
do
    for throughput_queue_depth in "${BENCHMARK_VM_FIO_THROUGHPUT_QUEUE_DEPTH[@]}"
    do
        # Echo
        echo "FIO THROUGHPUT IO Benchmark for Block Size = ${random_block_size} and Queue Depth = ${random_queue_depth}"
        echo "=============================================================================================="

        sudo fio --name=write_throughput --directory="${BENCHMARK_FOLDER}" --numjobs=1 --size="${BENCHMARK_VM_FIO_SIZE}" --cpus_allowed=0 --runtime=600s --ramp_time=2s --ioengine=libaio --direct=1 --buffered=0 --verify=0 --bs="${throughput_block_size}" --iodepth="${throughput_queue_depth}" --rw=write --group_reporting=1

        echo "=============================================================================================="
        
        end_iteration
    done
done

Logs attached but I don't see anything too flashy :( .

EDIT 1: to be honest though, I feel it's more of a CPU Issue than a Storage Issue.

EDIT 2: also attached a Screenshot of the HOST iowait / IO Pressure.

EDIT 3: updated Script

EDIT 4: updated Script again, added some sleep Instructions & cleanup of Temporary Files to prevent Virtual Disk to filling up
 

Attachments

Last edited:
does look more like an IO issue to be honest.. how is your ZFS configured? could you post "zpool status", "zpool iostat 10" and "zfs get all ..." (the last one for each zvol used by the two VMs you posted)?
 
does look more like an IO issue to be honest.. how is your ZFS configured? could you post "zpool status", "zpool iostat 10" and "zfs get all ..." (the last one for each zvol used by the two VMs you posted)?
If it's an IO Issue, I'm curious as to why it only affects one VM. My initial Theory was q35 vs i440fx but that proved to not be the Case unfortunately :( .

These are old VMs and therefore still using 8k for volblocksize (both of them).

IIRC only one ZVOL is used (for MirrorNAS the other one is Gentoo from a very old Installation).

I already posted zpool status above, but here it is again:
Code:
root@HOST:/# zpool status
  pool: rpool
 state: ONLINE
status: Some supported and requested features are not enabled on the pool.
    The pool can still be used, but some features are unavailable.
action: Enable all features using 'zpool upgrade'. Once this is done,
    the pool may no longer be accessible by software that does not support
    the features. See zpool-features(7) for details.
  scan: scrub repaired 0B in 00:12:45 with 0 errors on Sun Jun 13 00:36:46 2021
config:

    NAME                                       STATE     READ WRITE CKSUM
    rpool                                      ONLINE       0     0     0
      mirror-0                                 ONLINE       0     0     0
        ata-CT500MX500SSD1_1828E148572E-part2  ONLINE       0     0     0
        ata-CT500MX500SSD1_1835E14E8C7E-part2  ONLINE       0     0     0

errors: No known data errors


A bit in the middle of Benchmarking Random Writes using fio on the FAST VM right now (the slow VM I have to rescue since I interrupted an initramfs Generation and that broke everything).

See attached File.


Slow VM (151 - mirrornas):
Code:
root@HOST:/# zfs get all rpool/data/vm-151-disk-0
NAME                      PROPERTY              VALUE                     SOURCE
rpool/data/vm-151-disk-0  type                  volume                    -
rpool/data/vm-151-disk-0  creation              Sun Mar  3 16:50 2019     -
rpool/data/vm-151-disk-0  used                  17.5G                     -
rpool/data/vm-151-disk-0  available             221G                      -
rpool/data/vm-151-disk-0  referenced            17.5G                     -
rpool/data/vm-151-disk-0  compressratio         1.54x                     -
rpool/data/vm-151-disk-0  reservation           none                      default
rpool/data/vm-151-disk-0  volsize               32G                       local
rpool/data/vm-151-disk-0  volblocksize          8K                        -
rpool/data/vm-151-disk-0  checksum              on                        default
rpool/data/vm-151-disk-0  compression           lz4                       inherited from rpool
rpool/data/vm-151-disk-0  readonly              off                       default
rpool/data/vm-151-disk-0  createtxg             155367                    -
rpool/data/vm-151-disk-0  copies                1                         default
rpool/data/vm-151-disk-0  refreservation        none                      default
rpool/data/vm-151-disk-0  guid                  3730937721288980850       -
rpool/data/vm-151-disk-0  primarycache          all                       default
rpool/data/vm-151-disk-0  secondarycache        all                       default
rpool/data/vm-151-disk-0  usedbysnapshots       32K                       -
rpool/data/vm-151-disk-0  usedbydataset         17.5G                     -
rpool/data/vm-151-disk-0  usedbychildren        0B                        -
rpool/data/vm-151-disk-0  usedbyrefreservation  0B                        -
rpool/data/vm-151-disk-0  logbias               latency                   default
rpool/data/vm-151-disk-0  objsetid              265                       -
rpool/data/vm-151-disk-0  dedup                 off                       default
rpool/data/vm-151-disk-0  mlslabel              none                      default
rpool/data/vm-151-disk-0  sync                  standard                  default
rpool/data/vm-151-disk-0  refcompressratio      1.54x                     -
rpool/data/vm-151-disk-0  written               8K                        -
rpool/data/vm-151-disk-0  logicalused           26.8G                     -
rpool/data/vm-151-disk-0  logicalreferenced     26.8G                     -
rpool/data/vm-151-disk-0  volmode               default                   default
rpool/data/vm-151-disk-0  snapshot_limit        none                      default
rpool/data/vm-151-disk-0  snapshot_count        none                      default
rpool/data/vm-151-disk-0  snapdev               hidden                    default
rpool/data/vm-151-disk-0  context               none                      default
rpool/data/vm-151-disk-0  fscontext             none                      default
rpool/data/vm-151-disk-0  defcontext            none                      default
rpool/data/vm-151-disk-0  rootcontext           none                      default
rpool/data/vm-151-disk-0  redundant_metadata    all                       default
rpool/data/vm-151-disk-0  encryption            off                       default
rpool/data/vm-151-disk-0  keylocation           none                      default
rpool/data/vm-151-disk-0  keyformat             none                      default
rpool/data/vm-151-disk-0  pbkdf2iters           0                         default
rpool/data/vm-151-disk-0  snapshots_changed     Mon Sep 22 22:17:21 2025  -
rpool/data/vm-151-disk-0  prefetch              all                       default
root@HOST:/# zfs get all rpool/data/vm-151-disk-1
NAME                      PROPERTY              VALUE                     SOURCE
rpool/data/vm-151-disk-1  type                  volume                    -
rpool/data/vm-151-disk-1  creation              Wed Mar 23 19:08 2022     -
rpool/data/vm-151-disk-1  used                  27.9G                     -
rpool/data/vm-151-disk-1  available             221G                      -
rpool/data/vm-151-disk-1  referenced            19.4G                     -
rpool/data/vm-151-disk-1  compressratio         1.53x                     -
rpool/data/vm-151-disk-1  reservation           none                      default
rpool/data/vm-151-disk-1  volsize               32G                       local
rpool/data/vm-151-disk-1  volblocksize          8K                        -
rpool/data/vm-151-disk-1  checksum              on                        default
rpool/data/vm-151-disk-1  compression           lz4                       inherited from rpool
rpool/data/vm-151-disk-1  readonly              off                       default
rpool/data/vm-151-disk-1  createtxg             13029236                  -
rpool/data/vm-151-disk-1  copies                1                         default
rpool/data/vm-151-disk-1  refreservation        none                      default
rpool/data/vm-151-disk-1  guid                  16990363424492727867      -
rpool/data/vm-151-disk-1  primarycache          all                       default
rpool/data/vm-151-disk-1  secondarycache        all                       default
rpool/data/vm-151-disk-1  usedbysnapshots       8.49G                     -
rpool/data/vm-151-disk-1  usedbydataset         19.4G                     -
rpool/data/vm-151-disk-1  usedbychildren        0B                        -
rpool/data/vm-151-disk-1  usedbyrefreservation  0B                        -
rpool/data/vm-151-disk-1  logbias               latency                   default
rpool/data/vm-151-disk-1  objsetid              144                       -
rpool/data/vm-151-disk-1  dedup                 off                       default
rpool/data/vm-151-disk-1  mlslabel              none                      default
rpool/data/vm-151-disk-1  sync                  standard                  default
rpool/data/vm-151-disk-1  refcompressratio      1.52x                     -
rpool/data/vm-151-disk-1  written               3.62G                     -
rpool/data/vm-151-disk-1  logicalused           42.5G                     -
rpool/data/vm-151-disk-1  logicalreferenced     29.4G                     -
rpool/data/vm-151-disk-1  volmode               default                   default
rpool/data/vm-151-disk-1  snapshot_limit        none                      default
rpool/data/vm-151-disk-1  snapshot_count        none                      default
rpool/data/vm-151-disk-1  snapdev               hidden                    default
rpool/data/vm-151-disk-1  context               none                      default
rpool/data/vm-151-disk-1  fscontext             none                      default
rpool/data/vm-151-disk-1  defcontext            none                      default
rpool/data/vm-151-disk-1  rootcontext           none                      default
rpool/data/vm-151-disk-1  redundant_metadata    all                       default
rpool/data/vm-151-disk-1  encryption            off                       default
rpool/data/vm-151-disk-1  keylocation           none                      default
rpool/data/vm-151-disk-1  keyformat             none                      default
rpool/data/vm-151-disk-1  pbkdf2iters           0                         default
rpool/data/vm-151-disk-1  snapshots_changed     Mon Sep 22 22:17:21 2025  -
rpool/data/vm-151-disk-1  prefetch              all                       default

Normal VM (156 - aptcacherng):
Code:
root@HOST:/# zfs get all rpool/data/vm-156-disk-0
NAME                      PROPERTY              VALUE                     SOURCE
rpool/data/vm-156-disk-0  type                  volume                    -
rpool/data/vm-156-disk-0  creation              Sun Nov 17 15:30 2019     -
rpool/data/vm-156-disk-0  used                  16.7G                     -
rpool/data/vm-156-disk-0  available             221G                      -
rpool/data/vm-156-disk-0  referenced            7.27G                     -
rpool/data/vm-156-disk-0  compressratio         1.37x                     -
rpool/data/vm-156-disk-0  reservation           none                      default
rpool/data/vm-156-disk-0  volsize               10G                       local
rpool/data/vm-156-disk-0  volblocksize          8K                        -
rpool/data/vm-156-disk-0  checksum              on                        default
rpool/data/vm-156-disk-0  compression           lz4                       inherited from rpool
rpool/data/vm-156-disk-0  readonly              off                       default
rpool/data/vm-156-disk-0  createtxg             4380234                   -
rpool/data/vm-156-disk-0  copies                1                         default
rpool/data/vm-156-disk-0  refreservation        none                      default
rpool/data/vm-156-disk-0  guid                  12742254920919865792      -
rpool/data/vm-156-disk-0  primarycache          all                       default
rpool/data/vm-156-disk-0  secondarycache        all                       default
rpool/data/vm-156-disk-0  usedbysnapshots       9.40G                     -
rpool/data/vm-156-disk-0  usedbydataset         7.27G                     -
rpool/data/vm-156-disk-0  usedbychildren        0B                        -
rpool/data/vm-156-disk-0  usedbyrefreservation  0B                        -
rpool/data/vm-156-disk-0  logbias               latency                   default
rpool/data/vm-156-disk-0  objsetid              284                       -
rpool/data/vm-156-disk-0  dedup                 off                       default
rpool/data/vm-156-disk-0  mlslabel              none                      default
rpool/data/vm-156-disk-0  sync                  standard                  default
rpool/data/vm-156-disk-0  refcompressratio      1.37x                     -
rpool/data/vm-156-disk-0  written               4.25G                     -
rpool/data/vm-156-disk-0  logicalused           22.7G                     -
rpool/data/vm-156-disk-0  logicalreferenced     9.95G                     -
rpool/data/vm-156-disk-0  volmode               default                   default
rpool/data/vm-156-disk-0  snapshot_limit        none                      default
rpool/data/vm-156-disk-0  snapshot_count        none                      default
rpool/data/vm-156-disk-0  snapdev               hidden                    default
rpool/data/vm-156-disk-0  context               none                      default
rpool/data/vm-156-disk-0  fscontext             none                      default
rpool/data/vm-156-disk-0  defcontext            none                      default
rpool/data/vm-156-disk-0  rootcontext           none                      default
rpool/data/vm-156-disk-0  redundant_metadata    all                       default
rpool/data/vm-156-disk-0  encryption            off                       default
rpool/data/vm-156-disk-0  keylocation           none                      default
rpool/data/vm-156-disk-0  keyformat             none                      default
rpool/data/vm-156-disk-0  pbkdf2iters           0                         default
rpool/data/vm-156-disk-0  snapshots_changed     Mon Sep 22 20:50:31 2025  -
rpool/data/vm-156-disk-0  prefetch              all                       default
 

Attachments

Now I'm recovering the other one from a Chroot and it's MUCH faster already compared to when booted from the Virtual Disk (I booted from a Virtual USB Pendrive).

I am not sure what you mean by that, could you please explain clearly what you are doing and what effects you are seeing?
 
I am not sure what you mean by that, could you please explain clearly what you are doing and what effects you are seeing?
The Virtual Machine 151 MirrorNAS was left unbootable because I interrupted an apt dist-upgrade and that left either the Kernel or Initramfs in a bad State (probably due to a half-compiled ZFS DKMS Module).

I basically did a rescue of that broken VM using a Virtual USB Pendrive (Debian 13 Trixie AMD64), booted LiveUSB, mount Root FS to /mnt/debian, bind-mount /sys, /dev, /proc, then chroot into it.

In chroot I ran dpkg --configure -a to get the broken State fixed, followed by apt dist-upgrade (to fully upgrade to Debian 13 Trixie AMD64), then apt autoremove and finally did a update-initramfs -k all -u ; update-grub ; update-initramfs -k all -u ; update-grub.

ALL these Operations within chroot (from the LiveUSB System) were very fast :) .

Exited chroot, unmounted everything, then reboot into the real System using the correct Virtual Disk (no more Virtual USB Pendrive).

Now in the real System it's back to super-slow :rolleyes::
Code:
root@MirrorNAS:/usr/src# ./fio_benchmark.sh
Sleeping for 120 Seconds before starting Benchmark
FIO RANDOM IO Benchmark for Block Size = 512 and Queue Depth = 1
RAW Size = 1073741824 / RAW Block Size = 512 requires 2097152 Number of small Files
Writing one BIG File for Block Size = 512 and Queue Depth = 1:
==============================================================================================
write_iops: (g=0): rw=randwrite, bs=(R) 512B-512B, (W) 512B-512B, (T) 512B-512B, ioengine=libaio, iodepth=1
fio-3.39
Starting 1 process
write_iops: Laying out IO file (1 file / 1024MiB)
Jobs: 1 (f=1): [w(1)][100.0%][w=50KiB/s][w=100 IOPS][eta 00m:00s]
write_iops: (groupid=0, jobs=1): err= 0: pid=2996: Tue Sep 23 13:52:51 2025
  write: IOPS=85, BW=42.8KiB/s (43.8kB/s)(25.1MiB/600011msec); 0 zone resets
    slat (usec): min=15, max=540869, avg=11174.25, stdev=15150.27
    clat (usec): min=2, max=356573, avg=496.72, stdev=2612.65
     lat (msec): min=2, max=540, avg=11.67, stdev=15.02
    clat percentiles (usec):
     |  1.00th=[    4],  5.00th=[    4], 10.00th=[    6], 20.00th=[    8],
     | 30.00th=[    9], 40.00th=[    9], 50.00th=[    9], 60.00th=[   10],
     | 70.00th=[   10], 80.00th=[   10], 90.00th=[   18], 95.00th=[ 5342],
     | 99.00th=[ 6587], 99.50th=[ 6718], 99.90th=[ 8356], 99.95th=[10290],
     | 99.99th=[42730]
   bw (  KiB/s): min=    2, max=   60, per=98.10%, avg=42.81, stdev= 9.41, samples=1200
   iops        : min=    4, max=  120, avg=85.63, stdev=18.82, samples=1200
  lat (usec)   : 4=7.90%, 10=80.15%, 20=2.08%, 50=0.88%, 100=0.01%
  lat (usec)   : 250=0.01%
  lat (msec)   : 4=2.03%, 10=6.90%, 20=0.03%, 50=0.02%, 100=0.01%
  lat (msec)   : 250=0.01%, 500=0.01%
  cpu          : usr=0.20%, sys=1.01%, ctx=99373, majf=0, minf=37
  IO depths    : 1=100.0%, 2=0.0%, 4=0.0%, 8=0.0%, 16=0.0%, 32=0.0%, >=64=0.0%
     submit    : 0=0.0%, 4=100.0%, 8=0.0%, 16=0.0%, 32=0.0%, 64=0.0%, >=64=0.0%
     complete  : 0=0.0%, 4=100.0%, 8=0.0%, 16=0.0%, 32=0.0%, 64=0.0%, >=64=0.0%
     issued rwts: total=0,51379,0,0 short=0,0,0,0 dropped=0,0,0,0
     latency   : target=0, window=0, percentile=100.00%, depth=1

Run status group 0 (all jobs):
  WRITE: bw=42.8KiB/s (43.8kB/s), 42.8KiB/s-42.8KiB/s (43.8kB/s-43.8kB/s), io=25.1MiB (26.3MB), run=600011-600011msec

Disk stats (read/write):
  sdb: ios=3/161987, sectors=24/2078477, merge=0/187312, ticks=0/598857, in_queue=1125918, util=96.52%
==============================================================================================
Removing Test Files
 
is there load on the VM itself (when booted normally)?
 
is there load on the VM itself (when booted normally)?
Not really.

I mean right now the entire Server load as seen from the Host is very low and most of it it's caused by running fio right now. Everything else is pretty much Idle.
 

Attachments

  • 20250923_proxmox_host_load_very_little.png
    20250923_proxmox_host_load_very_little.png
    230.1 KB · Views: 2
please check with a tool like atop how the resource usage inside the VM is like..
 
Also the Load on the Guest 151 only

If I were to take a blind Stab at it, I'd guess that only 10% of the CPU Power is actually being allocated.

Not sure how that causes the Performance of the Storage to drop THIS much though.

It's weird because from LiveUSB + chroot it worked fine, so there is something about running on the Real System that is not there in the chroot.

Although now they are both Debian Trixie even same Kernel Version, so not really sure what it could be the difference (between LiveUSB chroot and Real System Booted).
 

Attachments

  • 20250923_proxmox_151_load_very_little.png
    20250923_proxmox_151_load_very_little.png
    266.5 KB · Views: 0
htop (while fio Benchmark is running VERY SLOWLY) since I have it installed it already. I'll try to install atop as well ...
 

Attachments

  • 20250923_proxmox_151_htop_during_fio_testing.png
    20250923_proxmox_151_htop_during_fio_testing.png
    371.3 KB · Views: 1
Hey, first observation looking at the VM Confs:
discard & thread options differ.
iothread shouldn't matter and discard being disabled on the Fast VM (156 APTCacherNG) is even more weirder (it should be slower not faster if anything).

I guess it doesn't make too much of a difference at this speed and probably only relevant for TRIM Operations.
 
@fabian: atop as you requested (fio still running)
 

Attachments

  • 20250923_proxmox_151_atop_during_fio_testing_02.png
    20250923_proxmox_151_atop_during_fio_testing_02.png
    305.6 KB · Views: 3
  • 20250923_proxmox_151_atop_during_fio_testing_01.png
    20250923_proxmox_151_atop_during_fio_testing_01.png
    364.7 KB · Views: 3
it would be more helpful without a benchmark running, to see how the numbers look like under the base load