Newbie question about ceph gui in proxmox

silvered.dragon

Renowned Member
Nov 4, 2015
123
4
83
I have 3 node ceph cluster, each node has 4x600GB OSD and I have just one pool with size 3/2.
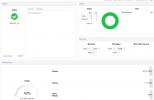
I was thinking that over 33% of used storage(I mean just data no replicas) I would have received some warning message, but cluster seems healthy over 40% and everything is green. I'm attaching some screens and the ceph df result. So can someone explain to me how is possible to have 2 replicas if storage is over 33%?
Code:
root@node1:~# ceph df
--- RAW STORAGE ---
CLASS     SIZE    AVAIL     USED  RAW USED  %RAW USED
hdd    6.5 TiB  3.9 TiB  2.6 TiB   2.6 TiB      39.83
TOTAL  6.5 TiB  3.9 TiB  2.6 TiB   2.6 TiB      39.83
 
--- POOLS ---
POOL                   ID  PGS   STORED  OBJECTS     USED  %USED  MAX AVAIL
ceph                    1  128  885 GiB  230.34k  2.6 TiB  47.34    986 GiB
device_health_metrics   4    1      0 B        0      0 B      0    986 GiB

ceph.png

pool.png
 
The cluster will go into HEALTH_WARN when a single OSD is filled to 85%. This is the the safe nearfull ratio when the cluster has 7 nodes.

For a three node cluster the safe nearfull ratio is 2/3 or 67%, as the remaining OSDs have to have free capacity if an OSD is down and out.

But in a three node cluster you always have the situation that if one node is down Ceph will not be able to recreate the third copy and will run degraded placement groups with only two copies until the third node is up again.

You can use https://florian.ca/ceph-calculator/ to see these values.
 
sorry again, you were clear but there is a part that I'm missing surely due to inexperience, you are talking about single OSD, but the 40% value is related to the total amount of data present in the entire cluster, so how can be possible to have 40% used if size is 3 without any warning?
 
sorry again, you were clear but there is a part that I'm missing surely due to inexperience, you are talking about single OSD, but the 40% value is related to the total amount of data present in the entire cluster, so how can be possible to have 40% used if size is 3 without any warning?

I think the misunderstanding simply comes from the fact that, in the proxmox gui, the graphic usage refers to the raw space used including the replicas, so 40% - 2.61 TiB of 6.55 TiB means that within my cluster I have 2.61Tib / 3 around 870Gib of real data occupied. So I'm still a long way from 33%.
 

About

The Proxmox community has been around for many years and offers help and support for Proxmox VE, Proxmox Backup Server, and Proxmox Mail Gateway.
We think our community is one of the best thanks to people like you!

Get your subscription!

The Proxmox team works very hard to make sure you are running the best software and getting stable updates and security enhancements, as well as quick enterprise support. Tens of thousands of happy customers have a Proxmox subscription. Get yours easily in our online shop.

Buy now!