[KNOWN ZFS PROBLEM] Freezing while high IO (only on host - not guest)

jkalousek

Well-Known Member
Aug 28, 2016
41
0
46
EDIT: As I find out that high IO will only result in freezing while performed on host, not guests please skip to post #19 as there are new findings.

I'm basically reposting issue that I have with backups to FreeNAS from this post (https://forums.freenas.org/index.php?threads/extreme-slow-downs-while-copying-files-40-gb.59878/) as I hope that someone here may have a solution or idea.

Short version:
I have problem with backup or simple copy with cp or rsync to my FreeNAS Server of big files (larger than 40 GB) when reached certain amount of transfered data speed will slow down from 300 MB/s (10G network) to 2-10MB/s and Proxmox will completely hang until either backup finishes - which can take very long time or until backup timeouts. It will freeze every VM/CT that are on same shared connection (10G to switch), but not others. I tested different nics (1G & 10G) on both sides and nothing changed.

This is for example how backup looks:
Code:
INFO: status: 0% (364904448/42949672960), sparse 0% (36098048), duration 3, read/write 121/109 MB/s
INFO: status: 1% (707002368/42949672960), sparse 0% (44933120), duration 6, read/write 114/111 MB/s
INFO: status: 2% (1045299200/42949672960), sparse 0% (50085888), duration 9, read/write 112/111 MB/s
INFO: status: 3% (1436811264/42949672960), sparse 0% (54272000), duration 12, read/write 130/129 MB/s
INFO: status: 4% (1816920064/42949672960), sparse 0% (54272000), duration 15, read/write 126/126 MB/s
INFO: status: 5% (2197028864/42949672960), sparse 0% (84951040), duration 18, read/write 126/116 MB/s
INFO: status: 6% (2580938752/42949672960), sparse 0% (85008384), duration 21, read/write 127/127 MB/s
INFO: status: 7% (3085434880/42949672960), sparse 0% (85286912), duration 25, read/write 126/126 MB/s
INFO: status: 8% (3450929152/42949672960), sparse 0% (89493504), duration 28, read/write 121/120 MB/s
INFO: status: 9% (3965386752/42949672960), sparse 0% (93696000), duration 32, read/write 128/127 MB/s
INFO: status: 10% (4295229440/42949672960), sparse 0% (95772672), duration 35, read/write 109/109 MB/s
INFO: status: 11% (4774166528/42949672960), sparse 0% (116699136), duration 39, read/write 119/114 MB/s
INFO: status: 12% (5241700352/42949672960), sparse 0% (116822016), duration 43, read/write 116/116 MB/s
INFO: status: 13% (5648416768/42949672960), sparse 0% (116858880), duration 46, read/write 135/135 MB/s
INFO: status: 14% (6013321216/42949672960), sparse 0% (116965376), duration 49, read/write 121/121 MB/s
INFO: status: 15% (6553075712/42949672960), sparse 0% (143826944), duration 53, read/write 134/128 MB/s
INFO: status: 16% (6898057216/42949672960), sparse 0% (148045824), duration 62, read/write 38/37 MB/s
INFO: status: 17% (7355105280/42949672960), sparse 0% (148209664), duration 217, read/write 2/2 MB/s

(at this time Proxmox is inaccessible either by GUI or CLI or directly on server itself)

I tested every type of backup and there were no differences. Problem occurs with both NFS and CIFS on Freenas but not on another servers (speed with Synology on CIFS for example is fine) but also coping between Freenas and Windows is also fine so there is problem just between Proxmox -> FreeNAS transfers.
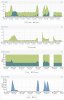
There are no significant CPU usage on both Freenas or Proxmox server - Proxmox is experiencing about 10% load with max 3 % IO delay, around 35% RAM usage and server load bellow 2.
As Proxmox is extremely unresponsive during these backups I do not have copy of zpool iostat but there is nothing that would suggest extreme Disc usage from what I could see.

CPU is: Intel Xeon E5-2620 v4
RAM: 64 GB
DATA DISKS: 2x 1TB SSD in RAID 10 on ZFS
BOOT DISK: 2x satadom in raid 10

It all looks like networking issues but not tied to protocol or nic as I tried different combination of both.
Does anybody please have any Idea what could be wrong? Thank you.
 
Last edited:
Usually systems "hangs" boil down to slow IO.

You can try the command the command

ps faxl

and look if you have processes in the "D" state ( uninterruptible sleep ).

Also have a look if you have in your kernel messages if you have the message
"task blocked for more that 120s" and note which process is being blocked

BTW that backup are going to slow down when you have storage and running VMs on the same network link is normal.
If you want to avoid that, you need to create two different networks.

But this should not make the PVE host unreponsible.

I will test that (ps faxl).
Yes I have lot of hang messages, sorry about not mentioned it earlier I totally forgot that I have that screenshot:
It reports folowing hang tasks (more than 120s):
kthreadd
khungepaged
kswapd
z_wr_iss
txg_sync
ksmtuned
usbhid-ups
cfs-loop

(it seems like all over the place)

I know there were more different ones the other time but I do not have screenshot of that, I will take note of future one.

I'm aware that bakup can slow down on shared interface but I'm making backups during quiet hours and leveraging 10G speed.
Thing I didn't mention clear enough is that while transfer speed is around 5MB/s on 10G no VM/CT will respond, so it's not like they are responding slow, it's like they are completely frozen and response will time out. As soon as I manage to kill the backup/copy (or I have to do hard restart in some cases) everything is back to normal.

PS: Backup to another local storage works without problem.
 
Last edited:
hi jkalousek,

What about your FreeNAS side. Do you have a "slog"-Device aside your dataset?

greets,
vmanz
 
hi jkalousek,

What about your FreeNAS side. Do you have a "slog"-Device aside your dataset?

greets,
vmanz

I do not have SLOG but I have 6x 4 TB disk in RAID 10 (3 groups with 2 discs) And according to usage graphs in Freenas they do not have problem to sustain the load, load drops down immediately as transfer starts loosing speed. The disc load doesn't go to more than 70 % and neither discs latencies are high enough to consider them a bottleneck.

EDIT: But just to reiterate I can do same copy from another machine and the speeds will be fine. Also problem occurs on both 10G & 1G network so 1G surly cannot saturate speed of the pool.
 
Usually systems "hangs" boil down to slow IO.

You can try the command the command

ps faxl

and look if you have processes in the "D" state ( uninterruptible sleep ).

Also have a look if you have in your kernel messages if you have the message
"task blocked for more that 120s" and note which process is being blocked

BTW that backup are going to slow down when you have storage and running VMs on the same network link is normal.
If you want to avoid that, you need to create two different networks.

But this should not make the PVE host unreponsible.

When I do
Code:
 ps faxl | grep " D "
Result is:
Code:
1     0  6613     2  20   0      0     0 io_sch D    ?          0:02  \_ [txg_sync]
0     0 27891  6353  20   0  12788   936 pipe_w S+   pts/6      0:00          \_ grep  D

But not always, txg_sync could be related to https://github.com/zfsonlinux/zfs/issues/3409 as it look similar but it should be fixed since v 0.7.0-rc1 and I have v0.7.3-1.

I will try to increase zfs_arc_min.

Other states are:
S,S<,SN,Ss,Ssl,S<LS,R+,Ss+,SLsl,Sl
 
I did:
Code:
echo 1073741824 >> /sys/module/zfs/parameters/zfs_arc_min
And It seems that dips are little lower (during dips instead of 2-10MB/s transfer speed I now get 25MB/s) system still feels very sluggish after few minutes of transfer.

Only thing that I noticed that wasn't there before (because graphs usualy cut out while system was hanged) is that CPU is only used by 20 %, IO delay is around 10 % but system load is around 10 so something is really slowing down and it is exactly at the moment when speed starts falling down - which makes sense.
 
This is what happens during last two test transfers, system hanged so that graphs are not showing at all. The one that I mentioned in last post was around 13:00 and spike there is clearly visible, but I manage to kill it before it hang system as well.
 

Attachments

  • proxmox_graph_2.JPG
    proxmox_graph_2.JPG
    154.6 KB · Views: 51
1 0 6613 2 20 0 0 0 io_sch D ? 0:02 \_ [txg_sync]

This tgx_sync here means ZFS is not able to write flush your IO to the disks fast enough for what you ask him to write. So the system is probably just waiting for the disks to respond.

I am surprise to see this happening on SSDs if you see that on the PVE host, but on the hand I have no idea how many VMs you're running.
Looking at the list of process blocks you have an IO bottleneck, you should benchmark your installation.
I'm running 6 x CT and 2 x VM.

What would be best way to do benchmark so It would give us proper/all informations? Just try to write bunch of data with dd?
Normally Server Load is around 1,5-2 so I didn't yet consider that there would be problem.

Thank you!
 
I never thought about testing SSD because when I initially build the server and tested them they worked great:

Code:
dd if=/dev/zero of=/DP1/dump/test bs=1G count=2
2+0 records in
2+0 records out
2147483648 bytes (2.1 GB, 2.0 GiB) copied, 1.26704 s, 1.7 GB/s

But as there is larger amount of data:
Code:
dd if=/dev/zero of=/DP1/dump/test bs=1G count=10
10+0 records in
10+0 records out
10737418240 bytes (11 GB, 10 GiB) copied, 35.6388 s, 301 MB/s

But I don't see that anything is happening really during normal use:
Code:
zpool iostat
              capacity     operations     bandwidth
pool        alloc   free   read  write   read  write
----------  -----  -----  -----  -----  -----  -----
DP1          555G   333G     46     71  4.27M  3.41M
rpool       6.10G  23.7G      0     23  12.2K   299K
----------  -----  -----  -----  -----  -----  -----

EDIT: But I still don't get why is backup to another storage NAS working OK without slowdowns.
 
Last edited:
Hi again,

I think you have an effect with synchronous writes at the FreeNAS side. This is not a problem - because this is the system. Your ZIL is getting full after some GB and if FreeNAS didn't get your data "powerloss-safe" (to a nonvolative Memory) it answers: waaaaaaaaiiiiiiiiit!

Have you read https://forums.freenas.org/index.php?threads/some-insights-into-slog-zil-with-zfs-on-freenas.13633/ ?

My fileservers both have e5-2603 (v1 I think) with 64GB and even with pools of SM863 I spent them a SLOG-device (8GB host protected area on a intel 3700er). This is far too much. The SLOG has to be dimensioned at 10GB Ethernet: 5Sek. * 10 * 0,125 GB/s = 6,25 GB.
If I stand in front of my NAS and look at the LEDs I can see the slog is "on fire" beside the mirror is flushing every few seconds.

So if the problem did not occour with the synology, you should investigate:
what filesystem do it use?
are the writes handled sync or async?
then you can start your messurings between boskop and pink lady.

Tip: for fast testing you can mount your FreeNAS NFS-share async. This is not recommended for production like jgreco explained.

Also formerly discussed in this forum was the performance-difference between iscsi and nfs. I can remember some complained that vmware is much faster (iscsi) than proxmox (nfs). The conclusion was, that they are all at the same level, if the writes have the same synchronousity.

bye
Thank you for tips, yes I read large portion of FreeNAS documentation and I have multiple FreeNAS boxes, it's true that only this one does not have ZIL on SSD, but I already tested transfers with disabled ZIL on given dataset to rule it out, and I also had NFS set to async.

And still why It would slow down from Proxmox but not from Windows? I tested same file from both and speed from windows were constant where as speed from Proxmox were all over the place. I'm not saying that problem is not FreeNAS, but I do not think that it is pool's fault.

Btw Synology is slow for my taste, we only use it for backup and another for backup of the backups, they use their hybrid Raid which has slow writes, but they are relatively stable.

Also this sumarizes my testing so far:
Proxmox -> FreeNAS (NFS, CIFS): Slowing down (both on direct interconnect 1G and 10G speed through switch)
Proxmox -> Synology (CIFS): Normal Speed (1G through switch)
Windows -> FreeNAS (CIFS): Normal Speed (1G through switch)

So except Proxmox to FreeNAS everything is working OK, thats what confuses me the most.
 
After many more tests and many more tuned values I'd given up on idea that It is FreeNAS problem completely, nothing I did on FreeNAS side changed the behavior.
Today I added two 500 GB spinning HDD to the Proxmox server and put them to RAID 1 (ZFS).
And surprise surprise problem is still there when I try to copy from SSD pool to HDD pool I see slowdowns and huge server load (Interesting fact, when I'm copping files onto same drive - from SSD to same SSD speeds are ok, this includes backup).

My next test was copy from HDD to FreeNAS and same behavior occured.
This is how much over the place reads from HDD on Proxmox machine are (watch DT1):
Code:
# zpool iostat 2
              capacity     operations     bandwidth
pool        alloc   free   read  write   read  write
----------  -----  -----  -----  -----  -----  -----
DP1          556G   332G     62    395   901K  4.13M
DT1          120G   344G    764      0  95.5M      0
rpool       6.17G  23.6G      3     47  22.0K   676K
----------  -----  -----  -----  -----  -----  -----
DP1          556G   332G    123    166   991K  8.25M
DT1          120G   344G    763      0  95.4M      0
rpool       6.17G  23.6G      3     15  40.0K   128K
----------  -----  -----  -----  -----  -----  -----
DP1          556G   332G     10      3  75.9K  16.0K
DT1          120G   344G    679     34  84.7M   161K
rpool       6.17G  23.6G      1     11  16.0K   482K
----------  -----  -----  -----  -----  -----  -----
DP1          556G   332G      5    294  22.0K  12.9M
DT1          120G   344G    663      0  82.9M      0
rpool       6.17G  23.6G      1     23  7.99K   274K
----------  -----  -----  -----  -----  -----  -----
DP1          556G   332G      0      1      0  48.0K
DT1          120G   344G    735     25  91.9M   136K
rpool       6.17G  23.6G      0     22  4.00K   220K
----------  -----  -----  -----  -----  -----  -----
DP1          556G   332G      0     67      0  1.29M
DT1          120G   344G    845      6   106M  25.7K
rpool       6.17G  23.6G      7     44  44.0K   620K
----------  -----  -----  -----  -----  -----  -----
DP1          556G   332G     12      3   132K   148K
DT1          120G   344G    816      0   102M      0
rpool       6.17G  23.6G    451     10  3.72M  83.9K
----------  -----  -----  -----  -----  -----  -----
DP1          556G   332G      1      0  9.99K      0
DT1          120G   344G    856     32   107M   161K
rpool       6.17G  23.6G     24      3   146K   152K
----------  -----  -----  -----  -----  -----  -----
DP1          556G   332G     39    101   462K  1.86M
DT1          120G   344G    860      0   108M      0
rpool       6.17G  23.6G     10     37  46.0K   654K
----------  -----  -----  -----  -----  -----  -----
DP1          556G   332G     25      1   358K  48.0K
DT1          120G   344G    781      7  97.6M  18.7K
rpool       6.17G  23.6G      3     24  18.0K   166K
----------  -----  -----  -----  -----  -----  -----
DP1          556G   332G     10    137  46.0K  3.27M
DT1          120G   344G    757     26  94.2M   143K
rpool       6.17G  23.6G     33     30   232K   362K
----------  -----  -----  -----  -----  -----  -----
DP1          556G   332G      2      0  34.0K  4.00K
DT1          120G   344G    810      0   101M      0
rpool       6.17G  23.6G    282     23  2.33M   234K
----------  -----  -----  -----  -----  -----  -----
DP1          556G   332G     10      5   132K  95.9K
DT1          120G   344G    700     38  87.0M   160K
rpool       6.17G  23.6G    155      0  1.22M      0
----------  -----  -----  -----  -----  -----  -----
DP1          556G   332G     10     94  62.0K  1.71M
DT1          120G   344G    664      0  83.0M      0
rpool       6.17G  23.6G      8     42   132K   612K
----------  -----  -----  -----  -----  -----  -----
DP1          556G   332G      0      0      0      0
DT1          120G   344G    661      0  82.6M      0
rpool       6.17G  23.6G    171     12  1.40M   104K
----------  -----  -----  -----  -----  -----  -----
DP1          556G   332G     81    123   384K  3.42M
DT1          120G   344G    682     32  84.9M   148K
rpool       6.17G  23.6G     10     33  50.0K   680K
----------  -----  -----  -----  -----  -----  -----
DP1          556G   332G     10      5  74.0K  64.0K
DT1          120G   344G    648      0  81.1M      0
rpool       6.17G  23.6G      5     60  30.0K   456K
----------  -----  -----  -----  -----  -----  -----
DP1          556G   332G     71      0   386K      0
DT1          120G   344G    447     35  55.5M   151K
rpool       6.17G  23.6G    107     58   578K   468K
----------  -----  -----  -----  -----  -----  -----
DP1          556G   332G     50    168   340K  3.44M
DT1          120G   344G      0      0      0      0
rpool       6.17G  23.6G    116      9  1.01M   232K
----------  -----  -----  -----  -----  -----  -----
DP1          556G   332G     12      9   218K   280K
DT1          120G   344G      0      0      0      0
rpool       6.17G  23.6G     32     36   262K   645K
----------  -----  -----  -----  -----  -----  -----
DP1          556G   332G      1     51  12.0K  1.21M
DT1          120G   344G    259      0  32.4M      0
rpool       6.17G  23.6G    114     85   685K  1.38M
----------  -----  -----  -----  -----  -----  -----
DP1          556G   332G      8    144  48.0K  2.46M
DT1          120G   344G    297      0  37.1M      0
rpool       6.17G  23.6G    159     99   913K  1.05M
----------  -----  -----  -----  -----  -----  -----
DP1          556G   332G      4     57  27.4K   856K
DT1          120G   344G    254     15  31.6M  69.6K
rpool       6.17G  23.6G    120     78   813K  1.35M
----------  -----  -----  -----  -----  -----  -----
DP1          556G   332G      0      7  2.00K   196K
DT1          120G   344G    498      0  62.2M      0
rpool       6.18G  23.6G    133     76  1.21M   560K
----------  -----  -----  -----  -----  -----  -----
DP1          556G   332G      4      0  29.1K      0
DT1          120G   344G    552     37  68.6M   152K
rpool       6.18G  23.6G     70     89   460K  1.17M
----------  -----  -----  -----  -----  -----  -----
DP1          556G   332G      8    118  50.0K  1.64M
DT1          120G   344G    244      0  30.5M      0
rpool       6.18G  23.6G    109    102   805K   999K
----------  -----  -----  -----  -----  -----  -----
DP1          556G   332G      3      0  28.0K      0
DT1          120G   344G    128     41  15.6M   161K
rpool       6.18G  23.6G    170     56  1.51M   480K
----------  -----  -----  -----  -----  -----  -----
DP1          556G   332G     13    128   144K  1.94M
DT1          120G   344G      0      0      0      0
rpool       6.18G  23.6G     26     10   270K   286K
----------  -----  -----  -----  -----  -----  -----
DP1          556G   332G      6      7   116K   144K
DT1          120G   344G    160      0  20.1M      0
rpool       6.18G  23.6G     51     19   502K   466K
----------  -----  -----  -----  -----  -----  -----
DP1          556G   332G    115      4   781K  20.0K
DT1          120G   344G    476     34  59.0M   161K
rpool       6.17G  23.6G    108     95  1.01M  1.20M
----------  -----  -----  -----  -----  -----  -----
DP1          556G   332G     19    202  93.3K  4.51M
DT1          120G   344G    194      0  24.3M      0
rpool       6.17G  23.6G    224     87  1.40M  1.38M
----------  -----  -----  -----  -----  -----  -----
DP1          556G   332G      4      0  34.0K      0
DT1          120G   344G     29     32  3.37M   161K
rpool       6.17G  23.6G     79      9   559K   203K
----------  -----  -----  -----  -----  -----  -----
DP1          556G   332G      7    137  33.9K  2.33M
DT1          120G   344G     57      0  7.24M      0
rpool       6.17G  23.6G     21     15   124K   648K
----------  -----  -----  -----  -----  -----  -----
DP1          556G   332G      0      0      0      0
DT1          120G   344G      0      0      0      0
rpool       6.17G  23.6G      8      4  38.0K   138K
----------  -----  -----  -----  -----  -----  -----
DP1          556G   332G     17      0   136K  12.0K
DT1          120G   344G      0     33      0   161K
rpool       6.17G  23.6G      2     23  9.99K   366K
----------  -----  -----  -----  -----  -----  -----
DP1          556G   332G      8    180   120K  3.71M
DT1          120G   344G    145      0  18.2M      0
rpool       6.17G  23.6G     48    103   390K  1.52M
----------  -----  -----  -----  -----  -----  -----
DP1          556G   332G      5      0  30.0K      0
DT1          120G   344G    741     28  92.2M   157K
rpool       6.17G  23.6G     24    100   200K   829K
----------  -----  -----  -----  -----  -----  -----
DP1          556G   332G      6    142  32.0K  2.61M
DT1          120G   344G    238      3  29.9M  4.00K
rpool       6.17G  23.6G    142     87   911K   887K
----------  -----  -----  -----  -----  -----  -----
DP1          556G   332G      0      0  24.0K  4.00K
DT1          120G   344G      0      0      0      0
rpool       6.17G  23.6G     51      8   424K   256K
----------  -----  -----  -----  -----  -----  -----
DP1          556G   332G      1      0  7.99K      0
DT1          120G   344G      0     32    511   161K
rpool       6.17G  23.6G      0     10  4.00K   340K
----------  -----  -----  -----  -----  -----  -----
DP1          556G   332G      1     90  22.0K  1.22M
DT1          120G   344G      0      0      0      0
rpool       6.17G  23.6G     50     61   640K   907K
----------  -----  -----  -----  -----  -----  -----

Basically same is happening with the other pool of SSD but with much greater speed differences.
So does anybody have any Idea what could be causing this?

In my opinion it's not caused by:
  • server load from VMs because they are stored only on SSDs. Unless something is blocking whole server (I will test that in coming days as I didn't yet have chance to stop all VM/CTs).
  • Because it is happening between internal pools on same machine I don't thing it's caused by FreeNAS as it working with every other machine fine
  • networking
What's left is either ZFS or some weird bug in disc controller (in IT mode as HBA), any other ideas?

Thank you everyone that tried to help me so far.
 
Last edited:
Even setting backup/copy to lowest possible priority and limiting speed does not help:

Code:
nice -n 19 ionice -c2 -n7 rsync --bwlimit=51200 -r --progress /DP1/backups/ /DT3btrfs/backups/

Setting:
Code:
vm.dirty_ratio = 5
vm.dirty_background_ ratio = 1
Seems to help slightly but it may as well be random, because server still stops responding.
 
Last edited:
1] dd as benchmark is useless, use fio or other good benchmark system
2] try your tests with HDDs as source instead SSDs
 
1] dd as benchmark is useless, use fio or other good benchmark system
2] try your tests with HDDs as source instead SSDs

FIO on main storage SSD:
Code:
# full write pass - there is definitely problem - server slowing down
fio --name=writefile --size=10G --filesize=10G --filename=/DP1/test --bs=1M --nrfiles=1 --sync=0 --randrepeat=0 --rw=write --refill_buffers --end_fsync=1 --iodepth=200 --ioengine=libaio

writefile: (g=0): rw=write, bs=1M-1M/1M-1M/1M-1M, ioengine=libaio, iodepth=200
fio-2.16
Starting 1 process
Jobs: 1 (f=1): [F(1)] [100.0% done] [0KB/0KB/0KB /s] [0/0/0 iops] [eta 00m:00s]
writefile: (groupid=0, jobs=1): err= 0: pid=22309: Mon Dec 25 21:34:53 2017
  write: io=10240MB, bw=140409KB/s, iops=137, runt= 74680msec
    slat (usec): min=155, max=16954K, avg=6397.87, stdev=275876.43
    clat (usec): min=4, max=17088K, avg=1320369.87, stdev=3706921.61
     lat (usec): min=294, max=17088K, avg=1326767.74, stdev=3715280.40
    clat percentiles (msec):
     |  1.00th=[   50],  5.00th=[  103], 10.00th=[  104], 20.00th=[  111],
     | 30.00th=[  116], 40.00th=[  125], 50.00th=[  137], 60.00th=[  167],
     | 70.00th=[  215], 80.00th=[  237], 90.00th=[  334], 95.00th=[12780],
     | 99.00th=[16712], 99.50th=[16712], 99.90th=[16712], 99.95th=[16712],
     | 99.99th=[16712]
    lat (usec) : 10=0.01%, 750=0.01%
    lat (msec) : 2=0.02%, 4=0.03%, 10=0.12%, 20=0.20%, 50=0.62%
    lat (msec) : 100=1.75%, 250=81.82%, 500=5.71%, >=2000=9.72%
  cpu          : usr=3.19%, sys=3.92%, ctx=7975, majf=0, minf=11
  IO depths    : 1=0.1%, 2=0.1%, 4=0.1%, 8=0.1%, 16=0.2%, 32=0.3%, >=64=99.4%
     submit    : 0=0.0%, 4=100.0%, 8=0.0%, 16=0.0%, 32=0.0%, 64=0.0%, >=64=0.0%
     complete  : 0=0.0%, 4=100.0%, 8=0.0%, 16=0.0%, 32=0.0%, 64=0.0%, >=64=0.1%
     issued    : total=r=0/w=10240/d=0, short=r=0/w=0/d=0, drop=r=0/w=0/d=0
     latency   : target=0, window=0, percentile=100.00%, depth=200

Run status group 0 (all jobs):
  WRITE: io=10240MB, aggrb=140409KB/s, minb=140409KB/s, maxb=140409KB/s, mint=74680msec, maxt=74680msec

Code:
# random read - OK (or I didn't notice any slowdowns during test)
fio --time_based --name=benchmark --size=10G --runtime=30 --filename=/DP1/test --ioengine=libaio --randrepeat=0 --iodepth=128 --invalidate=1 --verify=0 --verify_fatal=0 --numjobs=4 --rw=randread --blocksize=4k --group_reporting

fio-2.16
Starting 4 processes
Jobs: 4 (f=4): [r(4)] [100.0% done] [23732KB/0KB/0KB /s] [5933/0/0 iops] [eta 00m:00s]
benchmark: (groupid=0, jobs=4): err= 0: pid=29013: Mon Dec 25 21:36:35 2017
  read : io=784792KB, bw=26159KB/s, iops=6539, runt= 30001msec
    slat (usec): min=3, max=25906, avg=609.08, stdev=393.19
    clat (usec): min=3, max=144711, avg=77520.87, stdev=11091.58
     lat (usec): min=924, max=145538, avg=78129.95, stdev=11166.97
    clat percentiles (msec):
     |  1.00th=[   56],  5.00th=[   61], 10.00th=[   64], 20.00th=[   69],
     | 30.00th=[   72], 40.00th=[   75], 50.00th=[   78], 60.00th=[   81],
     | 70.00th=[   84], 80.00th=[   87], 90.00th=[   92], 95.00th=[   96],
     | 99.00th=[  100], 99.50th=[  103], 99.90th=[  139], 99.95th=[  141],
     | 99.99th=[  145]
    lat (usec) : 4=0.01%, 10=0.01%, 1000=0.01%
    lat (msec) : 2=0.01%, 4=0.01%, 10=0.02%, 20=0.03%, 50=0.14%
    lat (msec) : 100=98.65%, 250=1.15%
  cpu          : usr=0.54%, sys=4.85%, ctx=139641, majf=0, minf=543
  IO depths    : 1=0.1%, 2=0.1%, 4=0.1%, 8=0.1%, 16=0.1%, 32=0.1%, >=64=99.9%
     submit    : 0=0.0%, 4=100.0%, 8=0.0%, 16=0.0%, 32=0.0%, 64=0.0%, >=64=0.0%
     complete  : 0=0.0%, 4=100.0%, 8=0.0%, 16=0.0%, 32=0.0%, 64=0.0%, >=64=0.1%
     issued    : total=r=196198/w=0/d=0, short=r=0/w=0/d=0, drop=r=0/w=0/d=0
     latency   : target=0, window=0, percentile=100.00%, depth=128

Run status group 0 (all jobs):
   READ: io=784792KB, aggrb=26158KB/s, minb=26158KB/s, maxb=26158KB/s, mint=30001msec, maxt=30001msec

Code:
# random write - OK (or I didn't notice any slowdowns during test)
fio --time_based --name=benchmark --size=10G --runtime=30 --filename=/DP1/test --ioengine=libaio --randrepeat=0 --iodepth=128 --invalidate=1 --verify=0 --verify_fatal=0 --numjobs=4 --rw=randwrite --blocksize=4k --group_reporting

fio-2.16
Starting 4 processes
Jobs: 4 (f=4): [w(4)] [100.0% done] [0KB/1840KB/0KB /s] [0/460/0 iops] [eta 00m:00s]
benchmark: (groupid=0, jobs=4): err= 0: pid=29355: Mon Dec 25 21:40:11 2017
  write: io=113048KB, bw=3754.8KB/s, iops=938, runt= 30108msec
    slat (usec): min=6, max=192252, avg=4250.53, stdev=11999.38
    clat (usec): min=6, max=2316.4K, avg=539291.04, stdev=360002.18
     lat (msec): min=8, max=2317, avg=543.54, stdev=361.99
    clat percentiles (msec):
     |  1.00th=[  106],  5.00th=[  186], 10.00th=[  237], 20.00th=[  306],
     | 30.00th=[  334], 40.00th=[  363], 50.00th=[  404], 60.00th=[  469],
     | 70.00th=[  570], 80.00th=[  766], 90.00th=[ 1045], 95.00th=[ 1369],
     | 99.00th=[ 1778], 99.50th=[ 1893], 99.90th=[ 2147], 99.95th=[ 2245],
     | 99.99th=[ 2311]
    lat (usec) : 10=0.01%, 20=0.01%
    lat (msec) : 10=0.01%, 100=0.87%, 250=10.47%, 500=52.24%, 750=15.82%
    lat (msec) : 1000=9.63%, 2000=10.78%, >=2000=0.16%
  cpu          : usr=0.11%, sys=1.03%, ctx=20560, majf=0, minf=38
  IO depths    : 1=0.1%, 2=0.1%, 4=0.1%, 8=0.1%, 16=0.2%, 32=0.5%, >=64=99.1%
     submit    : 0=0.0%, 4=100.0%, 8=0.0%, 16=0.0%, 32=0.0%, 64=0.0%, >=64=0.0%
     complete  : 0=0.0%, 4=100.0%, 8=0.0%, 16=0.0%, 32=0.0%, 64=0.0%, >=64=0.1%
     issued    : total=r=0/w=28262/d=0, short=r=0/w=0/d=0, drop=r=0/w=0/d=0
     latency   : target=0, window=0, percentile=100.00%, depth=128

Run status group 0 (all jobs):
  WRITE: io=113048KB, aggrb=3754KB/s, minb=3754KB/s, maxb=3754KB/s, mint=30108msec, maxt=30108msec


FIO on test storage HDD (not ZFS! I testet btrfs just to try if it is caused by ZFS):
Code:
# full write pass - froze server for a while
fio --name=writefile --size=10G --filesize=10G --filename=/DT3btrfs/test --bs=1M --nrfiles=1 --sync=0 --randrepeat=0 --rw=write --refill_buffers --end_fsync=1 --iodepth=200 --ioengine=libaio
fio: job 'writefile' (state=5) hasn't exited in 300 seconds, it appears to be stuck. Doing forceful exit of this job.

writefile: (groupid=0, jobs=1): err= 0: pid=19315: Mon Dec 25 21:53:07 2017
    lat (msec) : 100=40.71%, 750=29.57%
  cpu          : usr=0.00%, sys=0.00%, ctx=0, majf=0, minf=0
  IO depths    : 1=0.1%, 2=0.3%, 4=0.6%, 8=1.2%, 16=2.4%, 32=4.8%, >=64=90.6%
     submit    : 0=0.0%, 4=100.0%, 8=0.0%, 16=0.0%, 32=0.0%, 64=0.0%, >=64=0.0%
     complete  : 0=0.0%, 4=100.0%, 8=0.0%, 16=0.0%, 32=0.0%, 64=0.0%, >=64=0.0%
     issued    : total=r=0/w=673/d=0, short=r=0/w=0/d=0, drop=r=0/w=0/d=0
     latency   : target=0, window=0, percentile=100.00%, depth=200

Code:
# random read - OKish
fio --time_based --name=benchmark --size=10G --runtime=30 --filename=/DT3btrfs/test --ioengine=libaio --randrepeat=0 --iodepth=128 --invalidate=1 --verify=0 --verify_fatal=0 --numjobs=4 --rw=randread --blocksize=4k --group_reporting

fio-2.16
Starting 4 processes
Jobs: 4 (f=4): [r(4)] [0.2% done] [0KB/0KB/0KB /s] [0/0/0 iops] [eta 09h:35m:42s]
benchmark: (groupid=0, jobs=4): err= 0: pid=22030: Mon Dec 25 21:55:43 2017
  read : io=113192KB, bw=2023.6KB/s, iops=505, runt= 55938msec
    slat (usec): min=2, max=55938K, avg=7905.81, stdev=663094.62
    clat (usec): min=11, max=55834K, avg=753097.86, stdev=6421879.85
     lat (msec): min=2, max=55937, avg=761.00, stdev=6455.10
    clat percentiles (msec):
     |  1.00th=[    3],  5.00th=[    3], 10.00th=[    3], 20.00th=[    3],
     | 30.00th=[    3], 40.00th=[    3], 50.00th=[    3], 60.00th=[    3],
     | 70.00th=[    4], 80.00th=[    4], 90.00th=[    4], 95.00th=[    4],
     | 99.00th=[16712], 99.50th=[16712], 99.90th=[16712], 99.95th=[16712],
     | 99.99th=[16712]
    lat (usec) : 20=0.01%
    lat (msec) : 4=98.00%, 10=0.64%, >=2000=1.35%
  cpu          : usr=0.01%, sys=0.27%, ctx=11, majf=0, minf=413
  IO depths    : 1=0.1%, 2=0.1%, 4=0.1%, 8=0.1%, 16=0.2%, 32=0.3%, >=64=99.3%
     submit    : 0=0.0%, 4=100.0%, 8=0.0%, 16=0.0%, 32=0.0%, 64=0.0%, >=64=0.0%
     complete  : 0=0.0%, 4=100.0%, 8=0.0%, 16=0.0%, 32=0.0%, 64=0.0%, >=64=0.1%
     issued    : total=r=28298/w=0/d=0, short=r=0/w=0/d=0, drop=r=0/w=0/d=0
     latency   : target=0, window=0, percentile=100.00%, depth=128

Run status group 0 (all jobs):
   READ: io=113192KB, aggrb=2023KB/s, minb=2023KB/s, maxb=2023KB/s, mint=55938msec, maxt=55938msec

Code:
# random write - froze server
fio --time_based --name=benchmark --size=10G --runtime=30 --filename=/DT3btrfs/test --ioengine=libaio --randrepeat=0 --iodepth=128 --invalidate=1 --verify=0 --verify_fatal=0 --numjobs=4 --rw=randwrite --blocksize=4k --group_reporting

NO RESULTS I had to reboot the server


FIO on system storage SSD:
Code:
# full write pass -  froze server and I had to do restart after it finaly failed/finished to get stuck server back to life
fio --name=writefile --size=10G --filesize=10G --filename=/tmp/test --bs=1M --nrfiles=1 --sync=0 --randrepeat=0 --rw=write --refill_buffers --end_fsync=1 --iodepth=200 --ioengine=libaio

fio: job 'writefile' (state=5) hasn't exited in 300 seconds, it appears to be stuck. Doing forceful exit of this job.

writefile: (groupid=0, jobs=1): err= 0: pid=19277: Mon Dec 25 22:45:22 2017
    lat (msec) : 100=31.79%, 250=41.79%, >=2000=13.18%
  cpu          : usr=0.00%, sys=0.00%, ctx=0, majf=0, minf=0
  IO depths    : 1=0.1%, 2=0.1%, 4=0.3%, 8=0.5%, 16=1.1%, 32=2.1%, >=64=95.8%
     submit    : 0=0.0%, 4=100.0%, 8=0.0%, 16=0.0%, 32=0.0%, 64=0.0%, >=64=0.0%
     complete  : 0=0.0%, 4=100.0%, 8=0.0%, 16=0.0%, 32=0.0%, 64=0.0%, >=64=0.0%
     issued    : total=r=0/w=1510/d=0, short=r=0/w=0/d=0, drop=r=0/w=0/d=0
     latency   : target=0, window=0, percentile=100.00%, depth=200

Run status group 0 (all jobs):


Code:
# random read - server froze, restart needed
fio --time_based --name=benchmark --size=10G --runtime=30 --filename=/tmp/test --ioengine=libaio --randrepeat=0 --iodepth=128 --invalidate=1 --verify=0 --verify_fatal=0 --numjobs=4 --rw=randread --blocksize=4k --group_reporting


Code:
# random write - didn't test because server didn't came up after last reset, I will have to go manually check it out.
fio --time_based --name=benchmark --size=10G --runtime=30 --filename=/tmp/test --ioengine=libaio --randrepeat=0 --iodepth=128 --invalidate=1 --verify=0 --verify_fatal=0 --numjobs=4 --rw=randwrite --blocksize=4k --group_reporting


Still lot of hang tasks after this tests
(proxmox_ct_stat, disk are consul monitoring tasks and yes I tested everything without consul running with same results...)
hangs.PNG

and because Proxmox stops responding during these test I do not have any graphs but Server load looks fun...

server_load2.PNG

Just to add: frozen server dosn't describe problem well, during high loads I can still connect to QEMU powered VM's (with virtIO disk) without problem and they are stored on same pool so it's not like the whole server will hang, some parts are still running OK and some parts are just blocked by something.
 
@czechsys @manu I do not know why I didn't though about it before but I had idea to actually test speed from inside container VM/CT and what ever test I do from inside of container they are exactly what I would assume speed should be on this system:
Code:
 # dd if=/dev/zero of=/tmp/test bs=1G count=10
10+0 records in
10+0 records out
10737418240 bytes (11 GB, 10 GiB) copied, 5.51846 s, 1.9 GB/s

Code:
# full write pass
# fio --name=writefile --size=10G --filesize=5G --filename=/tmp/test --bs=1M --nrfiles=1 --sync=0 --randrepeat=0 --rw=write --refill_buffers --end_fsync=1 --iodepth=200 --ioengine=libaio
writefile: (g=0): rw=write, bs=1M-1M/1M-1M/1M-1M, ioengine=libaio, iodepth=200
fio-2.2.10
Starting 1 process
Jobs: 1 (f=1): [W(1)] [97.1% done] [0KB/119.0MB/0KB /s] [0/119/0 iops] [eta 00m:01s]
writefile: (groupid=0, jobs=1): err= 0: pid=6071: Tue Dec 26 00:30:57 2017
  write: io=5120.0MB, bw=163999KB/s, iops=160, runt= 31969msec
    slat (usec): min=164, max=1281.3K, avg=5964.65, stdev=57445.54
    clat (usec): min=9, max=2276.1K, avg=1235907.78, stdev=443705.49
     lat (msec): min=75, max=2277, avg=1241.87, stdev=444.65
    clat percentiles (msec):
     |  1.00th=[   89],  5.00th=[  338], 10.00th=[  668], 20.00th=[  865],
     | 30.00th=[ 1020], 40.00th=[ 1188], 50.00th=[ 1270], 60.00th=[ 1385],
     | 70.00th=[ 1516], 80.00th=[ 1598], 90.00th=[ 1778], 95.00th=[ 1926],
     | 99.00th=[ 2180], 99.50th=[ 2180], 99.90th=[ 2180], 99.95th=[ 2180],
     | 99.99th=[ 2278]
    bw (KB  /s): min=26496, max=290935, per=98.13%, avg=160932.67, stdev=53362.54
    lat (usec) : 10=0.02%
    lat (msec) : 100=1.29%, 250=2.60%, 500=2.62%, 750=4.57%, 1000=17.70%
    lat (msec) : 2000=69.36%, >=2000=1.86%
  cpu          : usr=3.68%, sys=3.94%, ctx=449, majf=3, minf=11
  IO depths    : 1=0.1%, 2=0.1%, 4=0.1%, 8=0.2%, 16=0.3%, 32=0.6%, >=64=98.8%
     submit    : 0=0.0%, 4=100.0%, 8=0.0%, 16=0.0%, 32=0.0%, 64=0.0%, >=64=0.0%
     complete  : 0=0.0%, 4=100.0%, 8=0.0%, 16=0.0%, 32=0.0%, 64=0.0%, >=64=0.1%
     issued    : total=r=0/w=5120/d=0, short=r=0/w=0/d=0, drop=r=0/w=0/d=0
     latency   : target=0, window=0, percentile=100.00%, depth=200

Run status group 0 (all jobs):
  WRITE: io=5120.0MB, aggrb=163998KB/s, minb=163998KB/s, maxb=163998KB/s, mint=31969msec, maxt=31969msec


# rand read
# fio --time_based --name=benchmark --size=5G --runtime=30 --filename=/tmp/test --ioengine=libaio --randrepeat=0 --iodepth=128 --invalidate=1 --verify=0 --verify_fatal=0 --numjobs=4 --rw=randread --blocksize=4k --group_reporting
benchmark: (g=0): rw=randread, bs=4K-4K/4K-4K/4K-4K, ioengine=libaio, iodepth=128
...
fio-2.2.10
Starting 4 processes
Jobs: 4 (f=4): [r(4)] [100.0% done] [170.4MB/0KB/0KB /s] [43.6K/0/0 iops] [eta 00m:00s]
benchmark: (groupid=0, jobs=4): err= 0: pid=6909: Tue Dec 26 00:38:02 2017
  read : io=5120.9MB, bw=174785KB/s, iops=43696, runt= 30001msec
    slat (usec): min=2, max=103136, avg=88.27, stdev=1529.72
    clat (usec): min=2, max=109531, avg=11625.34, stdev=16403.95
     lat (usec): min=37, max=109573, avg=11713.78, stdev=16457.65
    clat percentiles (msec):
     |  1.00th=[    5],  5.00th=[    5], 10.00th=[    6], 20.00th=[    6],
     | 30.00th=[    6], 40.00th=[    6], 50.00th=[    6], 60.00th=[    6],
     | 70.00th=[    6], 80.00th=[    7], 90.00th=[   53], 95.00th=[   58],
     | 99.00th=[   63], 99.50th=[   64], 99.90th=[   71], 99.95th=[   72],
     | 99.99th=[  110]
    bw (KB  /s): min=29040, max=51264, per=24.99%, avg=43681.06, stdev=3024.31
    lat (usec) : 4=0.01%, 50=0.01%, 100=0.01%, 250=0.01%, 500=0.01%
    lat (usec) : 750=0.01%, 1000=0.01%
    lat (msec) : 2=0.01%, 4=0.35%, 10=87.99%, 20=0.06%, 50=0.18%
    lat (msec) : 100=11.39%, 250=0.02%
  cpu          : usr=1.54%, sys=47.18%, ctx=2565, majf=0, minf=545
  IO depths    : 1=0.1%, 2=0.1%, 4=0.1%, 8=0.1%, 16=0.1%, 32=0.1%, >=64=100.0%
     submit    : 0=0.0%, 4=100.0%, 8=0.0%, 16=0.0%, 32=0.0%, 64=0.0%, >=64=0.0%
     complete  : 0=0.0%, 4=100.0%, 8=0.0%, 16=0.0%, 32=0.0%, 64=0.0%, >=64=0.1%
     issued    : total=r=1310930/w=0/d=0, short=r=0/w=0/d=0, drop=r=0/w=0/d=0
     latency   : target=0, window=0, percentile=100.00%, depth=128

Run status group 0 (all jobs):
   READ: io=5120.9MB, aggrb=174784KB/s, minb=174784KB/s, maxb=174784KB/s, mint=30001msec, maxt=30001msec


# rand write
# fio --time_based --name=benchmark --size=5G --runtime=30 --filename=/tmp/test --ioengine=libaio --randrepeat=0 --iodepth=128 --invalidate=1 --verify=0 --verify_fatal=0 --numjobs=4 --rw=randwrite --blocksize=4k --group_reporting
benchmark: (g=0): rw=randwrite, bs=4K-4K/4K-4K/4K-4K, ioengine=libaio, iodepth=128
...
fio-2.2.10
Starting 4 processes
Jobs: 4 (f=4): [w(4)] [100.0% done] [0KB/1632KB/0KB /s] [0/408/0 iops] [eta 00m:00s]
benchmark: (groupid=0, jobs=4): err= 0: pid=7075: Tue Dec 26 00:39:19 2017
  write: io=101536KB, bw=3339.1KB/s, iops=834, runt= 30401msec
    slat (usec): min=7, max=879364, avg=4788.13, stdev=51189.51
    clat (usec): min=8, max=1712.2K, avg=607666.87, stdev=322294.78
     lat (msec): min=4, max=1712, avg=612.46, stdev=324.92
    clat percentiles (msec):
     |  1.00th=[  165],  5.00th=[  200], 10.00th=[  215], 20.00th=[  338],
     | 30.00th=[  420], 40.00th=[  465], 50.00th=[  562], 60.00th=[  627],
     | 70.00th=[  717], 80.00th=[  848], 90.00th=[ 1057], 95.00th=[ 1237],
     | 99.00th=[ 1565], 99.50th=[ 1598], 99.90th=[ 1713], 99.95th=[ 1713],
     | 99.99th=[ 1713]
    bw (KB  /s): min=  368, max= 2357, per=25.03%, avg=835.84, stdev=380.20
    lat (usec) : 10=0.02%
    lat (msec) : 10=0.43%, 250=14.69%, 500=28.28%, 750=31.74%, 1000=12.78%
    lat (msec) : 2000=12.07%
  cpu          : usr=0.04%, sys=1.11%, ctx=862, majf=0, minf=42
  IO depths    : 1=0.1%, 2=0.1%, 4=0.1%, 8=0.1%, 16=0.3%, 32=0.5%, >=64=99.0%
     submit    : 0=0.0%, 4=100.0%, 8=0.0%, 16=0.0%, 32=0.0%, 64=0.0%, >=64=0.0%
     complete  : 0=0.0%, 4=100.0%, 8=0.0%, 16=0.0%, 32=0.0%, 64=0.0%, >=64=0.1%
     issued    : total=r=0/w=25384/d=0, short=r=0/w=0/d=0, drop=r=0/w=0/d=0
     latency   : target=0, window=0, percentile=100.00%, depth=128

Run status group 0 (all jobs):
  WRITE: io=101536KB, aggrb=3339KB/s, minb=3339KB/s, maxb=3339KB/s, mint=30401msec, maxt=30401msec

That would also explain why server never experiences these slowdown in normal usage and why I didn't recognize any of these problems during testing, because I always test VMs itself expecting that host should never perform slower than guests.

So right now my findings are that any hight IO on host will result in system freezing where as high IO on guests is handled as expected, which is weird to me but it goes out of my knowledge so I hope someone will have any Idea why it's happening.
 
Last edited:
Ok back to some another tests
Command:
Code:
rsync -r --progress /DP1/backups/ /DT3btrfs/backups/

Will cause system to start hanging (as usually) within 10 seconds after launch, I have to kill it pretty quickly.

sdd & sde are main data SSD (where data are copied from)

sdf & sdg are system SSD

sda & sdb are test HDD (to where rsync should copy data)

rsync starts at second mesurment

Code:
iostat -x -d 2
Linux 4.13.13-2-pve (klaas)     01/03/2018      _x86_64_        (16 CPU)

Device:         rrqm/s   wrqm/s     r/s     w/s    rkB/s    wkB/s avgrq-sz avgqu-sz   await r_await w_await  svctm  %util
loop0             0.00     0.00    0.04    2.00     0.17   869.78   850.88     0.01    4.13    5.71    4.10   1.46   0.30
sda               0.00     0.00    0.00    0.00     0.00     0.00    40.94     0.00    2.98    2.98    0.00   1.96   0.00
sdb               0.00     0.00    0.00    0.00     0.00     0.00    40.94     0.00    3.58    3.58    0.00   2.96   0.00
sdc               0.00     2.00    0.02    0.71     0.26   108.82   297.28     0.02   22.87    7.26   23.33   9.11   0.67
sdd               0.00     0.01   12.79   39.53   794.05   645.26    55.02     0.02    0.29    0.71    0.15   0.19   0.99
sde               0.00     0.00   12.80   39.00   794.16   645.26    55.58     0.02    0.30    0.72    0.17   0.20   1.04
sdf               0.00     0.00    0.88   10.16    10.27   139.85    27.22     0.13   11.66    4.42   12.28   5.96   6.57
sdg               0.00     0.00    0.89   10.39    10.32   139.85    26.63     0.14   12.53    4.38   13.24   6.41   7.23
zd0               0.00     0.00    0.04    0.24     0.16     0.94     8.00     0.02   87.75    5.03  101.71  35.04   0.97
zd16              0.00     0.00    0.33    0.46     2.82     8.71    28.95     0.00    1.17    0.28    1.80   0.11   0.01
zd32              0.00     0.00    0.03    5.96     0.77    88.80    29.88     0.00    0.19    0.31    0.18   0.02   0.01

Device:         rrqm/s   wrqm/s     r/s     w/s    rkB/s    wkB/s avgrq-sz avgqu-sz   await r_await w_await  svctm  %util
loop0             0.00     0.00    0.00    0.50     0.00     2.00     8.00     0.00    0.00    0.00    0.00   0.00   0.00
sda               0.00     0.00    0.00    0.00     0.00     0.00     0.00     0.00    0.00    0.00    0.00   0.00   0.00
sdb               0.00     0.00    0.00    0.00     0.00     0.00     0.00     0.00    0.00    0.00    0.00   0.00   0.00
sdc               0.00     0.50    0.00    1.00     0.00     6.00    12.00     0.01    6.00    0.00    6.00   6.00   0.60
sdd               0.00     0.00   17.50   16.50    24.00   162.00    10.94     0.01    0.35    0.69    0.00   0.35   1.20
sde               0.00     0.00   16.50   16.50    18.00   162.00    10.91     0.01    0.30    0.61    0.00   0.30   1.00
sdf               0.00     0.50    0.50    2.50     0.00    22.00    14.67     2.70  754.67  792.00  747.20 333.33 100.00
sdg               0.00     0.00    2.50    3.00     8.00    30.00    13.82     0.39   73.45  128.00   28.00  35.64  19.60
zd0               0.00     0.00    0.00    1.50     0.00     6.00     8.00     3.99  728.00    0.00  728.00 666.67 100.00
zd16              0.00     0.00    0.00    0.00     0.00     0.00     0.00     0.00    0.00    0.00    0.00   0.00   0.00
zd32              0.00     0.00    0.00    0.00     0.00     0.00     0.00     0.00    0.00    0.00    0.00   0.00   0.00

Device:         rrqm/s   wrqm/s     r/s     w/s    rkB/s    wkB/s avgrq-sz avgqu-sz   await r_await w_await  svctm  %util
loop0             0.00     0.00    0.00    0.00     0.00     0.00     0.00     0.00    0.00    0.00    0.00   0.00   0.00
sda               0.00     0.00    0.00    0.00     0.00     0.00     0.00     0.00    0.00    0.00    0.00   0.00   0.00
sdb               0.00     0.00    0.00    0.00     0.00     0.00     0.00     0.00    0.00    0.00    0.00   0.00   0.00
sdc               0.00     0.00    0.00    0.00     0.00     0.00     0.00     0.00    0.00    0.00    0.00   0.00   0.00
sdd               0.00     0.00   20.50    6.00  1566.00   104.00   126.04     0.01    0.30    0.39    0.00   0.23   0.60
sde               0.00     0.00   20.00    6.00  1690.00   104.00   138.00     0.01    0.46    0.40    0.67   0.38   1.00
sdf               0.00     0.50   13.50   44.50    10.00   646.00    22.62     2.93   68.03   78.67   64.81  16.97  98.40
sdg               0.50     0.50   19.00   44.00    40.00   630.00    21.27     2.85   44.41   34.74   48.59  15.24  96.00
zd0               0.00     0.00    0.00   11.00     0.00    44.00     8.00     2.59  375.45    0.00  375.45  91.09 100.20
zd16              0.00     0.00    0.00    0.00     0.00     0.00     0.00     0.00    0.00    0.00    0.00   0.00   0.00
zd32              0.00     0.00    0.00    4.00     0.00    32.00    16.00     0.00    0.00    0.00    0.00   0.00   0.00

Device:         rrqm/s   wrqm/s     r/s     w/s    rkB/s    wkB/s avgrq-sz avgqu-sz   await r_await w_await  svctm  %util
loop0             0.00     0.00    0.00    0.00     0.00     0.00     0.00     0.00    0.00    0.00    0.00   0.00   0.00
sda               0.00     0.00    0.00    0.00     0.00     0.00     0.00     0.00    0.00    0.00    0.00   0.00   0.00
sdb               0.00     0.00    0.00    0.00     0.00     0.00     0.00     0.00    0.00    0.00    0.00   0.00   0.00
sdc               0.00     0.00    0.00    0.00     0.00     0.00     0.00     0.00    0.00    0.00    0.00   0.00   0.00
sdd               0.00     0.00   61.00  117.00  7028.00  3236.00   115.33     0.04    0.25    0.49    0.12   0.19   3.40
sde               0.00     0.00   40.00   84.00  4680.00  3236.00   127.68     0.07    0.55    1.20    0.24   0.40   5.00
sdf               0.00     0.50    7.00    9.50    78.00   852.00   112.73     3.64  222.18  147.71  277.05  60.61 100.00
sdg               0.00     0.00    7.00   15.50    32.00  1556.00   141.16     2.89  121.60   59.71  149.55  44.44 100.00
zd0               0.00     0.00    0.00   21.00     0.00    84.00     8.00    19.72 2074.95    0.00 2074.95  47.62 100.00
zd16              0.00     0.00    0.00    1.00     0.00     4.00     8.00     0.00    0.00    0.00    0.00   0.00   0.00
zd32              0.00     0.00    0.00    0.00     0.00     0.00     0.00     0.00    0.00    0.00    0.00   0.00   0.00

Device:         rrqm/s   wrqm/s     r/s     w/s    rkB/s    wkB/s avgrq-sz avgqu-sz   await r_await w_await  svctm  %util
loop0             0.00     0.00    0.00    1.00     0.00     4.00     8.00     0.00    0.00    0.00    0.00   0.00   0.00
sda               0.00     0.00    0.00    0.00     0.00     0.00     0.00     0.00    0.00    0.00    0.00   0.00   0.00
sdb               0.00     0.00    0.00    0.00     0.00     0.00     0.00     0.00    0.00    0.00    0.00   0.00   0.00
sdc               0.00     0.50    0.00    1.50     0.00     8.00    10.67     0.02   13.33    0.00   13.33  13.33   2.00
sdd               0.00     0.00   10.50    4.00   832.00    50.00   121.66     0.01    0.41    0.57    0.00   0.28   0.40
sde               0.00     0.00    8.50    4.00   576.00    50.00   100.16     0.02    1.28    0.94    2.00   1.12   1.40
sdf               0.00     2.00    5.50   11.50    12.00  1534.00   181.88     2.76  160.59  110.18  184.70  58.82 100.00
sdg               0.00     1.50    6.00   13.00    48.00  1622.00   175.79     2.86  156.42  107.67  178.92  52.63 100.00
zd0               0.00     0.00    4.00   34.50    16.00   138.00     8.00    22.63  692.10  120.00  758.43  25.97 100.00
zd16              0.00     0.00    0.00    0.00     0.00     0.00     0.00     0.00    0.00    0.00    0.00   0.00   0.00
zd32              0.00     0.00    0.00    0.00     0.00     0.00     0.00     0.00    0.00    0.00    0.00   0.00   0.00

Device:         rrqm/s   wrqm/s     r/s     w/s    rkB/s    wkB/s avgrq-sz avgqu-sz   await r_await w_await  svctm  %util
loop0             0.00     0.00    0.00    0.00     0.00     0.00     0.00     0.00    0.00    0.00    0.00   0.00   0.00
sda               0.00     0.00    0.00    0.00     0.00     0.00     0.00     0.00    0.00    0.00    0.00   0.00   0.00
sdb               0.00     0.00    0.00    0.00     0.00     0.00     0.00     0.00    0.00    0.00    0.00   0.00   0.00
sdc               0.00     0.00    0.00    0.00     0.00     0.00     0.00     0.00    0.00    0.00    0.00   0.00   0.00
sdd               0.00     0.00    5.50   17.00     4.00   378.00    33.96     0.00    0.09    0.36    0.00   0.09   0.20
sde               0.00     0.00    7.50    6.50    42.00    98.00    20.00     0.01    0.71    0.53    0.92   0.57   0.80
sdf               0.00     1.00    7.50   11.00    28.00  1384.00   152.65     3.16  152.65  105.60  184.73  54.05 100.00
sdg               0.00     0.50    4.00    8.00    16.00   976.00   165.33     3.36  208.00  192.50  215.75  83.33 100.00
zd0               0.00     0.00    7.00   17.50    28.00    70.00     8.00    25.68  592.65  231.71  737.03  40.82 100.00
zd16              0.00     0.00    0.00    3.50     0.00    14.00     8.00     0.00    0.00    0.00    0.00   0.00   0.00
zd32              0.00     0.00    0.00    0.00     0.00     0.00     0.00     0.00    0.00    0.00    0.00   0.00   0.00

Device:         rrqm/s   wrqm/s     r/s     w/s    rkB/s    wkB/s avgrq-sz avgqu-sz   await r_await w_await  svctm  %util
loop0             0.00     0.00    0.00    0.50     0.00     2.00     8.00     0.00    0.00    0.00    0.00   0.00   0.00
sda               0.00     0.00    0.00    0.00     0.00     0.00     0.00     0.00    0.00    0.00    0.00   0.00   0.00
sdb               0.00     0.00    0.00    0.00     0.00     0.00     0.00     0.00    0.00    0.00    0.00   0.00   0.00
sdc               0.00     0.50    0.00    1.00     0.00     6.00    12.00     0.01   10.00    0.00   10.00  10.00   1.00
sdd               0.00     0.00    3.00   66.50    14.00  1308.00    38.04     0.01    0.17    1.33    0.12   0.12   0.80
sde               0.00     0.00    2.50   57.00     0.00  1588.00    53.38     0.01    0.24    1.60    0.18   0.17   1.00
sdf               0.00     0.00    1.50    1.00     6.00   128.00   107.20     3.27 1056.80 1004.00 1136.00 400.00 100.00
sdg               0.00     0.00    0.00    0.50     0.00    64.00   256.00     3.62 2176.00    0.00 2176.00 2000.00 100.00
zd0               0.00     0.00    0.00    0.00     0.00     0.00     0.00    25.00    0.00    0.00    0.00   0.00 100.00
zd16              0.00     0.00    0.00    0.00     0.00     0.00     0.00     0.00    0.00    0.00    0.00   0.00   0.00
zd32              0.00     0.00    0.00    0.00     0.00     0.00     0.00     0.00    0.00    0.00    0.00   0.00   0.00

Does anybody have any Idea why are System SSD hammered with data (utilization 100%) during data transfers on another drives? That also explains why is Proxmox not responding but VM's on another drives are. As stated before, this is not only rsync problem, cp, vzdump etc. will cause this as well. Also zd0 (SWAP seems to be maxed out as well)


I then tried to turn SWAP completely off by
Code:
swapoff -a
And waited until it move itself to RAM, run rsync again, but same result:
Code:
iostat -x -d 2
Linux 4.13.13-2-pve (klaas)     01/03/2018      _x86_64_        (16 CPU)

Device:         rrqm/s   wrqm/s     r/s     w/s    rkB/s    wkB/s avgrq-sz avgqu-sz   await r_await w_await  svctm  %util
loop0             0.00     0.00    0.04    2.00     0.17   868.63   849.25     0.01    4.14    5.71    4.11   1.46   0.30
sda               0.00     0.00    0.00    0.00     0.00     0.00    40.54     0.00    3.07    3.07    0.00   2.06   0.00
sdb               0.00     0.00    0.00    0.00     0.00     0.00    40.54     0.00    3.68    3.68    0.00   3.07   0.00
sdc               0.00     2.02    0.02    0.71     0.26   109.00   297.58     0.02   22.91    7.28   23.38   9.11   0.67
sdd               0.00     0.01   12.79   39.52   792.78   645.93    55.01     0.02    0.29    0.71    0.15   0.19   0.99
sde               0.00     0.00   12.79   38.99   792.89   645.93    55.58     0.02    0.30    0.72    0.17   0.20   1.04
sdf               0.00     0.00    0.93   10.15    10.49   140.09    27.18     0.13   11.94    4.79   12.60   6.05   6.71
sdg               0.00     0.00    0.97   10.38    10.61   140.09    26.56     0.15   12.77    4.65   13.53   6.48   7.36
zd0               0.00     0.00    0.25    0.25     1.00     1.01     8.00     0.07  130.44    1.34  258.91  22.59   1.13
zd16              0.00     0.00    0.33    0.46     2.81     8.70    28.93     0.00    1.17    0.28    1.80   0.11   0.01
zd32              0.00     0.00    0.03    5.97     0.77    89.31    30.01     0.00    0.19    0.31    0.19   0.03   0.02

Device:         rrqm/s   wrqm/s     r/s     w/s    rkB/s    wkB/s avgrq-sz avgqu-sz   await r_await w_await  svctm  %util
loop0             0.00     0.00    0.00    0.00     0.00     0.00     0.00     0.00    0.00    0.00    0.00   0.00   0.00
sda               0.00     0.00    0.00    0.00     0.00     0.00     0.00     0.00    0.00    0.00    0.00   0.00   0.00
sdb               0.00     0.00    0.00    0.00     0.00     0.00     0.00     0.00    0.00    0.00    0.00   0.00   0.00
sdc               0.00     0.00    0.00    0.00     0.00     0.00     0.00     0.00    0.00    0.00    0.00   0.00   0.00
sdd               0.00     0.00  469.00   53.00 59326.00  1162.00   231.75     0.32    0.62    0.68    0.04   0.48  25.00
sde               0.00     0.00  448.50   53.50 56104.00  1162.00   228.15     0.29    0.59    0.65    0.04   0.48  24.20
sdf               0.00     0.00    1.50    1.50     8.00   192.00   133.33     3.16  836.00  697.33  974.67 332.67  99.80
sdg               0.00     0.00    4.00    7.50   152.00   904.00   183.65     2.70  172.17  135.50  191.73  86.78  99.80
zd0               0.00     0.00    0.00    0.00     0.00     0.00     0.00     0.00    0.00    0.00    0.00   0.00   0.00
zd16              0.00     0.00    0.00    1.50     0.00     6.00     8.00     0.00    0.00    0.00    0.00   0.00   0.00
zd32              0.00     0.00    0.00    1.00     0.00     4.00     8.00     0.00    0.00    0.00    0.00   0.00   0.00

Device:         rrqm/s   wrqm/s     r/s     w/s    rkB/s    wkB/s avgrq-sz avgqu-sz   await r_await w_await  svctm  %util
loop0             0.00     0.00    0.00    0.50     0.00     2.00     8.00     0.00    0.00    0.00    0.00   0.00   0.00
sda               0.00     0.00    0.00    0.00     0.00     0.00     0.00     0.00    0.00    0.00    0.00   0.00   0.00
sdb               0.00     0.00    0.00    0.00     0.00     0.00     0.00     0.00    0.00    0.00    0.00   0.00   0.00
sdc               0.00     0.00    0.00    0.00     0.00     0.00     0.00     0.00    0.00    0.00    0.00   0.00   0.00
sdd               0.00     0.00    1.50    1.00     8.00    20.00    22.40     0.00    0.80    1.33    0.00   0.80   0.20
sde               0.00     0.00    4.00    1.00    16.00    20.00    14.40     0.00    0.40    0.50    0.00   0.40   0.20
sdf               0.00     0.00    3.00    2.00    74.00    80.00    61.60     3.29  723.20  429.33 1164.00 200.00 100.00
sdg               0.00     0.00    4.50    3.50   134.00   236.00    92.50     3.55  541.00  381.33  746.29 125.00 100.00
zd0               0.00     0.00    0.00    0.00     0.00     0.00     0.00     0.00    0.00    0.00    0.00   0.00   0.00
zd16              0.00     0.00    0.00    0.00     0.00     0.00     0.00     0.00    0.00    0.00    0.00   0.00   0.00
zd32              0.00     0.00    0.00    0.00     0.00     0.00     0.00     0.00    0.00    0.00    0.00   0.00   0.00
Just this time without swapping obviously.
 

About

The Proxmox community has been around for many years and offers help and support for Proxmox VE, Proxmox Backup Server, and Proxmox Mail Gateway.
We think our community is one of the best thanks to people like you!

Get your subscription!

The Proxmox team works very hard to make sure you are running the best software and getting stable updates and security enhancements, as well as quick enterprise support. Tens of thousands of happy customers have a Proxmox subscription. Get yours easily in our online shop.

Buy now!