I have read all the forum posts related to slow GC. I have to bring this topic up again and ask for help.
I use PBS 2.3-2. The work of the disk subsystem does not cause any complaints.
Carried out the tests:
1) with copying a single huge file.
2) unpacking their documents from the archive to simulate working with a mass of files and folders (the archive contains 6324 files in 365 folders).
3)
4)
The zpool iostat -vly 2 command shows decent speeds and indicates that ZFS is not a bottleneck when PBS is not working with it.
Technical information
NAME SIZE ALLOC FREE CKPOINT EXPANDSZ FRAG CAP DEDUP HEALTH ALTROOT
SafePlace 106T 18.7T 86.8T - - 9% 17% 1.00x ONLINE -
zfs-2.1.7-pve2
zfs-kmod-2.1.7-pve1
The ZFS disk array is based on TOSHIBA MG04ACA400E and HGST HUS726040ALE614 hard drives.
1) Tried the advice to increase the zfs_arc_max parameter
options zfs zfs_arc_max=34359738368
2) Tried the advice sync=disabled
3) Tried the advice
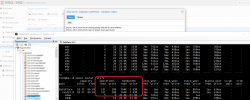
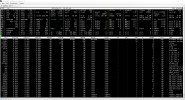
The read speed of the disk array is low (~800K), which is why the whole process takes many days.
I use PBS 2.3-2. The work of the disk subsystem does not cause any complaints.
Carried out the tests:
1) with copying a single huge file.
2) unpacking their documents from the archive to simulate working with a mass of files and folders (the archive contains 6324 files in 365 folders).
3)
Bash:
fio --filename=test --sync=1 --rw=randread --bs=4k --numjobs=1 --iodepth=4 --group_reporting --name=test --filesize=10G --runtime=300 && rm testtest: (g=0): rw=randread, bs=(R) 4096B-4096B, (W) 4096B-4096B, (T) 4096B-4096B, ioengine=psync, iodepth=4
fio-3.25
Starting 1 process
test: Laying out IO file (1 file / 10240MiB)
Jobs: 1 (f=1): [r(1)][99.3%][r=152MiB/s][r=38.9k IOPS][eta 00m:01s]
test: (groupid=0, jobs=1): err= 0: pid=177182: Tue Jan 10 13:05:56 2023
read: IOPS=18.6k, BW=72.5MiB/s (76.0MB/s)(10.0GiB/141219msec)
clat (usec): min=3, max=2613, avg=52.93, stdev=14.10
lat (usec): min=4, max=2613, avg=53.05, stdev=14.11
clat percentiles (usec):
| 1.00th=[ 6], 5.00th=[ 7], 10.00th=[ 44], 20.00th=[ 52],
| 30.00th=[ 54], 40.00th=[ 55], 50.00th=[ 56], 60.00th=[ 59],
| 70.00th=[ 61], 80.00th=[ 62], 90.00th=[ 63], 95.00th=[ 65],
| 99.00th=[ 69], 99.50th=[ 73], 99.90th=[ 79], 99.95th=[ 85],
| 99.99th=[ 145]
bw ( KiB/s): min=69424, max=195256, per=99.79%, avg=74093.16, stdev=10160.51, samples=282
iops : min=17356, max=48814, avg=18523.28, stdev=2540.13, samples=282
lat (usec) : 4=0.01%, 10=6.97%, 20=0.01%, 50=8.56%, 100=84.42%
lat (usec) : 250=0.03%, 500=0.01%
lat (msec) : 4=0.01%
cpu : usr=3.56%, sys=96.43%, ctx=262, majf=0, minf=14
IO depths : 1=100.0%, 2=0.0%, 4=0.0%, 8=0.0%, 16=0.0%, 32=0.0%, >=64=0.0%
submit : 0=0.0%, 4=100.0%, 8=0.0%, 16=0.0%, 32=0.0%, 64=0.0%, >=64=0.0%
complete : 0=0.0%, 4=100.0%, 8=0.0%, 16=0.0%, 32=0.0%, 64=0.0%, >=64=0.0%
issued rwts: total=2621440,0,0,0 short=0,0,0,0 dropped=0,0,0,0
latency : target=0, window=0, percentile=100.00%, depth=4
Run status group 0 (all jobs):
READ: bw=72.5MiB/s (76.0MB/s), 72.5MiB/s-72.5MiB/s (76.0MB/s-76.0MB/s), io=10.0GiB (10.7GB), run=141219-141219msec
4)
Bash:
fio --filename=test --sync=1 --rw=randwrite --bs=4k --numjobs=1 --iodepth=4 --group_reporting --name=test --filesize=10G --runtime=300 && rm testtest: (g=0): rw=randwrite, bs=(R) 4096B-4096B, (W) 4096B-4096B, (T) 4096B-4096B, ioengine=psync, iodepth=4
fio-3.25
Starting 1 process
test: Laying out IO file (1 file / 10240MiB)
Jobs: 1 (f=1): [w(1)][99.5%][w=113MiB/s][w=28.8k IOPS][eta 00m:01s]
test: (groupid=0, jobs=1): err= 0: pid=195942: Tue Jan 10 13:12:47 2023
write: IOPS=14.1k, BW=54.0MiB/s (57.6MB/s)(10.0GiB/186310msec); 0 zone resets
clat (usec): min=6, max=57007, avg=69.89, stdev=241.23
lat (usec): min=6, max=57007, avg=70.05, stdev=241.32
clat percentiles (usec):
| 1.00th=[ 8], 5.00th=[ 9], 10.00th=[ 10], 20.00th=[ 55],
| 30.00th=[ 63], 40.00th=[ 65], 50.00th=[ 68], 60.00th=[ 69],
| 70.00th=[ 71], 80.00th=[ 74], 90.00th=[ 78], 95.00th=[ 120],
| 99.00th=[ 184], 99.50th=[ 208], 99.90th=[ 1860], 99.95th=[ 4293],
| 99.99th=[11600]
bw ( KiB/s): min=17080, max=204976, per=99.70%, avg=56113.19, stdev=17363.36, samples=372
iops : min= 4270, max=51244, avg=14028.28, stdev=4340.83, samples=372
lat (usec) : 10=12.02%, 20=3.64%, 50=1.81%, 100=75.96%, 250=6.21%
lat (usec) : 500=0.18%, 750=0.03%, 1000=0.02%
lat (msec) : 2=0.04%, 4=0.04%, 10=0.04%, 20=0.01%, 50=0.01%
lat (msec) : 100=0.01%
cpu : usr=3.21%, sys=77.19%, ctx=229694, majf=0, minf=387
IO depths : 1=100.0%, 2=0.0%, 4=0.0%, 8=0.0%, 16=0.0%, 32=0.0%, >=64=0.0%
submit : 0=0.0%, 4=100.0%, 8=0.0%, 16=0.0%, 32=0.0%, 64=0.0%, >=64=0.0%
complete : 0=0.0%, 4=100.0%, 8=0.0%, 16=0.0%, 32=0.0%, 64=0.0%, >=64=0.0%
issued rwts: total=0,2621440,0,0 short=0,0,0,0 dropped=0,0,0,0
latency : target=0, window=0, percentile=100.00%, depth=4
Run status group 0 (all jobs):
WRITE: bw=54.0MiB/s (57.6MB/s), 54.0MiB/s-54.0MiB/s (57.6MB/s-57.6MB/s), io=10.0GiB (10.7GB), run=186310-186310msec
The zpool iostat -vly 2 command shows decent speeds and indicates that ZFS is not a bottleneck when PBS is not working with it.
Technical information
Bash:
zpool listSafePlace 106T 18.7T 86.8T - - 9% 17% 1.00x ONLINE -
Bash:
zfs versionzfs-kmod-2.1.7-pve1
The ZFS disk array is based on TOSHIBA MG04ACA400E and HGST HUS726040ALE614 hard drives.
Bash:
zpool status -v SafePlacepool: SafePlace
state: ONLINE
scan: scrub repaired 0B in 11:07:26 with 0 errors on Sun Jan 8 11:31:27 2023
config:
NAME STATE READ WRITE CKSUM
SafePlace ONLINE 0 0 0
raidz2-0 ONLINE 0 0 0
sdaa ONLINE 0 0 0
sdab ONLINE 0 0 0
sdac ONLINE 0 0 0
sdad ONLINE 0 0 0
sdb ONLINE 0 0 0
sdc ONLINE 0 0 0
sdd ONLINE 0 0 0
sde ONLINE 0 0 0
sdf ONLINE 0 0 0
sdg ONLINE 0 0 0
sdh ONLINE 0 0 0
sdi ONLINE 0 0 0
sdj ONLINE 0 0 0
sdk ONLINE 0 0 0
sdl ONLINE 0 0 0
sdm ONLINE 0 0 0
sdn ONLINE 0 0 0
sdo ONLINE 0 0 0
sdp ONLINE 0 0 0
sdq ONLINE 0 0 0
sdr ONLINE 0 0 0
sds ONLINE 0 0 0
sdt ONLINE 0 0 0
sdu ONLINE 0 0 0
sdv ONLINE 0 0 0
sdw ONLINE 0 0 0
sdx ONLINE 0 0 0
sdy ONLINE 0 0 0
sdz ONLINE 0 0 0
errors: No known data errors
Bash:
zfs get all SafePlace | grep -vF defaultNAME PROPERTY VALUE SOURCE
SafePlace type filesystem -
SafePlace creation Fri Jan 15 12:37 2021 -
SafePlace used 16.6T -
SafePlace available 77.0T -
SafePlace referenced 16.6T -
SafePlace compressratio 1.02x -
SafePlace mounted yes -
SafePlace mountpoint /mnt/datastore/SafePlace local
SafePlace compression on local
SafePlace createtxg 1 -
SafePlace version 5 -
SafePlace utf8only off -
SafePlace normalization none -
SafePlace casesensitivity sensitive -
SafePlace guid 820587276108867583 -
SafePlace usedbysnapshots 0B -
SafePlace usedbydataset 16.6T -
SafePlace usedbychildren 5.05G -
SafePlace usedbyrefreservation 0B -
SafePlace objsetid 54 -
SafePlace sync disabled local
SafePlace refcompressratio 1.02x -
SafePlace written 16.6T -
SafePlace logicalused 16.9T -
SafePlace logicalreferenced 16.9T -
Bash:
proxmox-backup-client benchmarkSHA256 speed: 218.94 MB/s
Compression speed: 227.14 MB/s
Decompress speed: 326.45 MB/s
AES256/GCM speed: 695.50 MB/s
Verify speed: 129.79 MB/s
┌───────────────────────────────────┬───────────────────┐
│ Name │ Value │
╞═══════════════════════════════════╪═══════════════════╡
│ TLS (maximal backup upload speed) │ not tested │
├───────────────────────────────────┼───────────────────┤
│ SHA256 checksum computation speed │ 218.94 MB/s (11%) │
├───────────────────────────────────┼───────────────────┤
│ ZStd level 1 compression speed │ 227.14 MB/s (30%) │
├───────────────────────────────────┼───────────────────┤
│ ZStd level 1 decompression speed │ 326.45 MB/s (27%) │
├───────────────────────────────────┼───────────────────┤
│ Chunk verification speed │ 129.79 MB/s (17%) │
├───────────────────────────────────┼───────────────────┤
│ AES256 GCM encryption speed │ 695.50 MB/s (19%) │
└───────────────────────────────────┴───────────────────┘
1) Tried the advice to increase the zfs_arc_max parameter
Bash:
cat /etc/modprobe.d/zfs.conf2) Tried the advice sync=disabled
3) Tried the advice
Bash:
sysctl -w vm.vfs_cache_pressure=50The read speed of the disk array is low (~800K), which is why the whole process takes many days.
Bash:
zpool iostat -vly 2---------- ----- ----- ----- ----- ----- ----- ----- ----- ----- ----- ----- ----- ----- ----- ----- -----
capacity operations bandwidth total_wait disk_wait syncq_wait asyncq_wait scrub trim
pool alloc free read write read write read write read write read write read write wait wait
---------- ----- ----- ----- ----- ----- ----- ----- ----- ----- ----- ----- ----- ----- ----- ----- -----
SafePlace 18.7T 86.8T 206 454 828K 2.19M 6ms 1ms 6ms 702us 1us 907ns - 589us - -
raidz2-0 18.7T 86.8T 207 454 828K 2.19M 6ms 1ms 6ms 702us 1us 907ns - 589us - -
sdaa - - 7 17 31.8K 77.6K 6ms 668us 6ms 410us 1us 960ns - 269us - -
sdab - - 5 15 23.9K 73.6K 5ms 645us 5ms 399us 1us 960ns - 220us - -
sdac - - 6 15 27.9K 71.7K 7ms 681us 7ms 399us 1us 864ns - 226us - -
sdad - - 5 14 21.9K 71.7K 7ms 734us 7ms 406us 1us 864ns - 371us - -
sdb - - 7 13 29.9K 71.7K 6ms 2ms 6ms 1ms 1us 960ns - 1ms - -
sdc - - 5 13 21.9K 73.6K 5ms 1ms 5ms 957us 1us 960ns - 398us - -
sdd - - 9 11 39.8K 65.7K 6ms 1ms 6ms 581us 1us 960ns - 533us - -
sde - - 8 10 33.8K 63.7K 7ms 969us 7ms 585us 1us 960ns - 399us - -
sdf - - 6 13 27.9K 67.7K 6ms 814us 6ms 477us 1us 864ns - 338us - -
sdg - - 5 12 23.9K 69.7K 6ms 2ms 6ms 1ms 1us 768ns - 1ms - -
sdh - - 5 12 21.9K 71.7K 8ms 1ms 8ms 648us 1us 864ns - 566us - -
sdi - - 3 14 15.9K 75.6K 6ms 1ms 6ms 1ms 1us 768ns - 703us - -
sdj - - 3 13 13.9K 73.6K 8ms 3ms 8ms 2ms 1us 960ns - 1ms - -
sdk - - 5 15 23.9K 81.6K 6ms 7ms 6ms 3ms 1us 960ns - 4ms - -
sdl - - 5 15 23.9K 75.6K 4ms 678us 4ms 386us 1us 960ns - 211us - -
sdm - - 3 16 15.9K 81.6K 7ms 693us 7ms 393us 1us 768ns - 231us - -
sdn - - 5 15 23.9K 77.6K 6ms 620us 6ms 387us 1us 960ns - 228us - -
sdo - - 6 15 27.9K 77.6K 5ms 700us 5ms 380us 1us 864ns - 239us - -
sdp - - 7 16 29.9K 79.6K 6ms 1ms 6ms 905us 1us 960ns - 209us - -
sdq - - 5 16 23.9K 81.6K 8ms 797us 8ms 381us 1us 672ns - 349us - -
sdr - - 8 18 33.8K 85.6K 6ms 827us 6ms 393us 1us 864ns - 500us - -
sds - - 8 19 33.8K 89.6K 6ms 801us 6ms 393us 1us 960ns - 473us - -
sdt - - 9 16 39.8K 87.6K 7ms 1ms 7ms 647us 1us 864ns - 820us - -
sdu - - 7 17 31.8K 81.6K 5ms 758us 5ms 387us 1us 960ns - 276us - -
sdv - - 10 15 43.8K 75.6K 5ms 724us 5ms 405us 1us 960ns - 253us - -
sdw - - 11 16 47.8K 87.6K 9ms 685us 9ms 387us 1us 1us - 297us - -
sdx - - 9 19 37.8K 93.5K 5ms 720us 5ms 383us 1us 960ns - 382us - -
sdy - - 8 17 33.8K 83.6K 6ms 688us 6ms 387us 1us 768ns - 344us - -
sdz - - 5 17 21.9K 79.6K 8ms 731us 8ms 393us 1us 960ns - 344us - -
---------- ----- ----- ----- ----- ----- ----- ----- ----- ----- ----- ----- ----- ----- ----- ----- -----
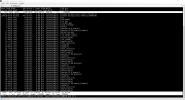
2022-12-17T12:56:39+03:00: starting garbage collection on store SafePlace
2022-12-17T12:56:39+03:00: Start GC phase1 (mark used chunks)
2022-12-17T14:22:13+03:00: marked 1% (10 of 950 index files)
2022-12-17T15:04:12+03:00: marked 2% (19 of 950 index files)
2022-12-17T15:20:03+03:00: marked 3% (29 of 950 index files)
2022-12-17T15:20:46+03:00: marked 4% (38 of 950 index files)
...
2022-12-17T20:06:23+03:00: marked 25% (238 of 950 index files)
2022-12-18T04:00:47+03:00: marked 26% (247 of 950 index files)
2022-12-18T14:23:42+03:00: marked 27% (257 of 950 index files)
2022-12-18T23:45:30+03:00: marked 28% (266 of 950 index files)
2022-12-19T08:01:16+03:00: marked 29% (276 of 950 index files)
2022-12-19T16:22:19+03:00: marked 30% (285 of 950 index files)
2022-12-19T22:58:18+03:00: marked 31% (295 of 950 index files)
2022-12-20T11:01:10+03:00: marked 32% (304 of 950 index files)
...
2022-12-20T17:39:17+03:00: marked 54% (513 of 950 index files)
2022-12-20T23:02:17+03:00: marked 55% (523 of 950 index files)
2022-12-21T06:48:41+03:00: marked 56% (532 of 950 index files)
2022-12-21T15:01:28+03:00: marked 57% (542 of 950 index files)
2022-12-21T21:15:54+03:00: marked 58% (551 of 950 index files)
2022-12-21T22:33:41+03:00: marked 59% (561 of 950 index files)
2022-12-21T22:33:43+03:00: marked 60% (570 of 950 index files)
2022-12-22T01:04:21+03:00: marked 61% (580 of 950 index files)
...
2022-12-22T19:57:12+03:00: processed 98% (7011380 chunks)
2022-12-22T19:58:25+03:00: processed 99% (7083002 chunks)
2022-12-22T19:59:39+03:00: Removed garbage: 823.654 GiB
2022-12-22T19:59:39+03:00: Removed chunks: 378489
2022-12-22T19:59:39+03:00: Original data usage: 554.098 TiB
2022-12-22T19:59:39+03:00: On-Disk usage: 15.833 TiB (2.86%)
2022-12-22T19:59:39+03:00: On-Disk chunks: 6776115
2022-12-22T19:59:39+03:00: Deduplication factor: 35.00
2022-12-22T19:59:39+03:00: Average chunk size: 2.45 MiB
2022-12-22T19:59:39+03:00: TASK OK