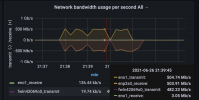
I have noticed in my syslog that during times of high throughput, I am getting this hardware hanging issue. How do I begin to troubleshoot this?

cross-posted to reddit: https://www.reddit.com/r/techsupport/comments/o8nu0m/detected_hardware_unit_hang_nic_resetting/
Code:
Jun 26 21:39:45 TracheNodeA corosync[1828]:   [KNET  ] link: host: 1 link: 1 is down
Jun 26 21:39:45 TracheNodeA corosync[1828]:   [KNET  ] host: host: 1 (passive) best link: 0 (pri: 1)
Jun 26 21:39:45 TracheNodeA kernel: e1000e 0000:00:19.0 eno1: Detected Hardware Unit Hang:
  TDH                  <49>
  TDT                  <80>
  next_to_use          <80>
  next_to_clean        <48>
buffer_info[next_to_clean]:
  time_stamp           <105c2712e>
  next_to_watch        <49>
  jiffies              <105c272c0>
  next_to_watch.status <0>
MAC Status             <80083>
PHY Status             <796d>
PHY 1000BASE-T Status  <78ff>
PHY Extended Status    <3000>
PCI Status             <10>
Jun 26 21:39:47 TracheNodeA kernel: e1000e 0000:00:19.0 eno1: Detected Hardware Unit Hang:
  TDH                  <49>
  TDT                  <80>
  next_to_use          <80>
  next_to_clean        <48>
buffer_info[next_to_clean]:
  time_stamp           <105c2712e>
  next_to_watch        <49>
  jiffies              <105c274b8>
  next_to_watch.status <0>
MAC Status             <80083>
PHY Status             <796d>
PHY 1000BASE-T Status  <7800>
PHY Extended Status    <3000>
PCI Status             <10>
Jun 26 21:39:49 TracheNodeA kernel: e1000e 0000:00:19.0 eno1: Detected Hardware Unit Hang:
  TDH                  <49>
  TDT                  <80>
  next_to_use          <80>
  next_to_clean        <48>
buffer_info[next_to_clean]:
  time_stamp           <105c2712e>
  next_to_watch        <49>
  jiffies              <105c276a8>
  next_to_watch.status <0>
MAC Status             <80083>
PHY Status             <796d>
PHY 1000BASE-T Status  <7800>
PHY Extended Status    <3000>
PCI Status             <10>
Jun 26 21:39:50 TracheNodeA kernel: e1000e 0000:00:19.0 eno1: Reset adapter unexpectedly
Jun 26 21:39:54 TracheNodeA kernel: e1000e: eno1 NIC Link is Up 1000 Mbps Full Duplex, Flow Control: Rx/Tx
cross-posted to reddit: https://www.reddit.com/r/techsupport/comments/o8nu0m/detected_hardware_unit_hang_nic_resetting/
Last edited:

