ceph high latency after Proxmox7.2 update

Oct 28, 2022
3
2
3
Hi Everybody

We have a 5 node proxmoxcluster with 800+ containers.
We finally were able to upgrade from proxmox6 to proxmox7.2 this week

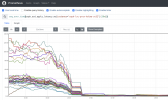
After the upgrade all 40 Ceph OSDs went from 1-2 ms latency to 30 ms and up

latency.png

The latency went up when we bootet the servers into proxmox7.2 and ceph15
upgrading to ceph16 did not change anything

Has to be the new kernel or some change in proxmox7.2
Anybody has an idea how to fix this?


SETUP INFO:
------------------
4 Nodes with 10 HDDs each
1 Node just compute
10G Networking.
Only containers running


Fabian
 
  • Like
Reactions: Sebastian Schubert
What time frame does the plot show?

Can you give some details on how your cluster is set up? What NICs do you use for example?
 
What time frame does the plot show?
serveral days


Screenshot from 2022-10-28 15-46-52.png
Here is a new one where it is visible.


We are using 10G Emulex Corporation OneConnect NIC (Skyhawk) (rev 10) cards and Juniper ex4600-40f switches.
the Ceph network is separated from the Frontend network.
Every server has 10 HDDs and two ssds. ( not all hdds have the DB/WAL on the ssds though - but this was like this since before the upgrade )


ceph status:
$ceph -s cluster: id: xxxxxxxxxxxxxxxxxxxxxx health: HEALTH_OK services: mon: 3 daemons, quorum lxc-prox3,lxc-prox2,lxc-prox1 (age 3d) mgr: lxc-prox5(active, since 3d), standbys: lxc-prox1, lxc-prox3, lxc-prox2, lxc-prox4 osd: 40 osds: 40 up (since 22h), 40 in (since 11w) data: pools: 2 pools, 1025 pgs objects: 3.98M objects, 13 TiB usage: 23 TiB used, 24 TiB / 47 TiB avail pgs: 1024 active+clean 1 active+clean+scrubbing+deep io: client: 20 MiB/s rd, 19 MiB/s wr, 1.10k op/s rd, 1.40k op/s wr

iperf looks OK as well:
iperf -c 10.40.70.2 ------------------------------------------------------------ Client connecting to 10.40.70.2, TCP port 5001 TCP window size: 325 KByte (default) ------------------------------------------------------------ [ 3] local 10.40.70.3 port 34604 connected with 10.40.70.2 port 5001 [ ID] Interval Transfer Bandwidth [ 3] 0.0000-10.0002 sec 7.44 GBytes 6.39 Gbits/sec

Tell me if you need more information


best
Fabian
 
  • Like
Reactions: Sebastian Schubert
I assume that @SpaceNet and @Sebastian Schubert are talking about the same cluster?

Do you see any retries when you run iperf / iperf3?
Do you see any errors, dropped or missed reported if you run ip --statistics a?

I don't have any experience with emulex NICs, but is the latest firmware installed? I know that this is what helps with Mellanox NICs in most situations.
 
I assume that @SpaceNet and @Sebastian Schubert are talking about the same cluster?
yes we are
Do you see any retries when you run iperf / iperf3?
yes there are some retries
# iperf3 -c 10.40.70.2 Connecting to host 10.40.70.2, port 5201 [ 5] local 10.40.70.3 port 54172 connected to 10.40.70.2 port 5201 [ ID] Interval Transfer Bitrate Retr Cwnd [ 5] 0.00-1.00 sec 880 MBytes 7.38 Gbits/sec 95 1.71 MBytes [ 5] 1.00-2.00 sec 1.09 GBytes 9.33 Gbits/sec 0 1.98 MBytes [ 5] 2.00-3.00 sec 808 MBytes 6.78 Gbits/sec 15 1.64 MBytes [ 5] 3.00-4.00 sec 832 MBytes 6.98 Gbits/sec 0 1.82 MBytes [ 5] 4.00-5.00 sec 578 MBytes 4.84 Gbits/sec 53 1.55 MBytes [ 5] 5.00-6.00 sec 681 MBytes 5.71 Gbits/sec 42 1.12 MBytes [ 5] 6.00-7.00 sec 689 MBytes 5.78 Gbits/sec 0 1.72 MBytes [ 5] 7.00-8.00 sec 1.08 GBytes 9.29 Gbits/sec 36 1.48 MBytes [ 5] 8.00-9.00 sec 880 MBytes 7.39 Gbits/sec 38 1.33 MBytes [ 5] 9.00-10.00 sec 1.07 GBytes 9.21 Gbits/sec 0 1.73 MBytes - - - - - - - - - - - - - - - - - - - - - - - - - [ ID] Interval Transfer Bitrate Retr [ 5] 0.00-10.00 sec 8.46 GBytes 7.27 Gbits/sec 279 sender [ 5] 0.00-10.04 sec 8.46 GBytes 7.24 Gbits/sec receiver
Do you see any errors, dropped or missed reported if you run ip --statistics a?
there are some dropped packets on the RX counter
RX packets 3170515540 bytes 9124893221512 (8.2 TiB) RX errors 0 dropped 81193 overruns 0 frame 0

i checked the monitoring and this was like this since before the upgrade.
I don't have any experience with emulex NICs, but is the latest firmware installed? I know that this is what helps with Mellanox NICs in most situations.
I'll have to check that.
We weren't checking into the "Hardware" side yet because all we changed was the PVE version when the problems began.


best
Fabian
 
The counters in the ip --statistics a output don't look too bad, especially in comparison with the total number of packets.

The output of the iper3 test is interesting. Was this done during production? Because the throughput varies quite a bit, from about half a GByte/s to a full Gbyte/s.
The retries would ideally be consistently down to zero.

We weren't checking into the "Hardware" side yet because all we changed was the PVE version when the problems began.
Newer kernels in combination with older firmware can sometimes lead to issues. Again, what I have seen here in the forum and the enterprise support is mainly with Mellanox NICs. Updating the firmware helps in most of those situations.
 
Could you elaborate a bit? What was the setting, and what did you change it to?
Did the latency go down to pre upgrade levels?
 
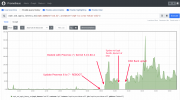
Well aparently my colleagues set the write cache to write trough and latency went away and is back at the old levels (around 16:30 the setting was changed, i smoothed the values to 30m so the chart doesnt look like a complete mess).Bildschirmfoto vom 2022-11-03 21-07-18.png
 
Thanks for the follor up :)
 

About

The Proxmox community has been around for many years and offers help and support for Proxmox VE, Proxmox Backup Server, and Proxmox Mail Gateway.
We think our community is one of the best thanks to people like you!

Get your subscription!

The Proxmox team works very hard to make sure you are running the best software and getting stable updates and security enhancements, as well as quick enterprise support. Tens of thousands of happy customers have a Proxmox subscription. Get yours easily in our online shop.

Buy now!