ballooning with windows guest issues
- Thread starter Azunai
- Start date
You are using an out of date browser. It may not display this or other websites correctly.
You should upgrade or use an alternative browser.
You should upgrade or use an alternative browser.
We're seeing this with our Windows guests too. Especially ones that have been imported from Hyper-V.
Seeing a similar issue, I have windows VM, ballooning driver installed, VM reports correct usage in proxmox that matches taskmanager inside VM. Very low I have 24GB of Max ram, used only 2GB. But host memory utilization almost matched MAX memory, and as ballooning documented trying to keep it around 80% of total host utilization. But this is not the case with linux VMs, those are consuming from the host amount of ram they use.
Is there a way to take host utilization down to "used" amount rather than keeping 80%?
Is there a way to take host utilization down to "used" amount rather than keeping 80%?

just to clarify, with "host graph" do you mean ram usage when you select a VM the used mem graph, or when you select the Host its overall mem usage is higher than allocated to VMs as min and max? (later as in OPs screenshots)
in case of Host, there are other consumers, other than VMs and CTs, like Ceph and ZFS, using host ram as cache and retract it, when needed.
in case of Host, there are other consumers, other than VMs and CTs, like Ceph and ZFS, using host ram as cache and retract it, when needed.
In my case there is no CEPH or any other consumers.
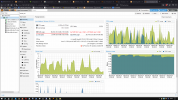
Here is what I have
I only see this with Windows VMs.
Here is what I have
- Host RAM utilization when test VM is running

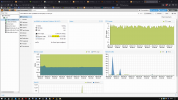
- Windows VM RAM usage

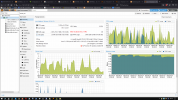
- I`ve stopped just this (102 forSergey) single VM and here is host RAM utilization

I only see this with Windows VMs.
Last edited:

There is no GlusterFS in my case, there are just GFS2 volumes, which I haven`t seen eating RAM. I also tried running it on local disk and again only windows VMs are doing this.
Here is TOP output, definitely kvm processes are using majority of memory
Here is TOP output, definitely kvm processes are using majority of memory
Code:
top - 02:57:19 up 13 days,  4:04,  1 user,  load average: 0.48, 0.62, 0.63
Tasks: 507 total,   1 running, 506 sleeping,   0 stopped,   0 zombie
%Cpu(s):  1.1 us,  0.4 sy,  0.0 ni, 98.4 id,  0.0 wa,  0.0 hi,  0.0 si,  0.0 st
MiB Mem :  64275.6 total,  11108.8 free,  51253.1 used,   1913.6 buff/cache
MiB Swap:      0.0 total,      0.0 free,      0.0 used.  12322.3 avail Mem

   PID USER      PR  NI    VIRT    RES    SHR S  %CPU  %MEM     TIME+ COMMAND
 484290 root      20   0   27.2g  18.8g  11248 S  13.6  30.0  13:21.76 kvm
   2812 root      20   0   17.7g  16.0g  12552 S   8.3  25.6   1417:02 kvm
 435927 root      20   0   10.5g   8.1g  12372 S  35.2  12.8   5796:17 kvm
   2957 root      20   0 4942268 637488  12312 S   5.0   1.0   1092:31 kvm
   1484 root      10 -10 3038492 363576  12308 S   3.3   0.6 670:52.37 ovs-vswitchd
   2150 root      rt   0  608136 214644  84276 S   1.3   0.3 675:05.10 corosync
   2402 www-data  20   0  347828 149396  26660 S   0.0   0.2   0:34.03 pveproxy
 419178 www-data  20   0  357204 137668  12712 S   0.0   0.2   0:05.75 pveproxy worker
 437772 root      20   0  357480 136832  11648 S   0.0   0.2   0:06.35 pvedaemon worke
 428258 root      20   0  357636 136688  11448 S   0.0   0.2   0:04.97 pvedaemon worke
 419179 www-data  20   0  357192 136252  11352 S   0.0   0.2   0:04.99 pveproxy worker
 504905 root      20   0  357208 135828  10868 S   0.0   0.2   0:02.35 pvedaemon worke
 546248 www-data  20   0  356456 133956  10096 S   0.0   0.2   0:00.10 pveproxy worker
   2390 root      20   0  346364 123868   2548 S   0.0   0.2   0:20.80 pvedaemon
   2398 root      20   0  331472 100300   5644 S   0.0   0.2   7:22.44 pve-ha-crm
   2798 root      20   0  330932  99748   5592 S   0.0   0.2   4:30.96 pve-ha-lrm
   3010 root      20   0  325736  98504   2384 S   0.0   0.1   1:18.80 pvescheduler
   2364 root      20   0  275148  96440  10600 S   0.0   0.1 128:53.03 pvestatd
   2362 root      20   0  271788  88204   5636 S   1.0   0.1  44:00.40 pve-firewall
   1786 root      20   0  698660  71048  56200 S   0.0   0.1  57:37.25 pmxcfs
   2407 www-data  20   0   74340  60476  11488 S   0.0   0.1   0:22.32 spiceproxy
 419176 www-data  20   0   74772  53776   4512 S   0.0   0.1   0:00.20 spiceproxy work
    676 root      20   0   64840  44172  43044 S   0.0   0.1   0:09.25 systemd-journal
   1247 root      rt   0  412656  19580   9020 S   0.0   0.0   4:30.56 multipathd
      1 root      20   0  164532  11084   7920 S   0.0   0.0   0:08.36 systemd
 548421 root      20   0   15520   9020   7384 S   0.0   0.0   0:00.08 systemd
 548417 root      20   0   14456   8696   7468 S   0.0   0.0   0:00.01 sshd
   1782 root      20   0  800724   7776   2640 S   0.0   0.0  13:06.64 rrdcached
Last edited:
sorry, misinterpretation on my side, wasn't aware of gfs2. still, i would suggest, that ram-eating is something about caches, but would like to pass the torch to someone who knows better. have to fight a node-crash my self hereThere is no GlusterFS in my case, there are just GFS2 volumes, which I haven`t seen eating RAM. I also tried running it on local disk and again only windows VMs are doing this.
Here is TOP output, definitely kvm processes are using majority of memory
top - 02:57:19 up 13 days, 4:04, 1 user, load average: 0.48, 0.62, 0.63
Tasks: 507 total, 1 running, 506 sleeping, 0 stopped, 0 zombie
%Cpu(s): 1.1 us, 0.4 sy, 0.0 ni, 98.4 id, 0.0 wa, 0.0 hi, 0.0 si, 0.0 st
MiB Mem : 64275.6 total, 11108.8 free, 51253.1 used, 1913.6 buff/cache
MiB Swap: 0.0 total, 0.0 free, 0.0 used. 12322.3 avail Mem
PID USER PR NI VIRT RES SHR S %CPU %MEM TIME+ COMMAND
484290 root 20 0 27.2g 18.8g 11248 S 13.6 30.0 13:21.76 kvm
2812 root 20 0 17.7g 16.0g 12552 S 8.3 25.6 1417:02 kvm
435927 root 20 0 10.5g 8.1g 12372 S 35.2 12.8 5796:17 kvm
2957 root 20 0 4942268 637488 12312 S 5.0 1.0 1092:31 kvm
1484 root 10 -10 3038492 363576 12308 S 3.3 0.6 670:52.37 ovs-vswitchd
2150 root rt 0 608136 214644 84276 S 1.3 0.3 675:05.10 corosync
2402 www-data 20 0 347828 149396 26660 S 0.0 0.2 0:34.03 pveproxy
419178 www-data 20 0 357204 137668 12712 S 0.0 0.2 0:05.75 pveproxy worker
437772 root 20 0 357480 136832 11648 S 0.0 0.2 0:06.35 pvedaemon worke
428258 root 20 0 357636 136688 11448 S 0.0 0.2 0:04.97 pvedaemon worke
419179 www-data 20 0 357192 136252 11352 S 0.0 0.2 0:04.99 pveproxy worker
504905 root 20 0 357208 135828 10868 S 0.0 0.2 0:02.35 pvedaemon worke
546248 www-data 20 0 356456 133956 10096 S 0.0 0.2 0:00.10 pveproxy worker
2390 root 20 0 346364 123868 2548 S 0.0 0.2 0:20.80 pvedaemon
2398 root 20 0 331472 100300 5644 S 0.0 0.2 7:22.44 pve-ha-crm
2798 root 20 0 330932 99748 5592 S 0.0 0.2 4:30.96 pve-ha-lrm
3010 root 20 0 325736 98504 2384 S 0.0 0.1 1:18.80 pvescheduler
2364 root 20 0 275148 96440 10600 S 0.0 0.1 128:53.03 pvestatd
2362 root 20 0 271788 88204 5636 S 1.0 0.1 44:00.40 pve-firewall
1786 root 20 0 698660 71048 56200 S 0.0 0.1 57:37.25 pmxcfs
2407 www-data 20 0 74340 60476 11488 S 0.0 0.1 0:22.32 spiceproxy
419176 www-data 20 0 74772 53776 4512 S 0.0 0.1 0:00.20 spiceproxy work
676 root 20 0 64840 44172 43044 S 0.0 0.1 0:09.25 systemd-journal
1247 root rt 0 412656 19580 9020 S 0.0 0.0 4:30.56 multipathd
1 root 20 0 164532 11084 7920 S 0.0 0.0 0:08.36 systemd
548421 root 20 0 15520 9020 7384 S 0.0 0.0 0:00.08 systemd
548417 root 20 0 14456 8696 7468 S 0.0 0.0 0:00.01 sshd
1782 root 20 0 800724 7776 2640 S 0.0 0.0 13:06.64 rrdcached
")


You are right, there is no passthrough. If you want to know how much RAM the KVM process is using I prefer running htop. It will also show you the parameters the process is started with, so you can see which KVM process is virtualizing which VM.
And output like tip/htop is way easier for us to read when you post it in CODE-tags so indentation and so on is kept.
And output like tip/htop is way easier for us to read when you post it in CODE-tags so indentation and so on is kept.

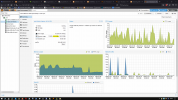
host RAM usage report allocated RAM of VM instead of used RAM of VM.
I set minimum RAM same as Max RAM and tick Ballooning.
With Windows VM , I havn't checked other guest OS.
Screenshots attached
I set minimum RAM same as Max RAM and tick Ballooning.
With Windows VM , I havn't checked other guest OS.
Screenshots attached
Attachments
Last edited:
PVE will show for the VMs RAM utiliation graph whatever the implementation of the QEMU guest agent is reporting.
For Windows VMs it will display RAM used for cache as free while with Linux VMs it will display RAM used for cache as used. So if for example a Windows VM might display "10 of 32GB used" the VM might actually use 30 of 32GB with 10GB used for processes, 20GB used for caching and only 2GB free.
A linux VM with 10GB used + 20GB cache + 2 GB free would report that 30GB are used.