15k SAS are very fast ... almost twice as fast with respect to IOPS. Also, there is enterprise firmware on board, so the slow response times regarding io error operations also also gone (if there where any).
zfs: finding the bottleneck
- Thread starter michaeljk
- Start date
You are using an out of date browser. It may not display this or other websites correctly.
You should upgrade or use an alternative browser.
You should upgrade or use an alternative browser.
Unfortunatly, 600GB SAS drives are deprecated in our datacenter, so the only choice would be a replacement of the 8x SATA + 2x SSD (ZIL) to 10x 480GB SSDs - but this solution is very pricey...
I also looked at my arcstats today and noticed high miss rates sometimes:
I guess that this is due the fact that the reserved 32GB RAM is not enough and we have to increase that? The miss rates would also explain the io utilisation on the harddrives:
By the way, we have another HP DL380p server here with a Smart Array P420i controller (1GB cache, 10% read / 90% write), configured with Proxmox 3, 4x 7200 RPM SATA disks in RAID10 and 64GB RAM. This system has almost no io delays with 22x openVZ and 15x KVM (.raw / .qcow2 files) VMs. The Dell server with ZFS has a minimum of 4-6% io delay all the time, but is configured with 8x SATA and 128GB RAM. Could the controller make such a high difference in performance? I'm really considering of using several HP systems instead of the one big ZFS server - but we have also other servers (FreeNAS, Proxmox) which are running absolutly fine with ZFS, so I don't want to give up to early ")
I also looked at my arcstats today and noticed high miss rates sometimes:
Code:
    time  read  miss  miss%  dmis  dm%  pmis  pm%  mmis  mm%  arcsz     c
16:46:26    81     0      0     0    0     0    0     0    0    31G   32G
16:46:27   324     1      0     1    0     0    0     0    0    31G   32G
16:46:28     6     2     33     2   33     0    0     0    0    31G   32G
16:46:29    79     5      6     5    6     0    0     0    0    31G   32G
16:46:30   216    20      9    20    9     0    0     6   26    31G   32G
16:46:31   296     4      1     4    1     0    0     0    0    31G   32G
16:46:32   271    11      4    11    4     0    0     1   50    31G   32G
16:46:33     8     4     50     4   50     0    0     0    0    31G   32G
16:46:34   484     3      0     3    0     0    0     0    0    31G   32G
16:46:35    19     0      0     0    0     0    0     0    0    31G   32G
16:46:36   219    10      4    10    4     0    0     3   18    31G   32G
16:46:37   393   301     76     9   10   292   96     1  100    31G   32G
16:46:38   431     5      1     3    0     2  100     0    0    31G   32G
16:46:39   118    56     47     0    0    56  100     0    0    31G   32G
16:46:40   642   117     18    15    2   102   98     5   35    31G   32G
16:46:41    71    11     15     9   13     2  100     1   20    31G   32G
16:46:42  1.3K   157     11   157   11     0    0     0    0    32G   32G
16:46:43   606    19      3    19    3     0    0     0    0    31G   32G
16:46:44   234     7      2     7    2     0    0     0    0    31G   32G
16:46:45    21     2      9     0    0     2  100     0    0    31G   32G
16:46:46   239     2      0     2    0     0    0     0    0    31G   32G
16:46:47   272    30     11    13    5    17  100     3   17    32G   32G
Code:
avg-cpu:  %user   %nice %system %iowait  %steal   %idle
           5.82    0.00    0.86    4.22    0.00   89.10

Device:         rrqm/s   wrqm/s     r/s     w/s    rkB/s    wkB/s avgrq-sz avgqu-sz   await r_await w_await  svctm  %util
sdh               0.00     0.00    0.00  191.50     0.00   930.00     9.71     1.00    5.32    0.00    5.32   5.20  99.60
sdg               0.00     0.00    0.50  176.50     4.00   810.00     9.20     0.74    4.19    8.00    4.18   4.18  74.00
sdi               0.00     0.00    1.00    0.00     6.00     0.00    12.00     0.01   12.00   12.00    0.00  12.00   1.20
sde               0.00     0.00    0.00    0.00     0.00     0.00     0.00     0.00    0.00    0.00    0.00   0.00   0.00
sdd               0.00     0.00    0.00  195.50     0.00   902.00     9.23     0.88    4.54    0.00    4.54   4.48  87.60
sdc               0.00     0.00    0.50    0.00     2.00     0.00     8.00     0.00    8.00    8.00    0.00   8.00   0.40
sdf               0.00     0.00    0.50    0.00     4.00     0.00    16.00     0.00    8.00    8.00    0.00   8.00   0.40
sdj 0.00 0.00 0.00 206.00 0.00 1014.00 9.84 1.00 4.72 0.00 4.72 4.84 99.80We watched the new system for some more days. After a fresh reboot, iostat shows between 3-10% usage for each disk, overall 0.5-0.7 wait in top. These values increase over time, today 6 out of 8 HDDs showed an usage of 100% (!), the other 2 had 30-40%, overall 15-30 wait:
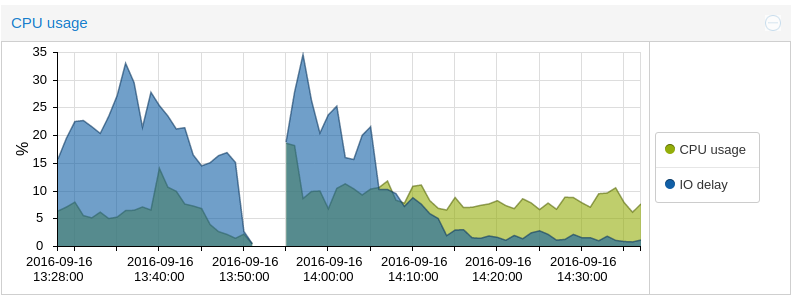
(Reboot on 13:50, start of all VMs on 13:55 - as soon as all data is loaded, I/O decreases to under 5%)
I guess that this cannot be a hardware problem, otherwise the I/O would be high at all the time and the system unusable. So main question is, why does I/O increase over time? Perhaps some of the VMs have not enough RAM and are swapping? Memory leak on Proxmox host? Any advice would be welcome...
I encountered a problem yesterday, that showed a high CPU usage of arc_prune and arc_reclaim processes. Could you please check if you have those if the I/O load is very high? That specific problem was related to a bug in ZoL (maybe even ZFS itself).
What about entries in dmesg about hanging I/O?
What about entries in dmesg about hanging I/O?
I have been using ZFS for several years now and have never seen anything like you. The only difference between me and you is that I use Solaris for ZFS so my conclusion must be a bug in ZOL.I guess that this cannot be a hardware problem, otherwise the I/O would be high at all the time and the system unusable. So main question is, why does I/O increase over time? Perhaps some of the VMs have not enough RAM and are swapping? Memory leak on Proxmox host? Any advice would be welcome..
No entries in dmesg and CPU usage looked good - the high load value results mainly because of the high I/O wait. So it seems that at some time there's no more free memory. Currently it looks like this:
Memory usage at 15:43
Memory usage at 17:21
Looks good till now, I will now record the memory sizes from time to time.
Code:
uptime
 17:17:21 up  3:24,  4 users,  load average: 1.72, 1.67, 1.69

arcstat.py
    time  read  miss  miss%  dmis  dm%  pmis  pm%  mmis  mm%  arcsz     c
17:17:53     0     0      0     0    0     0    0     0    0    39G   48G

iostat
avg-cpu:  %user   %nice %system %iowait  %steal   %idle
           3.33    0.00    2.10    0.25    0.00   94.31

Device:         rrqm/s   wrqm/s     r/s     w/s    rkB/s    wkB/s avgrq-sz avgqu-sz   await r_await w_await  svctm  %util
sde               0.00     0.00    1.50   26.50    12.00   744.00    54.00     0.03    1.00   16.00    0.15   0.79   2.20
sdi               0.00     0.00    4.00   35.50    22.00  1448.00    74.43     0.04    0.91    7.50    0.17   0.61   2.40
sdc               0.00     0.00    2.00   36.00    14.00  1448.00    76.95     0.02    0.58    9.00    0.11   0.37   1.40
sdd               0.00     0.00    0.00   25.50     0.00   650.00    50.98     0.00    0.16    0.00    0.16   0.16   0.40
sdf               0.00     0.00    1.00   27.50     8.00   744.00    52.77     0.03    1.12   24.00    0.29   0.56   1.60
sdh               0.50     0.00    1.50   17.50    14.00  1100.00   117.26     0.02    0.84    9.33    0.11   0.53   1.00
sdj               0.50     0.00    1.50   18.50    16.00  1100.00   111.60     0.03    1.50   17.33    0.22   0.90   1.80
sdg               0.00     0.00    0.00   24.50     0.00   650.00    53.06     0.01    0.41    0.00    0.41   0.24   0.60

top - 17:19:51 up  3:26,  4 users,  load average: 1.11, 1.46, 1.61
Tasks: 1857 total,   1 running, 1856 sleeping,   0 stopped,   0 zombie
%Cpu(s):  2.7 us,  1.6 sy,  0.0 ni, 95.4 id,  0.2 wa,  0.0 hi,  0.0 si,  0.0 st
KiB Mem:  13191573+total, 89328768 used, 42586964 free, 25982764 buffers
KiB Swap:  8388604 total,        0 used,  8388604 free.   102600 cached Mem
Memory usage at 15:43
Code:
             total       used       free     shared    buffers     cached
Mem:     131915736   77955020   53960716      54944   22313508     102228
-/+ buffers/cache:   55539284   76376452
Swap:      8388604          0    8388604
Memory usage at 17:21
Code:
             total       used       free     shared    buffers     cached
Mem:     131915736   90487576   41428160      54988   26475672     101552
-/+ buffers/cache:   63910352   68005384
Swap:      8388604          0    8388604
Looks good till now, I will now record the memory sizes from time to time.
Looks good till now, I will now record the memory sizes from time to time.
You can use sar or oswbb for that.
After 24 hours, the problem is here again. Reboot was on friday, 15:30 and all looked good:
Over time, memory usage increases:
And now, iostat shows again up to 4 drives with almost 100% usage:
Code:
Fri Sep 16 15:43:09 CEST 2016
             total       used       free     shared    buffers     cached
Mem:     131915736   77955020   53960716      54944   22313508     102228
-/+ buffers/cache:   55539284   76376452
Swap:      8388604          0    8388604
Over time, memory usage increases:
Code:
Fri Sep 16 16:43:17 CEST 2016
             total       used       free     shared    buffers     cached
Mem:     131915736   85831788   46083948      54988   25043016     102544
-/+ buffers/cache:   60686228   71229508
Swap:      8388604          0    8388604

Fri Sep 16 18:38:27 CEST 2016
             total       used       free     shared    buffers     cached
Mem:     131915736  103009604   28906132      54984   31243920     102488
-/+ buffers/cache:   71663196   60252540
Swap:      8388604          0    8388604

Sat Sep 17 13:30:30 CEST 2016
             total       used       free     shared    buffers     cached
Mem:     131915736  131568584     347152      45072   52636256      79004
-/+ buffers/cache:   78853324   53062412
Swap:      8388604        544    8388060
And now, iostat shows again up to 4 drives with almost 100% usage:
Code:
Sat Sep 17 16:43:24 CEST 2016
             total       used       free     shared    buffers     cached
Mem:     131915736  131505520     410216      48164   52323908      83040
-/+ buffers/cache:   79098572   52817164
Swap:      8388604        576    8388028

avg-cpu:  %user   %nice %system %iowait  %steal   %idle
           6.50    0.00    1.48    8.38    0.00   83.64

Device:         rrqm/s   wrqm/s     r/s     w/s    rkB/s    wkB/s avgrq-sz avgqu-sz   await r_await w_await  svctm  %util
sde               0.00     0.00    0.00    0.00     0.00     0.00     0.00     0.00    0.00    0.00    0.00   0.00   0.00
sdi               0.00     0.00    0.00  178.50     0.00   950.00    10.64     1.00    5.54    0.00    5.54   5.59  99.80
sdc               0.00     0.00    0.00  179.00     0.00   942.00    10.53     1.38    5.51    0.00    5.51   5.58  99.80
sdd               0.00     0.00    0.50  166.50     2.00   922.00    11.07     1.22    7.35  488.00    5.91   5.88  98.20
sdf               0.00     0.00    0.00    0.00     0.00     0.00     0.00     0.00    0.00    0.00    0.00   0.00   0.00
sdh               0.00     0.00    0.00    0.00     0.00     0.00     0.00     0.00    0.00    0.00    0.00   0.00   0.00
sdj               0.00     0.00    0.00    0.00     0.00     0.00     0.00     0.00    0.00    0.00    0.00   0.00   0.00
sdg 0.00 0.00 0.00 172.00 0.00 916.00 10.65 1.81 5.80 0.00 5.80 5.81 100.00In addition, io-wait from today:
At approx. 7:00 AM iowait raises above 3%. I recorded the values with sar each minute, which other information would be interesting for you?
Code:
06:44:41 PM     CPU     %user     %nice   %system   %iowait    %steal     %idle
07:44:43 PM     all      5.61      0.00      1.97      0.44      0.00     91.98
08:44:43 PM     all      5.22      0.00      1.99      0.48      0.00     92.31
09:44:43 PM     all      4.51      0.00      2.02      0.35      0.00     93.12
10:44:43 PM     all      4.32      0.00      2.02      0.29      0.00     93.37
11:44:43 PM     all      4.57      0.00      1.96      0.31      0.00     93.15
12:44:43 AM     all      4.27      0.00      2.01      0.53      0.00     93.19
01:44:43 AM     all      4.47      0.00      1.93      0.54      0.00     93.06
02:44:43 AM     all      4.24      0.00      1.77      0.59      0.00     93.41
03:44:43 AM     all      4.59      0.00      1.99      1.28      0.00     92.14
04:44:43 AM     all      4.67      0.00      1.89      1.57      0.00     91.87
05:44:43 AM     all      4.51      0.00      1.92      0.55      0.00     93.02
06:44:43 AM     all      4.44      0.00      1.91      1.29      0.00     92.36
07:44:43 AM     all      4.07      0.00      2.11      3.26      0.00     90.56
08:44:43 AM     all      3.87      0.00      1.80      3.40      0.00     90.94
09:44:43 AM     all      4.51      0.00      1.70      3.50      0.00     90.29
10:44:43 AM     all      4.24      0.00      1.86      2.91      0.00     90.99
11:44:43 AM     all      5.55      0.00      1.78      3.33      0.00     89.33
12:44:43 PM     all      4.63      0.00      1.78      3.02      0.00     90.57
01:44:43 PM     all      4.65      0.00      1.82      3.09      0.00     90.44
02:44:43 PM     all      4.99      0.00      1.79      3.65      0.00     89.57
03:44:43 PM     all      5.27      0.00      1.74      3.54      0.00     89.46
04:44:43 PM all 5.33 0.00 1.81 3.74 0.00 89.12I've noticed something in your "free" output. You have tons of RAM available.
For example here (use free -m, it is more readable):
There are ~52GB free. You add the ARC here (it is not accounted as "caches" in ZoL) and the VMs memory and some peanuts in the host OS and you have your 128GB.
You have 410MB free without system caches (which, again, do not include ZFS ARC in ZoL) which are quickly released in case of need.
I bet your VMs are around 35-40GB in total, so your machine has plenty of available RAM.
Do you have a top output during increased I/O latency?
For example here (use free -m, it is more readable):
Code:
Sat Sep 17 16:43:24 CEST 2016
             total       used       free     shared    buffers     cached
Mem:     131915736  131505520     410216      48164   52323908      83040
-/+ buffers/cache:   79098572   52817164
Swap:      8388604        576    8388028
There are ~52GB free. You add the ARC here (it is not accounted as "caches" in ZoL) and the VMs memory and some peanuts in the host OS and you have your 128GB.
You have 410MB free without system caches (which, again, do not include ZFS ARC in ZoL) which are quickly released in case of need.
I bet your VMs are around 35-40GB in total, so your machine has plenty of available RAM.
Do you have a top output during increased I/O latency?
Code:
top - 15:20:45 up 3 days,  1:27,  2 users,  load average: 5.81, 5.35, 5.20
Tasks: 1866 total,   1 running, 1865 sleeping,   0 stopped,   0 zombie
%Cpu(s):  3.3 us,  1.3 sy,  0.0 ni, 81.0 id, 14.4 wa,  0.0 hi,  0.0 si,  0.0 st
KiB Mem:  13191573+total, 13136350+used,   552236 free, 50927776 buffers
KiB Swap:  8388604 total,   275548 used,  8113056 free.   100404 cached Mem

   PID USER      PR  NI    VIRT    RES    SHR S  %CPU %MEM     TIME+ COMMAND
  8994 root      20   0 4652160 4.015g   3516 S  46.6  3.2   1346:21 kvm
  9728 root      20   0 4648064 4.004g   3516 S  12.9  3.2 709:41.75 kvm
  9879 root      20   0 4988052 2.081g   3528 S   8.6  1.7 144:45.64 kvm
  9467 root      20   0  711808 215692   3548 S   7.6  0.2 325:14.10 kvm
  9589 root      20   0  711808 280356   3544 S   5.9  0.2 330:27.93 kvm
  9297 root      20   0  711808 281548   3548 S   3.6  0.2 165:17.44 kvm
  9635 root      20   0  711808 279432   3556 S   3.6  0.2 155:36.71 kvm
  9261 root      20   0  982144 540228   3548 S   3.0  0.4 161:00.23 kvm
  8936 root      20   0  973952 541660   3544 S   2.6  0.4 115:28.26 kvm
  8848 root      20   0  978052 371288   3524 S   2.3  0.3 118:14.59 kvm
  9087 root      20   0  973952 541524   3540 S   2.3  0.4  94:18.39 kvm
  9179 root      20   0  720000 283748   3520 S   2.3  0.2 139:04.45 kvm
  9215 root      20   0  978052 543088   3596 S   2.3  0.4 113:48.53 kvm
  9349 root      20   0 2542720 2.013g   3544 S   2.3  1.6   1536:30 kvm
  9423 root      20   0  720000 285256   3516 S   2.3  0.2 113:31.94 kvm
  9503 root      20   0  711808 285868   3580 S   2.3  0.2 251:12.50 kvm
  8901 root      20   0  711808 282544   3536 S   2.0  0.2 127:51.58 kvm
  9041 root      20   0  711808 282932   3536 S   2.0  0.2 105:36.55 kvm
  9385 root      20   0  720000 274048   3460 S   2.0  0.2 106:45.62 kvm

free -m
             total       used       free     shared    buffers     cached
Mem:        128823     128281        542         50      49737         98
-/+ buffers/cache:      78446      50377
Swap: 8191 269 7922No, it only means ksmtuned is not running at the moment. See /etc/default/ksmtunedCode:cat /sys/kernel/mm/ksm/pages_sharing 0
So it seems that KSM is not beeing used at the moment because there's enough free memory available?
Code:
cat /etc/default/ksmtuned
# Defaults for ksmtuned initscript
# sourced by /etc/init.d/ksmtuned
# installed at /etc/default/ksmtuned by the maintainer scripts

#
# This is a POSIX shell fragment
#


# start ksmtuned at boot [yes|no]
START=yes

 ps aux |grep ksm
root        133  0.0  0.0      0     0 ?        SN   Sep16   0:00 [ksmd]
root 7717 0.0 0.0 21860 2196 ? S Sep16 0:05 /bin/bash /usr/sbin/ksmtunedSo it is running.
To stop it: systemctl stop ksmtuned.service
To prevent ksmtuned to start at next boot: START=no
To stop it: systemctl stop ksmtuned.service
To prevent ksmtuned to start at next boot: START=no
Just a short reply for this issue:
KSM_TUNED didn't fixed it, so I gave up on this and moved the virtual machines to a second host (HP Gen9 with hardware raid and LVM-thin installed). Now everything works as expected, I/O is almost always below 1%. I guess that there is some sort of hardware problem on the Dell machine, so we will check this in the next few days...
KSM_TUNED didn't fixed it, so I gave up on this and moved the virtual machines to a second host (HP Gen9 with hardware raid and LVM-thin installed). Now everything works as expected, I/O is almost always below 1%. I guess that there is some sort of hardware problem on the Dell machine, so we will check this in the next few days...
