Wrong CPU-usage
- Thread starter gosha
- Start date
You are using an out of date browser. It may not display this or other websites correctly.
You should upgrade or use an alternative browser.
You should upgrade or use an alternative browser.
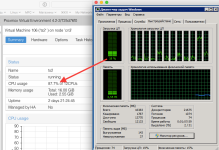
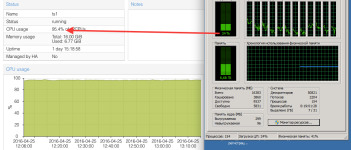
Ok.
Ok:
--
Best regards,
Gosha
Please post the complete output of
- pveversion -v
- qm config ID
Ok:
pveversion -v
proxmox-ve: 4.1-48 (running kernel: 4.4.6-1-pve)
pve-manager: 4.1-34 (running version: 4.1-34/8887b0fd)
pve-kernel-4.4.6-1-pve: 4.4.6-48
pve-kernel-4.2.6-1-pve: 4.2.6-36
pve-kernel-4.2.8-1-pve: 4.2.8-41
pve-kernel-4.2.3-2-pve: 4.2.3-22
lvm2: 2.02.116-pve2
corosync-pve: 2.3.5-2
libqb0: 1.0-1
pve-cluster: 4.0-39
qemu-server: 4.0-72
pve-firmware: 1.1-8
libpve-common-perl: 4.0-59
libpve-access-control: 4.0-16
libpve-storage-perl: 4.0-50
pve-libspice-server1: 0.12.5-2
vncterm: 1.2-1
pve-qemu-kvm: 2.5-13
pve-container: 1.0-61
pve-firewall: 2.0-25
pve-ha-manager: 1.0-28
ksm-control-daemon: 1.2-1
glusterfs-client: 3.5.2-2+deb8u1
lxc-pve: 1.1.5-7
lxcfs: 2.0.0-pve2
cgmanager: 0.39-pve1
criu: 1.6.0-1
fence-agents-pve: 4.0.20-1
balloon: 8192
boot: c
bootdisk: virtio0
cores: 6
cpu: SandyBridge
memory: 16384
name: ts1
net0: virtio=4E:5D:97:43:13:09,bridge=vmbr0
net1: virtio=C6:E3 7:6A:B3:74,bridge=vmbr2
numa: 0
ostype: win7
smbios1: uuid=a2a5f12e-51b5-4431-babf-1b4c298c890b
sockets: 2
virtio0: ceph_stor:vm-105-disk-1,cache=writeback,size=50G
virtio1: ceph_stor:vm-105-disk-2,cache=writeback,size=200G
boot: c
bootdisk: virtio0
cores: 6
cpu: SandyBridge
memory: 16384
name: ts1
net0: virtio=4E:5D:97:43:13:09,bridge=vmbr0
net1: virtio=C6:E3
numa: 0
ostype: win7
smbios1: uuid=a2a5f12e-51b5-4431-babf-1b4c298c890b
sockets: 2
virtio0: ceph_stor:vm-105-disk-1,cache=writeback,size=50G
virtio1: ceph_stor:vm-105-disk-2,cache=writeback,size=200G
--
Best regards,
Gosha
Hi,
it could be interrupts related.
This kind of cpu usage is not show inside the vm.
do you have sqlserver installed ? It's known to do lot of interrupts
Also ceph access can use lot of cpu if you do lot of iops
it could be interrupts related.
This kind of cpu usage is not show inside the vm.
do you have sqlserver installed ? It's known to do lot of interrupts
Also ceph access can use lot of cpu if you do lot of iops
Hi,
it could be interrupts related.
This kind of cpu usage is not show inside the vm.
do you have sqlserver installed ? It's known to do lot of interrupts
Also ceph access can use lot of cpu if you do lot of iops
No, sql-server not installed. This Terminal server (rdp) for diskless clients (thinstation via pxe). MS Office and web only.
On Proxmox VE 3.x and 4.x with old GUI - works properly.
This happened since the last update...
can you try to install on host :
#apt-get install linux-tools
then use the command
#perf top
to see system calls (send me the result).
Another thing to test:
add to /etc/default/grub
GRUB_CMDLINE_LINUX_DEFAULT="quiet transparent_hugepage=madvise"
#update-grub
then reboot
#apt-get install linux-tools
then use the command
#perf top
to see system calls (send me the result).
Another thing to test:
add to /etc/default/grub
GRUB_CMDLINE_LINUX_DEFAULT="quiet transparent_hugepage=madvise"
#update-grub
then reboot
...
#perf top
to see system calls (send me the result).
....
GRUB_CMDLINE_LINUX_DEFAULT="quiet transparent_hugepage=madvise"
Ok.
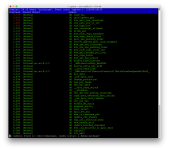
perf top:

And adding the parameter "transparent_hugepage=madvise" to kernel has no effect...

And it could hardly affected because on Proxmox VE 3.x and 4.x with old GUI - works properly.
--
Best regards,
Gosha
Hi,
other users have reported the problem on the mailing list.
Proxmox devs are going to investigated this
other users have reported the problem on the mailing list.
Proxmox devs are going to investigated this


