[SOLVED] What is disk io showing?

Mar 29, 2021
5
0
1
39
Hi.
I'm fairly new to proxmox and was wandering what disk io in summary showing (io per what?).
And is it's ok to have like 18 million peak on vm boot?

If there's any useful link to documentation or an article you can share, It'll be appreciated.
 
Last edited:
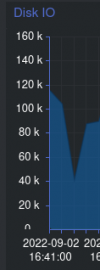
The graph just shows the amount of data read/written (y-axis) at a particular moment in time (x-axis). This is useful as an overview, to understand if a specific VM is demanding on a disk.

And is it's ok to have like 18 million peak on vm boot?
Are you referring to a value given in 'M' at the side, this would just mean that the VM read/wrote (depending on color) this amount of data on startup, which is really no concern.
 
  • Like
Reactions: Serhii Chebonenko
Screenshot from 2022-09-02 17-51-06.png

I'm assuming the `k` means kilobytes, not thousands? (and if it does mean thousands, are they thousands of disk reads/writes, accesses or something else?)
 
I have the same question. Is this IO operations or amount of data? I know my hard disks can read at about 150 MB/s - can I expect to see this rise to 150M during periods of intense disk reading?
 
I can confirm that it's a measure of data read/written by the disk. I copied some data around on the OS disk and saw the reported values in the OS match up with the Disk IO graph for that VM. I would presume it's KiB/MiB as that is what is used in other places in the Proxmox GUI.

What could be confusing to some is that the sample rate is every few minutes (not sure of the exact number) so it's not immediately obvious what the number represents unless you have a disk operation that runs for quite a few minutes
 
  • Like
Reactions: gavinlaking