Very High Load Average

MisterNobody

Member
Oct 31, 2020
10
0
6
37
Hey there,

I have a Proxmox VE host (pve-manager/6.2-4/9824574a (running kernel: 5.4.41-1-pve) which gives me some trouble without direct indication as to why.
The host hardware is the following:

  • Ryzen 5 3600 (6 cores/12 threads)
  • 2x SAMSUNG MZVLB512HAJQ - 512GB NVMe as RAID1
  • 1x TOSHIBA MG06ACA1 - 10TB HDD
  • 1x SAMSUNG MZ7LH960 - 960GB Datacenter SSD
  • 64GB DDR4
  • Intel I210 network card
It's running 66 VMs and 2 CT, those are all networked behind an OPNSense installation.

From time to time (random intervals, sometimes once within a days, other times every hour for a certain duration) it seems the VMs and CTs (not the OPNSense VM and not the host) are losing network connectivity for a split-second (failed name resolutions, pings from the outside don't go through, packet loss on the vmbr1 LAN interface)

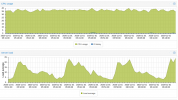
After a few days of checking on my OPNSense installation and even paying for support, nothing was found on that end. Today I notice very high Load Average spikes for the host, which don't match the rest of the utilization but might be the cause.

Load averages range from a normal 3 - 4, up to a 20+
The outputs below were generated during a high phase (24+)

1604186260896.png


iostat -x 5

Code:
Device            r/s     w/s     rkB/s     wkB/s   rrqm/s   wrqm/s  %rrqm  %wrqm r_await w_await aqu-sz rareq-sz wareq-sz  svctm  %util
loop0            0.00    2.00      0.00      8.00     0.00     0.00   0.00   0.00    0.00    0.20   0.00     0.00     4.00   0.80   0.16
loop1            0.00    1.20      0.00      4.80     0.00     0.00   0.00   0.00    0.00    0.17   0.00     0.00     4.00   1.33   0.16
loop2            0.00    0.00      0.00      0.00     0.00     0.00   0.00   0.00    0.00    0.00   0.00     0.00     0.00   0.00   0.00
loop3            0.00    0.00      0.00      0.00     0.00     0.00   0.00   0.00    0.00    0.00   0.00     0.00     0.00   0.00   0.00
nvme0n1          1.60   72.20     24.00   4108.40     0.00     7.80   0.00   9.75    0.12    0.47   0.00    15.00    56.90   2.20  16.24
nvme1n1          0.00   72.20      0.00   4108.40     0.00     7.80   0.00   9.75    0.00    0.42   0.00     0.00    56.90   2.25  16.24
md2              1.60   78.20     24.00   4104.80     0.00     0.00   0.00   0.00    0.00    0.00   0.00    15.00    52.49   0.00   0.00
md1              0.00    0.00      0.00      0.00     0.00     0.00   0.00   0.00    0.00    0.00   0.00     0.00     0.00   0.00   0.00
md0              0.00    0.00      0.00      0.00     0.00     0.00   0.00   0.00    0.00    0.00   0.00     0.00     0.00   0.00   0.00
sda              0.00    0.00      0.00      0.00     0.00     0.00   0.00   0.00    0.00    0.00   0.00     0.00     0.00   0.00   0.00
sdb              0.60   32.00      2.40    173.60     0.00     3.60   0.00  10.11    0.33    0.06   0.00     4.00     5.42   0.93   3.04
dm-0             0.00    0.00      0.00      0.00     0.00     0.00   0.00   0.00    0.00    0.00   0.00     0.00     0.00   0.00   0.00

pveperf /var/lib/vz
Code:
CPU BOGOMIPS:      86238.48
REGEX/SECOND:      3353685
HD SIZE:           436.34 GB (/dev/md2)
BUFFERED READS:    1468.38 MB/sec
AVERAGE SEEK TIME: 0.09 ms
FSYNCS/SECOND:     277.27
DNS EXT:           364.28 ms
DNS INT:           345.99 ms

vmstat 1
Code:
procs -----------memory---------- ---swap-- -----io---- -system-- ------cpu-----
r  b   swpd   free   buff  cache   si   so    bi    bo   in   cs us sy id wa st
2  0 1198592 12683312  43112 1328444    0    0     4  4358 80883 184020 38 10 52  0  0
1  0 1198592 12683452  43136 1326532    0    0     0  4235 82798 192389 38 11 51  0  0
5  0 1198592 12681392  43144 1329056    0    0    48  4064 85589 191985 47 12 41  0  0
2  0 1198592 12681596  43152 1329480    0    0     0  5169 77190 161692 29  6 64  0  0
2  0 1198592 12681832  43168 1330008    0    0    80  5317 75106 156471 21  6 73  0  0
3  0 1198592 12681892  43192 1330224    0    0     4  1536 74959 156326 23  6 71  0  0
2  0 1198592 12681652  43216 1330572    0    0     4   734 74329 154642 20  5 74  0  0
3  0 1198592 12681232  43224 1330744    0    0    48   595 75263 160303 23  6 71  0  0
8  0 1198592 12680628  43232 1331332    0    0   104  3006 76174 158956 29  7 65  0  0
1  0 1198592 12681868  43256 1331768    4    0    28   628 77327 156333 28  8 64  0  0
3  0 1198592 12678752  43304 1332240    0    0    68  1477 77001 171764 30  7 63  0  0
8  0 1198592 12679388  43360 1333212    0    0   172  2953 79669 173986 36  9 54  0  0
5  0 1198592 12679224  43368 1333824    0    0     4   687 77106 169109 31  9 60  0  0
2  0 1198592 12676340  43424 1334348    0    0    72  1490 76611 166185 26  8 66  0  0
0  0 1198592 12665992  43452 1334876    0    0    40  1266 81597 194728 32 10 58  0  0
1  0 1198592 12667492  43452 1335308    0    0     4   986 88513 212946 48 15 36  0  0
2  0 1198592 12667744  43492 1335832    0    0   104  2020 77761 176221 21  7 71  0  0
4  0 1198592 12672260  43508 1336116    0    0     0   759 78894 176994 28 10 63  0  0
2  0 1198592 12671760  43532 1336516    0    0    52  1189 82058 192067 33 12 54  0  0
5  0 1198592 12674836  43556 1337208    0    0    84  1150 77534 167231 25 10 65  0  0
2  0 1198592 12673764  43580 1337616    0    0   108  1769 79338 186212 28 10 62  0  0
0  0 1198592 12672992  43596 1338548    0    0    40  1432 80418 194020 30 11 59  0  0
4  0 1198592 12673516  43660 1339224    0    0    48  1679 76585 167502 19  8 72  1  0

Nothing special in dmesg or journald

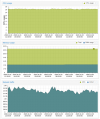
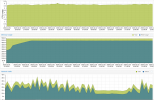
Graphs from the UI:
1604186482608.png

1604186469233.png


1604186511319.png

The VMs and CTs don't run anything special (most of them only have 1-2 cores and 512MB RAM and idle), there is also no replication or backup running on the host (or guests) currently.

Any pointers would be apreciated - maybe not for the dropped virtual LAN, but at least to understand how it jumps from an average of 3 to 24 :)
 
Last edited:
Load includes cpu, io like drives, memory etc.

Given that the spike happens exactly every 20 minutes, it seems like some cron job, timer or application that triggers it. What exactly is run on the VM's ?

How long has the md2 been in service ? (nvme0n1 and nvme1n1), 4kb/s write is a lot and thats without write amplification. As they have a low TBW they will die fast under that pressure. Please post smartctl output for both drives e.g "smartctl -a /dev/nvme0n1"


I would recommend you to install atop, it logs everything that is going on and should make it clear where the bottleneck is.

apt install atop
sed -i "s/600/60/g" /usr/share/atop/atop.daily
systemctl restart atop

Report back after it has been installed for 24h
 
Last edited:
  • Like
Reactions: Kosh
running 66 VMs on a 12HT machine is severely overcommitting your CPU resources, IMHO it's no wonder you are seeing weird scheduling and load issues.
 
running 66 VMs on a 12HT machine is severely overcommitting your CPU resources

Normally I would agree with this, but this doesn't match up at all with the general load of the system and how it behaves.
In general, VMs stay responsive overall, minus the network drops. I'm not positive yet that's that issue is related to the spikes, but one step at a time I guess :)
If we can identify this as the cause I have no issues pulling the trigger on a beefier dual-socket system.


Report back after it has been installed for 24h
That should be the case in about 4hrs, I assume I have to cycle through the intervals and keep an eye out for each resource? Or use atopsar?

I disabled most cronjobs I could find, including any backup jobs (host and guests) - Currently rechecking.
Most of the VMs I run are not doing much - I only require them as tunnel endpoint and each one has it's own public IP.
Squid is running on all of them, one as the main server and the rest as upstreams. My troughput rate is rather low at the moment, around 1pk/s.
The upstream servers are all linked-clones to save on more ressources/disk space.
The other CTs are rather random, mostly Webstack (MySQL, Python, nginx) and another one with Plex (using the physical 10TB drive)
I also tested turning those off, but that did not change much.

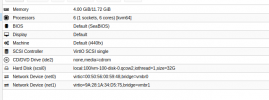
- 1 VM for OPNSense, 6 possible cores, 12GB of RAM
1604333591727.png


1x CT for Squid, 3 CPU cores, 9GB of RAM
1604333543805.png

61x VM for Upstream Squids, 1 CPU core, 512MB RAM, linked-clones
They all look similar
1604333396737.png
 
Last edited:
To check atop reports use (adapt date)

atop -r /var/log/atop/atop_20201102

Then type "t" to go 1 minute forward, (uppercase "T" to go backwards) and check for red lines.

Post a screenshot when there is high load (third line "CPL avg1" >= 15).
 
Last edited:
  • Like
Reactions: MisterNobody
If we can identify this as the cause I have no issues pulling the trigger on a beefier dual-socket system.

I don't think that's the right way to look at this. If you don't start with a normal setup, you're bound to run into issues at some point. Start by fixing your setup. You'll need to do that if it isn't the cause of your issues anyway :)
 
  • Like
Reactions: MisterNobody
@H4R0

Thank you very much for the atop help - already falling in love with it
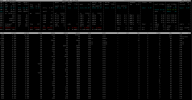
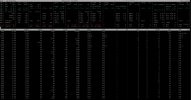
Didn't have to search long for a new record: Load AVG of 31, the only red line is the TAP adapter for the Router VM (ID 100) - IIRC correctly the TAP driver identifies itself as 10Mbps, so 122% is a false positive. CPU at >90% for the KVM process of the OPNSene VM
1604338732876.png

I don't think that's the right way to look at this.
Yeah, that might be, but if it's really too much for the server, what can I do.
Before I had Proxmox running on another server for 2 years and it was smooth sailing - no 60 VMs though, and a routed setup instead of the current OPNSense.
Currently grasping at straws, if nothing is 'wrong' on the Proxmox side, I'll have to nuke OPNSense and confirm with a routed setup. Even considering a subscription, but would like to isolate the actual culprit first.
 
@H4R0

Thank you very much for the atop help - already falling in love with it
Didn't have to search long for a new record: Load AVG of 31, the only red line is the TAP adapter for the Router VM (ID 100) - IIRC correctly the TAP driver identifies itself as 10Mbps, so 122% is a false positive. CPU at >90% for the KVM process of the OPNSene VM
View attachment 20926


Yeah, that might be, but if it's really too much for the server, what can I do.
Before I had Proxmox running on another server for 2 years and it was smooth sailing - no 60 VMs though, and a routed setup instead of the current OPNSense.
Currently grasping at straws, if nothing is 'wrong' on the Proxmox side, I'll have to nuke OPNSense and confirm with a routed setup. Even considering a subscription, but would like to isolate the actual culprit first.

If you press "c" it should show the command line arguments for kvm to make sure its opnsense, you can press "?" to get a legend of everything.

Network is indeed a false postitive, the adapters are 10GB and falsely reported as 10MB.

Your cpu clock speed seems rather low, might be thermal trothling, atop sadly does not include cpu temps, but you can use lm-sensors for that. Check inlets and cpu cooler for dust.

Make sure to use virtio (not e1000) nic for your opnsense and disable all hardware offloading features under "Interfaces -> Settings -> Check CRC, TSO & LRO"
 
Make sure to use virtio (not e1000) nic for your opnsense and disable all hardware offloading features under "Interfaces -> Settings -> Check CRC, TSO & LRO"

The first thing I did after install, wish that was it.
1604341852766.png
1604341915306.png

It's really the opnsense guest (checked it before using the PID, but atop confirms it)
Screenshot when Load AVG is low (< 3):
1604341796841.png


I've monitored the temps for a bit (60sec intervals, 30min duration)
The range is somewhere around 72.9°C to 83.1°C
CPU Freq (3.6GHz is the Max for this CPU) switches around from 2.2 over 2.8 to 3.6
According to the AMD specs, max temp 95°C

Examples from the log:
Code:
Mon 02 Nov 2020 08:21:01 PM CET
k10temp-pci-00c3
Adapter: PCI adapter
Tdie:         +74.6°C  (high = +70.0°C)
Tctl:         +74.6°C

CPU%: 13
Load AVG: 20.18
Current CPU FREQ: 2200000

Code:
Mon 02 Nov 2020 08:43:01 PM CET
k10temp-pci-00c3
Adapter: PCI adapter
Tdie:         +72.9°C  (high = +70.0°C)
Tctl:         +72.9°C

CPU%: 15.7
Load AVG: 18.64
Current CPU FREQ: 3600000

Code:
Mon 02 Nov 2020 08:20:01 PM CET
k10temp-pci-00c3
Adapter: PCI adapter
Tdie:         +75.8°C  (high = +70.0°C)
Tctl:         +75.8°C

CPU%: 85.9
Load AVG: 12.37
Current CPU FREQ: 3600000

Code:
Mon 02 Nov 2020 08:35:01 PM CET
k10temp-pci-00c3
Adapter: PCI adapter
Tdie:         +75.4°C  (high = +70.0°C)
Tctl:         +75.4°C

CPU%: 65.7
Load AVG: 2.43
Current CPU FREQ: 2200000
 
Last edited:
The first thing I did after install, wish that was it.
View attachment 20928
View attachment 20929

It's really the opnsense guest (checked it before using the PID, but atop confirms it)
Screenshot when Load AVG is low (< 3):
View attachment 20927


I've monitored the temps for a bit (60sec intervals, 30min duration)
The range is somewhere around 72.9°C to 83.1°C
CPU Freq (3.6GHz is the Max for this CPU) switches around from 2.2 over 2.8 to 3.6
According to the AMD specs, max temp 95°C

Examples from the log:
Code:
Mon 02 Nov 2020 08:21:01 PM CET
k10temp-pci-00c3
Adapter: PCI adapter
Tdie:         +74.6°C  (high = +70.0°C)
Tctl:         +74.6°C

CPU%: 13
Load AVG: 20.18
Current CPU FREQ: 2200000

Code:
Mon 02 Nov 2020 08:43:01 PM CET
k10temp-pci-00c3
Adapter: PCI adapter
Tdie:         +72.9°C  (high = +70.0°C)
Tctl:         +72.9°C

CPU%: 15.7
Load AVG: 18.64
Current CPU FREQ: 3600000

Code:
Mon 02 Nov 2020 08:20:01 PM CET
k10temp-pci-00c3
Adapter: PCI adapter
Tdie:         +75.8°C  (high = +70.0°C)
Tctl:         +75.8°C

CPU%: 85.9
Load AVG: 12.37
Current CPU FREQ: 3600000

Code:
Mon 02 Nov 2020 08:35:01 PM CET
k10temp-pci-00c3
Adapter: PCI adapter
Tdie:         +75.4°C  (high = +70.0°C)
Tctl:         +75.4°C

CPU%: 65.7
Load AVG: 2.43
Current CPU FREQ: 2200000

Those temps seem way to high you are not even stressing the cpu.

Proxmox uses performance governor by default which should run the cpu at base clock all the time, which in your case should be 3.6-4.2ghz

Please post output of "cat /sys/devices/system/cpu/cpu*/cpufreq/scaling_governor" to verify that.

I would not run it at that temps, it can effect memory controllers etc. as well.


Make sure there is no dust piled up and hot air can properly escape. The inlet temperature should be <=30°C

Change fan settings in bios to increase rpm of cpu and chassis fans and see if the problem goes away.


Personally i run all my servers <= 50°C, with max peaks of 65°C
 
As this is a remote machine (Hetzner Datacenter) I'll raise a ticket with their support to double-check the settings and general state of the fans.

cat /sys/devices/system/cpu/cpu*/cpufreq/scaling_governor
Code:
ondemand
ondemand
ondemand
ondemand
ondemand
ondemand
ondemand
ondemand
ondemand
ondemand
ondemand
ondemand

The 4.2 GHz Turbo boost might not be available, so 3.6GHz is indeed the maximum in this state

cat /sys/devices/system/cpu/cpu0/cpufreq/scaling_available_frequencies
Code:
3400000 3000000 2200000

cpupower frequency-info
Code:
cpupower frequency-info
analyzing CPU 0:
  driver: acpi-cpufreq
  CPUs which run at the same hardware frequency: 0
  CPUs which need to have their frequency coordinated by software: 0
  maximum transition latency:  Cannot determine or is not supported.
  hardware limits: 2.20 GHz - 3.60 GHz
  available frequency steps:  3.60 GHz, 2.80 GHz, 2.20 GHz
  available cpufreq governors: conservative ondemand userspace powersave performance schedutil
  current policy: frequency should be within 2.20 GHz and 3.60 GHz.
                  The governor "ondemand" may decide which speed to use
                  within this range.
  current CPU frequency: 2.80 GHz (asserted by call to hardware)
  boost state support:
    Supported: yes
    Active: yes
    Boost States: 0
    Total States: 3
    Pstate-P0:  3600MHz
    Pstate-P1:  2800MHz
    Pstate-P2:  2200MHz

Edit:

I ran cpupower frequency-set --governor performance and Hetzner completed their check with:

As requested we have checked the cooling but can't find any issue. The CPU fan is working fine. We have booted your server up again.
 
Last edited:
As this is a remote machine (Hetzner Datacenter) I'll raise a ticket with their support to double-check the settings and general state of the fans.

cat /sys/devices/system/cpu/cpu*/cpufreq/scaling_governor
Code:
ondemand
ondemand
ondemand
ondemand
ondemand
ondemand
ondemand
ondemand
ondemand
ondemand
ondemand
ondemand

The 4.2 GHz Turbo boost might not be available, so 3.6GHz is indeed the maximum in this state

cat /sys/devices/system/cpu/cpu0/cpufreq/scaling_available_frequencies
Code:
3400000 3000000 2200000

cpupower frequency-info
Code:
cpupower frequency-info
analyzing CPU 0:
  driver: acpi-cpufreq
  CPUs which run at the same hardware frequency: 0
  CPUs which need to have their frequency coordinated by software: 0
  maximum transition latency:  Cannot determine or is not supported.
  hardware limits: 2.20 GHz - 3.60 GHz
  available frequency steps:  3.60 GHz, 2.80 GHz, 2.20 GHz
  available cpufreq governors: conservative ondemand userspace powersave performance schedutil
  current policy: frequency should be within 2.20 GHz and 3.60 GHz.
                  The governor "ondemand" may decide which speed to use
                  within this range.
  current CPU frequency: 2.80 GHz (asserted by call to hardware)
  boost state support:
    Supported: yes
    Active: yes
    Boost States: 0
    Total States: 3
    Pstate-P0:  3600MHz
    Pstate-P1:  2800MHz
    Pstate-P2:  2200MHz

Edit:

I ran cpupower frequency-set --governor performance and Hetzner completed their check with:

Ok so it does indeed scale, the temps still dont check out, 74.6°C at 13% cpu is just not right.

If it run for >= 2 years at that temps it could definetly take a repaste.


If i were you i would try a stress test and see if it throthles just to make sure thats not the problem, for that open up 2 terminal windows or use tmux/screen.

First shutdown all vm's and install stress "apt install stress". Then in one window open up "watch -n .2 sensors" and in the other "stress --cpu 12 --timeout 120"

Check the sensors window, it should stay at a clock rate of 3.6ghz and not go beyond 95°C, thermal shutdown is at 105°C, if it clocks at 2.2ghz its trothling.

If it passes the 2 minute test you indeed have a problem with over commiting, in that case i would recommend you to switch from vm's to containers which do not have all the overhead that comes with vm's, you can give them static ips and do pbr routing on the opnsense just like with vm's.

Nothing else stands out.
 
Did the stress test:
The temp was staying at exactly 94.9°C with a clock rate of 3.6GHz consistently. When I turned off the VMs, I saw the temp jumping around between 55°C and 65°C in idle. I don't think Hetzner will repaste the CPU after less than a year of being available.
CPUTIN is around 48°C idle and ~60°C during the stress test. Not sure how accurate that is for this chipset.

I'll try migrating to containers and report back. Hope that's it.

Thank you @H4R0 for all the time spent on this
 
Update on this:
Moving all guests to be containers did lower the average load on the host system but it didn't resolve the initial issue of high packet loss. (occurring on the first hop for the VM to the Proxmox host bridge)
I also moved away from the Opnsense/pfsense VM as a router but that did not improve the situation.
 

About

The Proxmox community has been around for many years and offers help and support for Proxmox VE, Proxmox Backup Server, and Proxmox Mail Gateway.
We think our community is one of the best thanks to people like you!

Get your subscription!

The Proxmox team works very hard to make sure you are running the best software and getting stable updates and security enhancements, as well as quick enterprise support. Tens of thousands of happy customers have a Proxmox subscription. Get yours easily in our online shop.

Buy now!