Hey,
we have a problem with our PBS setup regarding the traffic limitations. We run PBS 2.3.2 and PVE 7.3.4 with Ceph 16.2.9 as storage backend. We have configured a limit of 120 MiB/s for backups from all networks. This works great on the PBS site but sometimes we observe much higher rates in the logs, the CEPH and on the network we can't explain.
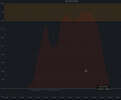
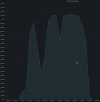
The above log shows such a backup and you can see read rates of up to 1009.3 MiB/s which is nearly 10 times higher than the limit we set in the PBS backend. We also see much traffic of up to 9Gbit/s on our network (image with the red graph) and on the ceph (read). Despite that, on the rbd itself we only see the configured limited read rate (blue graph). Do you have a good explanation for this? At the moment our only guess would be that it is related to empty blocks transfered from other ceph cluster nodes to the node where the backup is read. But even then how can we limit the traffic of backups on all parts to prevent saturation of the 10G network?
we have a problem with our PBS setup regarding the traffic limitations. We run PBS 2.3.2 and PVE 7.3.4 with Ceph 16.2.9 as storage backend. We have configured a limit of 120 MiB/s for backups from all networks. This works great on the PBS site but sometimes we observe much higher rates in the logs, the CEPH and on the network we can't explain.
Code:
INFO: starting new backup job: vzdump 340 --storage pbs2.vol2 --mailnotification always --quiet 1 --prune-backups 'keep-all=1' --mode snapshot --notes-template 'VMID {{vmid}} - {{guestname}}'
INFO: Starting Backup of VM 340 (qemu)
INFO: Backup started at 2023-01-27 21:20:07
INFO: status = running
INFO: VM Name: vm.example.com
INFO: include disk 'scsi0' 'SSD4T:vm-340-disk-0' 200G
INFO: backup mode: snapshot
INFO: ionice priority: 7
INFO: HOOK: Created silence with ID: 0d119a52-901c-4d2d-8606-7b0d7746be28
INFO: creating Proxmox Backup Server archive 'vm/340/2023-01-27T20:20:07Z'
INFO: issuing guest-agent 'fs-freeze' command
INFO: issuing guest-agent 'fs-thaw' command
INFO: started backup task 'e3c36e82-a974-4d93-8dea-1bfcac50d60b'
INFO: resuming VM again
INFO: scsi0: dirty-bitmap status: existing bitmap was invalid and has been cleared
INFO:   0% (464.0 MiB of 200.0 GiB) in 3s, read: 154.7 MiB/s, write: 121.3 MiB/s
INFO:   1% (2.2 GiB of 200.0 GiB) in 17s, read: 129.7 MiB/s, write: 111.1 MiB/s
INFO:   2% (4.3 GiB of 200.0 GiB) in 31s, read: 154.3 MiB/s, write: 94.9 MiB/s
INFO:   3% (7.3 GiB of 200.0 GiB) in 34s, read: 1010.7 MiB/s, write: 2.7 MiB/s
INFO:   5% (10.2 GiB of 200.0 GiB) in 37s, read: 1000.0 MiB/s, write: 2.7 MiB/s
INFO:   6% (13.2 GiB of 200.0 GiB) in 40s, read: 1012.0 MiB/s, write: 1.3 MiB/s
INFO:   8% (16.1 GiB of 200.0 GiB) in 43s, read: 1000.0 MiB/s, write: 1.3 MiB/s
INFO:   9% (19.0 GiB of 200.0 GiB) in 46s, read: 998.7 MiB/s, write: 0 B/s
INFO:  11% (22.0 GiB of 200.0 GiB) in 49s, read: 1008.0 MiB/s, write: 0 B/s
INFO:  12% (24.9 GiB of 200.0 GiB) in 52s, read: 996.0 MiB/s, write: 1.3 MiB/s
INFO:  13% (27.8 GiB of 200.0 GiB) in 55s, read: 966.7 MiB/s, write: 0 B/s
INFO:  14% (28.5 GiB of 200.0 GiB) in 58s, read: 261.3 MiB/s, write: 98.7 MiB/s
INFO:  15% (30.9 GiB of 200.0 GiB) in 1m 5s, read: 343.4 MiB/s, write: 86.3 MiB/s
INFO:  16% (33.8 GiB of 200.0 GiB) in 1m 8s, read: 1000.0 MiB/s, write: 0 B/s
INFO:  18% (36.7 GiB of 200.0 GiB) in 1m 11s, read: 997.3 MiB/s, write: 0 B/s
INFO:  19% (39.7 GiB of 200.0 GiB) in 1m 14s, read: 1016.0 MiB/s, write: 0 B/s
INFO:  20% (40.6 GiB of 200.0 GiB) in 1m 17s, read: 308.0 MiB/s, write: 97.3 MiB/s
INFO:  21% (42.0 GiB of 200.0 GiB) in 1m 30s, read: 113.2 MiB/s, write: 92.9 MiB/s
INFO:  22% (44.2 GiB of 200.0 GiB) in 1m 35s, read: 435.2 MiB/s, write: 71.2 MiB/s
INFO:  23% (46.2 GiB of 200.0 GiB) in 1m 38s, read: 710.7 MiB/s, write: 42.7 MiB/s
INFO:  24% (49.0 GiB of 200.0 GiB) in 1m 41s, read: 929.3 MiB/s, write: 18.7 MiB/s
INFO:  25% (51.6 GiB of 200.0 GiB) in 1m 44s, read: 909.3 MiB/s, write: 22.7 MiB/s
INFO:  27% (54.2 GiB of 200.0 GiB) in 1m 47s, read: 892.0 MiB/s, write: 26.7 MiB/s
INFO:  28% (57.2 GiB of 200.0 GiB) in 1m 50s, read: 1005.3 MiB/s, write: 0 B/s
INFO:  30% (60.1 GiB of 200.0 GiB) in 1m 53s, read: 1008.0 MiB/s, write: 0 B/s
INFO:  31% (62.9 GiB of 200.0 GiB) in 1m 56s, read: 940.0 MiB/s, write: 17.3 MiB/s
INFO:  32% (65.9 GiB of 200.0 GiB) in 1m 59s, read: 1010.7 MiB/s, write: 2.7 MiB/s
INFO:  34% (68.8 GiB of 200.0 GiB) in 2m 2s, read: 998.7 MiB/s, write: 8.0 MiB/s
INFO:  35% (71.7 GiB of 200.0 GiB) in 2m 5s, read: 1008.0 MiB/s, write: 0 B/s
INFO:  37% (74.6 GiB of 200.0 GiB) in 2m 8s, read: 993.3 MiB/s, write: 0 B/s
INFO:  38% (77.6 GiB of 200.0 GiB) in 2m 11s, read: 1016.0 MiB/s, write: 0 B/s
INFO:  40% (80.6 GiB of 200.0 GiB) in 2m 14s, read: 1010.7 MiB/s, write: 1.3 MiB/s
INFO:  41% (83.6 GiB of 200.0 GiB) in 2m 17s, read: 1021.3 MiB/s, write: 0 B/s
INFO:  43% (86.5 GiB of 200.0 GiB) in 2m 20s, read: 1009.3 MiB/s, write: 0 B/s
INFO:  44% (89.4 GiB of 200.0 GiB) in 2m 23s, read: 993.3 MiB/s, write: 0 B/s
INFO:  46% (92.4 GiB of 200.0 GiB) in 2m 27s, read: 753.0 MiB/s, write: 1.0 MiB/s
INFO:  47% (95.3 GiB of 200.0 GiB) in 2m 30s, read: 1005.3 MiB/s, write: 0 B/s
INFO:  49% (98.1 GiB of 200.0 GiB) in 2m 33s, read: 964.0 MiB/s, write: 8.0 MiB/s
INFO:  50% (100.7 GiB of 200.0 GiB) in 2m 40s, read: 378.3 MiB/s, write: 142.9 MiB/s
INFO:  51% (103.7 GiB of 200.0 GiB) in 2m 43s, read: 1004.0 MiB/s, write: 0 B/s
INFO:  53% (106.6 GiB of 200.0 GiB) in 2m 46s, read: 1008.0 MiB/s, write: 2.7 MiB/s
INFO:  54% (109.6 GiB of 200.0 GiB) in 2m 49s, read: 1018.7 MiB/s, write: 0 B/s
INFO:  56% (112.6 GiB of 200.0 GiB) in 2m 52s, read: 1016.0 MiB/s, write: 0 B/s
INFO:  57% (115.5 GiB of 200.0 GiB) in 2m 55s, read: 1008.0 MiB/s, write: 0 B/s
INFO:  59% (118.5 GiB of 200.0 GiB) in 2m 58s, read: 997.3 MiB/s, write: 0 B/s
INFO:  60% (121.4 GiB of 200.0 GiB) in 3m 1s, read: 1012.0 MiB/s, write: 0 B/s
INFO:  62% (124.4 GiB of 200.0 GiB) in 3m 4s, read: 1012.0 MiB/s, write: 5.3 MiB/s
INFO:  63% (127.3 GiB of 200.0 GiB) in 3m 7s, read: 1006.7 MiB/s, write: 0 B/s
INFO:  65% (130.3 GiB of 200.0 GiB) in 3m 10s, read: 998.7 MiB/s, write: 1.3 MiB/s
INFO:  66% (133.2 GiB of 200.0 GiB) in 3m 13s, read: 1006.7 MiB/s, write: 1.3 MiB/s
INFO:  68% (136.2 GiB of 200.0 GiB) in 3m 16s, read: 1014.7 MiB/s, write: 16.0 MiB/s
INFO:  69% (139.1 GiB of 200.0 GiB) in 3m 19s, read: 1009.3 MiB/s, write: 0 B/s
INFO:  71% (142.1 GiB of 200.0 GiB) in 3m 22s, read: 1020.0 MiB/s, write: 0 B/s
INFO:  72% (145.1 GiB of 200.0 GiB) in 3m 25s, read: 1004.0 MiB/s, write: 5.3 MiB/s
INFO:  74% (148.0 GiB of 200.0 GiB) in 3m 28s, read: 1001.3 MiB/s, write: 0 B/s
INFO:  75% (150.9 GiB of 200.0 GiB) in 3m 31s, read: 1001.3 MiB/s, write: 0 B/s
INFO:  76% (153.9 GiB of 200.0 GiB) in 3m 34s, read: 1014.7 MiB/s, write: 0 B/s
INFO:  78% (156.9 GiB of 200.0 GiB) in 3m 37s, read: 1020.0 MiB/s, write: 0 B/s
INFO:  79% (159.8 GiB of 200.0 GiB) in 3m 40s, read: 997.3 MiB/s, write: 0 B/s
INFO:  81% (162.8 GiB of 200.0 GiB) in 3m 43s, read: 1012.0 MiB/s, write: 0 B/s
INFO:  82% (165.8 GiB of 200.0 GiB) in 3m 46s, read: 1009.3 MiB/s, write: 0 B/s
INFO:  84% (168.7 GiB of 200.0 GiB) in 3m 49s, read: 1009.3 MiB/s, write: 0 B/s
INFO:  85% (171.7 GiB of 200.0 GiB) in 3m 52s, read: 1008.0 MiB/s, write: 0 B/s
INFO:  87% (174.6 GiB of 200.0 GiB) in 3m 55s, read: 1005.3 MiB/s, write: 4.0 MiB/s
INFO:  88% (177.6 GiB of 200.0 GiB) in 3m 58s, read: 1013.3 MiB/s, write: 0 B/s
INFO:  90% (180.5 GiB of 200.0 GiB) in 4m 1s, read: 1005.3 MiB/s, write: 0 B/s
INFO:  91% (183.4 GiB of 200.0 GiB) in 4m 4s, read: 978.7 MiB/s, write: 0 B/s
INFO:  93% (186.3 GiB of 200.0 GiB) in 4m 7s, read: 994.7 MiB/s, write: 5.3 MiB/s
INFO:  94% (188.3 GiB of 200.0 GiB) in 4m 10s, read: 682.7 MiB/s, write: 50.7 MiB/s
INFO:  95% (190.1 GiB of 200.0 GiB) in 4m 13s, read: 621.3 MiB/s, write: 66.7 MiB/s
INFO:  96% (192.2 GiB of 200.0 GiB) in 4m 18s, read: 428.0 MiB/s, write: 91.2 MiB/s
INFO:  97% (194.8 GiB of 200.0 GiB) in 4m 21s, read: 874.7 MiB/s, write: 17.3 MiB/s
INFO:  98% (197.7 GiB of 200.0 GiB) in 4m 24s, read: 990.7 MiB/s, write: 2.7 MiB/s
INFO: 100% (200.0 GiB of 200.0 GiB) in 4m 27s, read: 793.3 MiB/s, write: 2.7 MiB/s
INFO: Waiting for server to finish backup validation...
INFO: backup is sparse: 191.11 GiB (95%) total zero data
INFO: backup was done incrementally, reused 191.72 GiB (95%)
INFO: transferred 200.00 GiB in 268 seconds (764.2 MiB/s)
INFO: adding notes to backup
INFO: HOOK: Removed silence with ID: 0d119a52-901c-4d2d-8606-7b0d7746be28
INFO: Finished Backup of VM 340 (00:04:31)
INFO: Backup finished at 2023-01-27 21:24:38
INFO: Backup job finished successfully
TASK OK
The above log shows such a backup and you can see read rates of up to 1009.3 MiB/s which is nearly 10 times higher than the limit we set in the PBS backend. We also see much traffic of up to 9Gbit/s on our network (image with the red graph) and on the ceph (read). Despite that, on the rbd itself we only see the configured limited read rate (blue graph). Do you have a good explanation for this? At the moment our only guess would be that it is related to empty blocks transfered from other ceph cluster nodes to the node where the backup is read. But even then how can we limit the traffic of backups on all parts to prevent saturation of the 10G network?


