Hello,
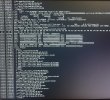
My Proxmox node has been getting in a bit of a bind the last few days (first happened on March 30). About once or twice a day it has gotten into a soft lockup at different times during the day as can be seen in the picture below and the whole system becomes unresponsive. After a reboot, the system proceeds to work as normal for around a day and then the exact same happens again. Below is the trace displayed to the screen output (not present in journalctl)
I am not experienced enough to get much from these logs, unfortunately.
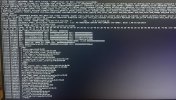
Rebooting the machine and looking at the journal logs from the previous boot, it only shows logs from the automatic backup to PBS and the hourly cron log. I think it is not related to the backups because the backup always succeeds and the machine has crashed at times no backup was done close to the crash. Also the hourly cron directory (/etc/cron.hourly) only contains the ".placeholder" file.
For reference, the machine crashed/locked up at about 22:18:45 for these logs.
I saw some places online linking this to a memory issue, which I understand. I have had XMP enabled for a long time without any problem. I have however turned it of to test if that could have caused the issue, but with it disabled the lockup still presents. I also ran memtest with XMP enabled, which passed with 0 errors.

Here is the pveversion details
Other information:
I have two 240gb ssds in a zfs mirror for the host and three 8Tb HDDs in raidz1 for general storage, which all have no SMART errors.
The average IO delay reported by Proxmox is less than 1% (I stopped a lot because of this issue) with CPU at around 1%. When running backups it is around 10% io delay with CPU at around 5%.
I am running PBS is in an lxc, it is not backing itself up. PBS has access to a directory on an extra HDD via bind mounts, this hdd is only used for the backups from pbs.
Too little ram I had found online as a potential issue but I looked at the ram consumption just before the lockups and it was only reporting 24 (including arc cache) out of 32gb, so I presumed that that would be okay.
If you have any other troubleshooting ideas or ways to find the underlying issue here, I am happy to try them. Thanks for any help in any case, much appreciated") !
!
My Proxmox node has been getting in a bit of a bind the last few days (first happened on March 30). About once or twice a day it has gotten into a soft lockup at different times during the day as can be seen in the picture below and the whole system becomes unresponsive. After a reboot, the system proceeds to work as normal for around a day and then the exact same happens again. Below is the trace displayed to the screen output (not present in journalctl)
Code:
[33239.260382] watchdog: BUG: soft lockup - CPU#4 stuck for 82s! [kworker/4:2:23346] [33239.260924] Modules linked in: tcp_diag inet_diag nft_chain_nat xt_MASQUERADE nf_nat nf_conntrack nf_defrag_ipv6 nf_defrag_ipv4 nft_compat wireguard c libchacha20poly1305 chacha_x86_64 poly1305_x86_64 libcurve25519_generic libchacha ip6_udp_tunnel udp tunnel cfg80211 veth ebtable_filter ebtables ip_set ble_raw ip6table_filter ip6_tables iptable_filter bpfilter nf_tables scsi_transport_iscsi sunrpc binfmt_misc bonding tls nfnetlink_log nfnetlink vhost_ne lb tap vfio-pci vfio_pci_core vfio_iommu_typel vfio iommufd nvidia_uvm(POE) nvidia_drm (POE) nvidia_modeset (POE) intel_rapl_msr intel_rapl_common edac_mce irgbypass crct10dif_pclmul polyval_clmulni polyval_generic ghash_clmulni_intel sha256_ssse3 shal_ssse3 nvidia (POE) aesni_intel crypto_simd cryptd snd_hda d_hda_codec_generic ledtrig_audio snd_hda_codec_hdmi snd_hda_intel snd_intel_dspcfg snd_intel_sdw_acpi snd_hda_codec snd_hda_core snd_hwdep snd_pcm snd_t _helper snd [33239.261015] Soundcore pcspkr wmi_bmof ccp video k10temp joydev input_leds mac_hid drm efi_pstore dmi_sysfs ip_tables x_tables autofs4 zfs(PO) spl (0) t eric xor hid-generic usbkbd usbhid hid raid6_pq libcrc32c simplefb xhci_pci xhci_pci_renesas crc32_pclmul mpt3sas igb i2c_piix4 raid_class xhci_hcd i2c_al sport_sas ahci dca libahci umi gpio_amdpt
[33239.266024] CPU: 4 PID: 23346 Comm: kworker/4:2 Tainted: P OEL 6.5.13-3-pve #1
[33239.266556] Hardware name: Micro-Star International Co., Ltd. MS-7B00/B350 GAMING PRO CARBON (MS-7800), BIOS 1.HO 01/22/2019 [33239.267085] Workqueue: events netstamp_clear
[33239.267593] RIP: 0010: smp_call_function_many_cond+0x131/0x500
[33239.268106] Code: 49 8b 7f 88 48 63 de e8 9d 83 Sa 00 3b 05 07 b4 38 02 73 25 48 63 de 49 8b 37 48 03 34 d5 40 3b a5 ae 8b 56 08 83 e2 01 74 0a <13> 90 01 75 f6 83 c0 01 eb c1 48 83 c4 48 5b 41 Sc
[33239.269171] RSP: 0018: ffff910261627cb0 EFLAGS: 00000202
[33239.269707] RAX: 0000000000000006 RBX: 0000000000000246 RCX: 0000000000000001
[33239.270248] RDX: 0000000000000001 RSI: ffff8be2fefba8c0 RDI: 0000000000000000
[33239.270788] RBP: ffff9f0261627d20 R08: 0000000000000000 R09: 0000000000000000
[33239.271328] R10: ffff8bdc00142310 R11: 0000000000000000 R12: ffff8be2fef34280
[33239.271866] R13: 0000000000000001 R14: 0000000000000004 R15: ffff8be2fef34280
[33239.272402] FS: 000000000000000010000) GS:ffff8be2fef0000010000) kn1GS:0000000000000000
[33239.272941] CS: 0010 DS: 0000 ES: 0000 CRO: 0000000080050033
[33239.273478] CR2: 00007690e3cabf60 CR3: 00000001e2a34000 CR4: 00000000003506e0
[33239.274022] Call Trace:
[33239.274560] <IRQ>
[33239.275097] ? show_regs+0x6d/0x80
[33239.275637] ? watchdog_timer_fn+0x1d8/0x240
[33239.276182] ?__pfx_watchdog_timer_fn+0x10/0x10
[33239.276722] ?hrtimer_run_queues+0x108/0x280
[33239.277260] ? srso_return_thunk+0x5/0x10
[33239.277801] ? hrtimer_interrupt+0xf6/0x250
[33239.278341] ?__sysvec_apic_timer_interrupt+0x62/0x140
[33239.278884] ? sysvec_apic_timer_interrupt+0x8d/0xd0
[33239.279427] </IRQ>
[33239.279964] <TASK>
[33239.280497] ? asm_sysvec_apic_timer_interrupt+0x1b/0x20
[33239.281043] ? smp_call_function_many_cond+0x131/0x500
[33239.281586] ? __pfx_do_sync_core+0x10/0x10
[33239.282128] on_each_cpu_cond_mask+0x24/0x60
[33239.282669] text_poke_bp_batch+0xbe/0x300
[33239.283216] text_poke_finish+0x1f/0x40
[33239.283756] arch_jump_label_transform_apply+0x1a/0x30
[33239.284301] --jump_label_update+0xf4/0x140
[33239.284843] jump_label_update+0xae/0x120
[33239.285385] static_key_enable_cpuslocked+0x87/0xb0
[33239.285929] static_key_enable+0x1a/0x30
[33239.286470] netstamp_clear+0x2d/0x50
[33239.287007] process_one_work+0x23e/0x450
[33239.287550] worker thread+0x50/0x310
[33239.288091] ?__pfx_worker_thread+0x10/0x10
[33239.288631] kthread+0xf2/0x120
[33239.289169] ?_pfx_kthread+0x10/0x10
[33239.289709] ret_from_fork+0x47/0x70
[33239.290247] ?_pfx_kthread+0x10/0x10
[33239.290787] ret_from_fork_asm+0x1b/0x30
[33239.291329] </TASK>
I am not experienced enough to get much from these logs, unfortunately.
Rebooting the machine and looking at the journal logs from the previous boot, it only shows logs from the automatic backup to PBS and the hourly cron log. I think it is not related to the backups because the backup always succeeds and the machine has crashed at times no backup was done close to the crash. Also the hourly cron directory (/etc/cron.hourly) only contains the ".placeholder" file.
Code:
Apr 03 22:00:01 pve pvescheduler[312153]: INFO: Starting Backup of VM 101 (lxc)
Apr 03 22:00:27 pve pvescheduler[312153]: INFO: Finished Backup of VM 101 (00:00:26)
Apr 03 22:00:27 pve pvescheduler[312153]: INFO: Starting Backup of VM 102 (lxc)
Apr 03 22:01:15 pve pvescheduler[312153]: INFO: Finished Backup of VM 102 (00:00:48)
Apr 03 22:01:15 pve pvescheduler[312153]: INFO: Starting Backup of VM 104 (lxc)
Apr 03 22:02:25 pve pvescheduler[312153]: INFO: Finished Backup of VM 104 (00:01:10)
Apr 03 22:02:25 pve pvescheduler[312153]: INFO: Starting Backup of VM 105 (lxc)
Apr 03 22:02:28 pve pvestatd[1956]: metrics send error 'influxdb': 500 read timeout
Apr 03 22:02:52 pve pvescheduler[312153]: INFO: Finished Backup of VM 105 (00:00:27)
Apr 03 22:02:52 pve pvescheduler[312153]: INFO: Starting Backup of VM 106 (lxc)
Apr 03 22:04:46 pve pvescheduler[312153]: INFO: Finished Backup of VM 106 (00:01:54)
Apr 03 22:04:46 pve pvescheduler[312153]: INFO: Starting Backup of VM 107 (lxc)
Apr 03 22:06:27 pve pvescheduler[312153]: INFO: Finished Backup of VM 107 (00:01:41)
Apr 03 22:06:28 pve pvescheduler[312153]: INFO: Starting Backup of VM 108 (lxc)
Apr 03 22:11:38 pve smartd[1526]: Device: /dev/sdb [SAT], SMART Usage Attribute: 190 Airflow_Temperature_Cel changed from 75 to 74
Apr 03 22:11:38 pve smartd[1526]: Device: /dev/sdb [SAT], SMART Usage Attribute: 194 Temperature_Celsius changed from 25 to 26
Apr 03 22:11:39 pve smartd[1526]: Device: /dev/sdc [SAT], SMART Usage Attribute: 190 Airflow_Temperature_Cel changed from 73 to 72
Apr 03 22:11:39 pve smartd[1526]: Device: /dev/sdc [SAT], SMART Usage Attribute: 194 Temperature_Celsius changed from 27 to 28
Apr 03 22:11:39 pve smartd[1526]: Device: /dev/sde [SAT], SMART Usage Attribute: 194 Temperature_Celsius changed from 24 to 26
Apr 03 22:14:33 pve CRON[312119]: pam_unix(cron:session): session closed for user root
Apr 03 22:14:43 pve pvescheduler[312153]: INFO: Finished Backup of VM 108 (00:08:15)
Apr 03 22:14:43 pve pvescheduler[312153]: INFO: Starting Backup of VM 109 (lxc)
Apr 03 22:16:01 pve pvescheduler[312153]: INFO: Finished Backup of VM 109 (00:01:18)
Apr 03 22:16:01 pve pvescheduler[312153]: INFO: Starting Backup of VM 111 (lxc)
Apr 03 22:16:48 pve pvescheduler[312153]: INFO: Finished Backup of VM 111 (00:00:47)
Apr 03 22:16:48 pve pvescheduler[312153]: INFO: Starting Backup of VM 200 (qemu)
Apr 03 22:16:53 pve pvescheduler[312153]: INFO: Finished Backup of VM 200 (00:00:05)
Apr 03 22:16:53 pve pvescheduler[312153]: INFO: Backup job finished successfully
Apr 03 22:17:01 pve CRON[323112]: pam_unix(cron:session): session opened for user root(uid=0) by (uid=0)
Apr 03 22:17:01 pve CRON[323113]: (root) CMD (cd / && run-parts --report /etc/cron.hourly)
Apr 03 22:17:01 pve CRON[323112]: pam_unix(cron:session): session closed for user root192.168.1.108:8007192.168.1.108:8007192.168.1.108:8007
For reference, the machine crashed/locked up at about 22:18:45 for these logs.
I saw some places online linking this to a memory issue, which I understand. I have had XMP enabled for a long time without any problem. I have however turned it of to test if that could have caused the issue, but with it disabled the lockup still presents. I also ran memtest with XMP enabled, which passed with 0 errors.
Here is the pveversion details
Code:
root@pve:~# pveversion -v
proxmox-ve: 8.1.0 (running kernel: 6.5.13-3-pve)
pve-manager: 8.1.10 (running version: 8.1.10/4b06efb5db453f29)
proxmox-kernel-helper: 8.1.0
pve-kernel-6.2: 8.0.5
proxmox-kernel-6.5.13-3-pve-signed: 6.5.13-3
proxmox-kernel-6.5: 6.5.13-3
proxmox-kernel-6.5.13-1-pve-signed: 6.5.13-1
proxmox-kernel-6.2.16-20-pve: 6.2.16-20
proxmox-kernel-6.2: 6.2.16-20
ceph-fuse: 16.2.11+ds-2
corosync: 3.1.7-pve3
criu: 3.17.1-2
glusterfs-client: 10.3-5
ifupdown2: 3.2.0-1+pmx8
ksm-control-daemon: 1.4-1
libjs-extjs: 7.0.0-4
libknet1: 1.28-pve1
libproxmox-acme-perl: 1.5.0
libproxmox-backup-qemu0: 1.4.1
libproxmox-rs-perl: 0.3.3
libpve-access-control: 8.1.3
libpve-apiclient-perl: 3.3.2
libpve-cluster-api-perl: 8.0.5
libpve-cluster-perl: 8.0.5
libpve-common-perl: 8.1.1
libpve-guest-common-perl: 5.0.6
libpve-http-server-perl: 5.0.6
libpve-network-perl: 0.9.6
libpve-rs-perl: 0.8.8
libpve-storage-perl: 8.1.4
libspice-server1: 0.15.1-1
lvm2: 2.03.16-2
lxc-pve: 5.0.2-4
lxcfs: 5.0.3-pve4
novnc-pve: 1.4.0-3
proxmox-backup-client: 3.1.5-1
proxmox-backup-file-restore: 3.1.5-1
proxmox-kernel-helper: 8.1.0
proxmox-mail-forward: 0.2.3
proxmox-mini-journalreader: 1.4.0
proxmox-widget-toolkit: 4.1.5
pve-cluster: 8.0.5
pve-container: 5.0.9
pve-docs: 8.1.5
pve-edk2-firmware: 4.2023.08-4
pve-firewall: 5.0.3
pve-firmware: 3.9-2
pve-ha-manager: 4.0.3
pve-i18n: 3.2.1
pve-qemu-kvm: 8.1.5-4
pve-xtermjs: 5.3.0-3
qemu-server: 8.1.1
smartmontools: 7.3-pve1
spiceterm: 3.3.0
swtpm: 0.8.0+pve1
vncterm: 1.8.0
zfsutils-linux: 2.2.3-pve1
Other information:
I have two 240gb ssds in a zfs mirror for the host and three 8Tb HDDs in raidz1 for general storage, which all have no SMART errors.
The average IO delay reported by Proxmox is less than 1% (I stopped a lot because of this issue) with CPU at around 1%. When running backups it is around 10% io delay with CPU at around 5%.
I am running PBS is in an lxc, it is not backing itself up. PBS has access to a directory on an extra HDD via bind mounts, this hdd is only used for the backups from pbs.
Too little ram I had found online as a potential issue but I looked at the ram consumption just before the lockups and it was only reporting 24 (including arc cache) out of 32gb, so I presumed that that would be okay.
If you have any other troubleshooting ideas or ways to find the underlying issue here, I am happy to try them. Thanks for any help in any case, much appreciated
!