Slow io and high io waits

chrisu

Renowned Member
Jun 5, 2012
41
0
71
Hello,

I am still quarreling around with some wired io performance issues where I could not find any likly issue match in this forum.
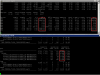
Since Proxmox 4.4 or so (now running Proxmox 5) the disk io of our seems to be incredible bad. iostat show that the disk with the zfs pools for our vms drop to a few MB throughput while the wait time increase. we are using a z2 raid build with four disks (Enterprise SATA disk) in combination with SSDs for ZIL and ARC2.

avg-cpu: %user %nice %system %iowait %steal %idle
15.55 0.00 7.84 33.38 0.00 43.24

Device: rrqm/s wrqm/s r/s w/s rkB/s wkB/s avgrq-sz avgqu-sz await r_await w_await svctm %util
sda 0.00 0.00 38.00 603.00 2308.00 2708.00 15.65 4.52 3.78 26.74 2.33 1.56 100.00
sdb 0.00 0.00 40.00 608.00 1652.00 2724.00 13.51 5.68 4.47 34.70 2.48 1.54 100.00
sdc 0.00 0.00 0.00 0.00 0.00 0.00 0.00 0.00 0.00 0.00 0.00 0.00 0.00
sdd 0.00 0.00 0.00 0.00 0.00 0.00 0.00 0.00 0.00 0.00 0.00 0.00 0.00
sde 0.00 0.00 67.00 66.00 0.00 536.00 8.06 0.05 0.39 0.78 0.00 0.39 5.20
sdf 0.00 0.00 67.00 85.00 0.00 2516.00 33.11 0.08 0.55 1.07 0.14 0.53 8.00
sdg 0.00 0.00 30.00 607.00 1228.00 2720.00 12.40 4.88 4.23 41.73 2.37 1.57 100.00
sdh 0.00 0.00 26.00 608.00 936.00 2728.00 11.56 4.51 3.78 41.08 2.18 1.56 99.20

Know that this setup will not be the fastest, I would still expect it to give some io throughput of 30-40 MB per second.

Sometime the io speed increases to the expected value for some seconds / minutes but falls down again.

Any ideas what is happening or to look at for this issue?

Every help is welcome!

Thank you and greeting Chris
 
two remarks:
* remember you have to the wkB/s numbers on all your disks to get the throughput of your raid Z2 setup. Or use zpool iostat
* during normal VMs use, you have a workflow which is rather a mix of random read and writes, like load from the disk the /bin/ls binary from that sectors, write the bash_history to that other sector, write the apache logs to another sector, etc.,
So you cannot really compare the numbers you see to a total write sequential throughput.

If you want to have write sequential throughput we can compare to, you should shutdown all your VMs, and make a benchmark with fio.

fio --filename=/dev/path_to_my_zvol --size=9G --bs=64k --rw=write --runtime=60 --name=64kwrite --group_reporting'
 
  • Like
Reactions: chrone
Thanks for the feedback Manu,

I have taken that iostat snapshot to see, if only one disk is suffering io problems. But what I saw is that all pool member disk are suddenly facing high wait times with extremely low throughput. zpool iostat is showing similar results (two drives of 4 sum up to the total throughput of the pool) with an overall low throughput.
I have no idea what causes this delays or bottlenecks.

I really wonder why the throughput ant the utilization vary that much and if there is a way to find out what is causing this. Is the io caused by different processes? Or is there some problem with the controller maybe?
Any idea how to get closer to the root cause? I would expect, that write operations are caught by the SSD for ZIL and read should be supported by ARC2 or ARC. Having 40% IO wait time is a little bit to high.

The following pictures illustrates a phase of bad performance followed by good performance.
bad performance.png
good performance.png
Thank and greetings
Chris
 

Attachments

  • bad performance.png
    bad performance.png
    41.6 KB · Views: 22
Last edited:
I hope you do know that raidz is the worst choice for a vm datastore (random io). also scrub and resilvering will take forever
it's good for space efficiency and sequential writes but read perf is abysmal 'cause you get the IOPS from the slowest drive in your vdev

I don't know how much RAM you have but also hope you know that the index for the l2arc is stored in your arc and cannot be used for caching anymore
if a read io isn't hitting the arc in general it will also not get into the l2arc - 'cause as the name suggests it is just an extended arc
so l2arc only makes sense when you've a lot of ram and know that read io will be a lot

and did you use the same hd for l2arc and for a partition in the slog ?

but of course it is also important what the vm's are doing since time X where your problem appeared
 
Hello,

thank for the feedback. Sure I know that raidz (like normal parity RAID do to) is always bound to the slowest device when doing write ios. From the read ios point of view RAIDs could give some kind of performance increase as you do not need to read all drives to complete the read request. But parity is always a trade-off between performance vs safety. So it is easy to figure out, if a drive is slowing down the array, because it will show much higher io times compared to the others. Here I am seeing that all drive seem to get slow. So it seems not be a problem with single drive. ARC2 is nearly unused.
When doing backups to a remove NFS storage, the performance is extremely volatile too.
I would be good to some hard facts or measurement to get closer to the bottleneck (io caused by a VM, disk latency, controller issue,....)

Thank you for your help.

Greeting Chris
 
Hello,
I got some updates. acrstats shows io errors and bad checksums for L2ARC.

cat /proc/spl/kstat/zfs/arcstats
6 1 0x01 91 4368 2512048036 3392252486704591
name type data
hits 4 6567751182
misses 4 3301464253
demand_data_hits 4 3205362248
demand_data_misses 4 290058160
demand_metadata_hits 4 3089293010
demand_metadata_misses 4 75689917
prefetch_data_hits 4 256425428
prefetch_data_misses 4 2920129378
prefetch_metadata_hits 4 16670496
prefetch_metadata_misses 4 15586798
mru_hits 4 5098217078
mru_ghost_hits 4 182866203
mfu_hits 4 1212542706
mfu_ghost_hits 4 12077652
deleted 4 3109273662
mutex_miss 4 29494418
evict_skip 4 374010515869
evict_not_enough 4 3042927686
evict_l2_cached 4 6266366573568
evict_l2_eligible 4 19635579048448
evict_l2_ineligible 4 2803814236160
evict_l2_skip 4 66175019
hash_elements 4 10272377
hash_elements_max 4 12030165
hash_collisions 4 2476598410
hash_chains 4 2901224
hash_chain_max 4 12
p 4 718347820
c 4 3348861646
c_min 4 33554432
c_max 4 10737418240
size 4 3324166144
hdr_size 4 155446584
data_size 4 1946310656
metadata_size 4 115639296
other_size 4 81990424
anon_size 4 9080320
anon_evictable_data 4 0
anon_evictable_metadata 4 0
mru_size 4 320808960
mru_evictable_data 4 267143680
mru_evictable_metadata 4 5549568
mru_ghost_size 4 2734227968
mru_ghost_evictable_data 4 2883584
mru_ghost_evictable_metadata 4 2731344384
mfu_size 4 1732060672
mfu_evictable_data 4 1671410688
mfu_evictable_metadata 4 15991296
mfu_ghost_size 4 30474240
mfu_ghost_evictable_data 4 27574272
mfu_ghost_evictable_metadata 4 2899968
l2_hits 4 43155069
l2_misses 4 2199791404
l2_feeds 4 2676249
l2_rw_clash 4 4332
l2_read_bytes 4 427991935488
l2_write_bytes 4 5672238861824
l2_writes_sent 4 2144893
l2_writes_done 4 2144893
l2_writes_error 4 0
l2_writes_lock_retry 4 1719
l2_evict_lock_retry 4 1267
l2_evict_reading 4 357
l2_evict_l1cached 4 1260246
l2_free_on_write 4 12227544
l2_cdata_free_on_write 4 4926
l2_abort_lowmem 4 624
l2_cksum_bad 4 1496
l2_io_error 4 126
l2_size 4 82528701440
l2_asize 4 81349441536
l2_hdr_size 4 1024779184
l2_compress_successes 4 9955601
l2_compress_zeros 4 0
l2_compress_failures 4 60
memory_throttle_count 4 0
duplicate_buffers 4 0
duplicate_buffers_size 4 0
duplicate_reads 4 0
memory_direct_count 4 2486418
memory_indirect_count 4 53197893
arc_no_grow 4 0
arc_tempreserve 4 0
arc_loaned_bytes 4 0
arc_prune 4 0
arc_meta_used 4 1377855488
arc_meta_limit 4 6442450944
arc_meta_max 4 10087226312
arc_meta_min 4 16777216
arc_need_free 4 0
arc_sys_free 4 1053757440

It seems more an more to become an hardware issue. I could not find an option to reset the statistics. Is there a way to reset the counters?

Greetings

Chris
 
I got some updates. acrstats shows io errors and bad checksums for L2ARC
I would rather do a smartctl on the disks then believing arcstats which would be new for me that it gets info from hw errors - but who knows

It seems more an more to become an hardware issue. I could not find an option to reset the statistics. Is there a way to reset the counters?
only reboot

Since Proxmox 4.4 or so (now running Proxmox 5) the disk io of our seems to be incredible bad

so before >4.4 there were no problems at all and you didn't change any hardware or added additional vm's or whatever ?
 
Is there a writeup on performance best practices when using ZFS instead of ext4. I seem to remember someone saying to use writeback instead of Default (no cache) for the VM disks but now I can't find it.
https://pve.proxmox.com/wiki/Performance_Tweaks does a good job explaining the options and the cost/benefits of each but I'm wondering if that applies equally to ZFS setups or if it was more geared to ext4 and if so what are the differences for ZFS setups?

Thanks,
Jon
 
so before >4.4 there were no problems at all and you didn't change any hardware or added additional vm's or whatever ?

Hello,

I have setup this host with PVE 4.3. and it was running smooth. From the update to 4.4 on the problems started. First I was facing really bad time drifts and the VMs got extremly slow (especially during backup). Did some tuning but it didn't solve the time problem. Finally the VMs are now syncing every two minutes with a time server. I upgraded to PVE 5 but it didn't change a thing. Time drifts still appear and the VMs keep to have a bad responsiveness (again especially during backup). But the io problem appear as soon as the is some disk io load. To slow down the whole host a simple reboot of one Windows VM is enough. The picture from iostat or zfs iostat is nearly the same in every scenario. disk util goes to 100% and throughput throttles to a few MB/s. In phases of good responsiveness with high load disk utilization is about 80% an the throughout per disk is between 45 to 80 MB/s (some time more). I had a similar problem years ago with nexenta store. One bad disk interface simple caused the whole controller to get stuck. In that case one disk showed io errors and much higher delays as the others which where effected by the irritated controller too. So it was easy to replace the disk and its cable and the problem gone.
In the current situation I cannot see any indicators for a specific device causing the problems.
Going through the forums showed that there are a lot of people quarreling with timing issues since PVE4.4. So thats all some kind confusing.

I guess I will try to replace all SATA cables as a try.

Thanks for all the feedback and greetings,

Chris
 
Try to replace your sata cables. But for sure is a hardware problem: PSU, cables, bad RAM.

Hi,

thank you for your tips. I am going to replace the cables in a first step and will report back. But this will that some days as I am not on site. Memory should not be an issue as the system is built with ECC ram. PSU I guess would be an issue if it is not able to deliver constant power to the devices. This should not be cases as the PSU is fully redundant and each unit is nominal able to deliver the needed power.

Thank you!

Greetings,

Christoph

so smartctl didn't report any errors ?
did you update firmware of raid controller maybe there is a problem with the new kernel ?
did you check virt io drivers ?
 
so smartctl didn't report any errors ?
did you update firmware of raid controller maybe there is a problem with the new kernel ?
did you check virt io drivers ?

Hi,
smartctl doesn't show any errors, firmware should be up to date (using the onboard 8x Sata Controller). I stopped using the virio drivers as they cause time drifts.

I checked cabling an could not find any issues. Strange thing. I am think of moving some VMs to an external storage to compare performance. In the actual situation 1GB should deliver more performance than the local zfs storage.

Thank for help an ideas.

Greetings Chris
 
Don't try to find fleas where they are not.

How old your ZFS pool is ? The more data is rewrite more data is fragmented due COW. ZFS reads not only data but and metadata.

Solution #1? MORE MORE MORE ARC

I have the same problem. After server reboot its take 1-2 hours to start all VM with they software. HDD activity is 100% and its not the RAM, CPU or cable problem.

Solution #2? ZFS cannot defragment data (for now). You have to recreate pool to get back normal performance.

My experiment. I have one zvol (8k volblocksize) and cloned to new zvol (128k volblocksize) with #dd and the usage is different.
First one used 48.5G and the new one 36.3G. As you can see in the time zvol become fragmented and use more disk space = require more IO
 
BTW ZFS calculator says RaidZ2 with 4 disk have 3.125% allocation overhead
 

Attachments

  • ZFS overhead calc.ods.zip
    39 KB · Views: 32
Don't try to find fleas where they are not.

How old your ZFS pool is ? The more data is rewrite more data is fragmented due COW. ZFS reads not only data but and metadata.

Solution #1? MORE MORE MORE ARC

I have the same problem. After server reboot its take 1-2 hours to start all VM with they software. HDD activity is 100% and its not the RAM, CPU or cable problem.

Solution #2? ZFS cannot defragment data (for now). You have to recreate pool to get back normal performance.

My experiment. I have one zvol (8k volblocksize) and cloned to new zvol (128k volblocksize) with #dd and the usage is different.
First one used 48.5G and the new one 36.3G. As you can see in the time zvol become fragmented and use more disk space = require more IO

Thanks for the answer. I was thinking of the fact that ZFS is COW, shouldn't address the fragmentation issue? Would be interesting in to get some methods to analyze, if fragmentation could be cause.

Greetings

Chris
 
If you can turn off VM for some time try to do:

1. Make read test inside VM
2. Stop VM
3. Rename ZFS zvol ( #zfs rename zfs_pool/pve/vm-xxx-disk-1 zfs_pool/pve/vm-xxx-disk-1_old )
4. Create new ZFS zvol ( #zfs create -V sizeG zfs_pool/pve/vm-xxx-disk-1 )
5. Clone zvol ( #dd if=/dev/zvol/zfs_pool/pve/vm-xxx-disk-1_old of=/dev/zvol/zfs_pool/pve/vm-xxx-disk-1 )
6. Look at the size of new and old zvol
7. Start VM look does it become faster than before
Hello,

shouldn't a vm move/clone between different pools do the same thing?

Greetings Chris
 

About

The Proxmox community has been around for many years and offers help and support for Proxmox VE, Proxmox Backup Server, and Proxmox Mail Gateway.
We think our community is one of the best thanks to people like you!

Get your subscription!

The Proxmox team works very hard to make sure you are running the best software and getting stable updates and security enhancements, as well as quick enterprise support. Tens of thousands of happy customers have a Proxmox subscription. Get yours easily in our online shop.

Buy now!