Slow Backup/restore Speed on PBS

Apr 1, 2021
14
2
3
46
Hallo,
We run a 14 Node Proxmox Cluster (6.3.3) with an attached 7 Node Ceph Cluster (Nautilus 14.2.16) as Storage. Our Promox Backup Server (1.0.8 but tried also with 1.0.11) runs as Baremetal inside the Proxmox Cluster with a ca. 70TiB ZFS as Backupstorage (128GB Memory, has read+write cache SSDs). Everything is connected with 10GB network.

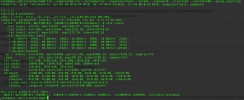
here is a actual write benchmark test from one of the Nodes to the Backupstorage:

proxmox-backup-client benchmark --repository root@pam@10.10.5.6:datastore
1617268485164.png

an rbd export test shows:
1617268699265.png


but Backup speed is compared to those numbers - slow:
1617268747099.png

any ideas where the problem might be ?

thanks in advance!
 
  • Like
Reactions: scasrl
how fast is your backup storage (for random access)? what kind of pool is it?
 
Code:
root@pve06:~# zpool status -v backup
  pool: backup
 state: ONLINE
  scan: scrub repaired 0B in 0 days 14:41:04 with 0 errors on Sun Mar 14 15:05:06 2021
config:

        NAME                        STATE     READ WRITE CKSUM
        backup                      ONLINE       0     0     0
          mirror-0                  ONLINE       0     0     0
            scsi-2001b4d20594d3b83  ONLINE       0     0     0
            scsi-2001b4d20bb09162b  ONLINE       0     0     0
          mirror-1                  ONLINE       0     0     0
            scsi-2001b4d204af52ea5  ONLINE       0     0     0
            scsi-2001b4d203bf1bdf4  ONLINE       0     0     0
          mirror-2                  ONLINE       0     0     0
            scsi-2001b4d20458efc5d  ONLINE       0     0     0
            scsi-2001b4d20cb081513  ONLINE       0     0     0
          mirror-3                  ONLINE       0     0     0
            scsi-2001b4d201487ec1d  ONLINE       0     0     0
            scsi-2001b4d20d44038dd  ONLINE       0     0     0
          mirror-4                  ONLINE       0     0     0
            scsi-2001b4d20038272af  ONLINE       0     0     0
            scsi-2001b4d20b2f02278  ONLINE       0     0     0
          mirror-5                  ONLINE       0     0     0
            scsi-2001b4d20768779cd  ONLINE       0     0     0
            scsi-2001b4d20cd8bc2c7  ONLINE       0     0     0
          mirror-6                  ONLINE       0     0     0
            scsi-2001b4d20c1d7c83d  ONLINE       0     0     0
            scsi-2001b4d205719b533  ONLINE       0     0     0
          mirror-7                  ONLINE       0     0     0
            scsi-2001b4d20479f7de2  ONLINE       0     0     0
            scsi-2001b4d20b950c15e  ONLINE       0     0     0
          mirror-8                  ONLINE       0     0     0
            scsi-2001b4d20ddc3c58f  ONLINE       0     0     0
            scsi-2001b4d2024997f7e  ONLINE       0     0     0
          mirror-10                 ONLINE       0     0     0
            scsi-2001b4d20fb6971c5  ONLINE       0     0     0
            scsi-2001b4d2030e1bc95  ONLINE       0     0     0
        logs
          mirror-9                  ONLINE       0     0     0
            scsi-2001b4d206c21d309  ONLINE       0     0     0
            scsi-2001b4d206ff145c8  ONLINE       0     0     0
        cache
          scsi-2001b4d207f25cbb4    ONLINE       0     0     0
          scsi-2001b4d20b8df435f    ONLINE       0     0     0

errors: No known data errors

Mirrors = SATA (20x 8TB), Logs+Cache = SSDs (4x 1TB)


#######################################
Fio Random Write test on NFS Export of ZFS Pool Backup from Prx Node to Storage Node:

Code:
fio --name=randwrite --rw=randwrite --direct=1 --ioengine=libaio --bs=64k --numjobs=8 --size=512m --runtime=600 --group_reporting

Jobs: 8 (f=8): [w(8)][100.0%][w=197MiB/s][w=3153 IOPS][eta 00m:00s]
randwrite: (groupid=0, jobs=8): err= 0: pid=18806: Wed Apr  7 09:59:21 2021
  write: IOPS=4073, BW=255MiB/s (267MB/s)(4096MiB/16089msec); 0 zone resets
    slat (usec): min=7, max=118, avg=15.07, stdev= 3.96
    clat (usec): min=324, max=457464, avg=1945.55, stdev=11857.83
     lat (usec): min=335, max=457481, avg=1960.85, stdev=11858.32
    clat percentiles (usec):
     |  1.00th=[   465],  5.00th=[   515], 10.00th=[   545], 20.00th=[   586],
     | 30.00th=[   627], 40.00th=[   660], 50.00th=[   693], 60.00th=[   725],
     | 70.00th=[   775], 80.00th=[   832], 90.00th=[   947], 95.00th=[  1205],
     | 99.00th=[ 38011], 99.50th=[ 90702], 99.90th=[170918], 99.95th=[217056],
     | 99.99th=[455082]
   bw (  KiB/s): min=  512, max=81792, per=12.38%, avg=32271.66, stdev=26581.76, samples=256
   iops        : min=    8, max= 1278, avg=504.23, stdev=415.34, samples=256
  lat (usec)   : 500=3.53%, 750=62.11%, 1000=26.33%
  lat (msec)   : 2=4.60%, 4=0.94%, 10=0.50%, 20=0.62%, 50=0.49%
  lat (msec)   : 100=0.47%, 250=0.39%, 500=0.01%
  cpu          : usr=0.34%, sys=0.92%, ctx=65610, majf=0, minf=91
  IO depths    : 1=100.0%, 2=0.0%, 4=0.0%, 8=0.0%, 16=0.0%, 32=0.0%, >=64=0.0%
     submit    : 0=0.0%, 4=100.0%, 8=0.0%, 16=0.0%, 32=0.0%, 64=0.0%, >=64=0.0%
     complete  : 0=0.0%, 4=100.0%, 8=0.0%, 16=0.0%, 32=0.0%, 64=0.0%, >=64=0.0%
     issued rwts: total=0,65536,0,0 short=0,0,0,0 dropped=0,0,0,0
     latency   : target=0, window=0, percentile=100.00%, depth=1

Run status group 0 (all jobs):
  WRITE: bw=255MiB/s (267MB/s), 255MiB/s-255MiB/s (267MB/s-267MB/s), io=4096MiB (4295MB), run=16089-16089msec
root@prx01:/mnt/pve/backuptest10#


###################################
Fio random read test on NFS Export of ZFS Pool Backup from Prx Node to Storage Node

Code:
fio --name=randread --rw=randwrite --direct=1 --ioengine=libaio --bs=64k --numjobs=8 -
-size=512m --runtime=600 --group_reporting

Jobs: 8 (f=8): [w(8)][100.0%][w=491MiB/s][w=7855 IOPS][eta 00m:00s]
randread: (groupid=0, jobs=8): err= 0: pid=22153: Wed Apr  7 10:01:31 2021
  write: IOPS=4242, BW=265MiB/s (278MB/s)(4096MiB/15447msec); 0 zone resets
    slat (nsec): min=7739, max=98143, avg=14860.35, stdev=3768.92
    clat (usec): min=364, max=383821, avg=1833.94, stdev=10370.58
     lat (usec): min=378, max=383836, avg=1849.02, stdev=10371.04
    clat percentiles (usec):
     |  1.00th=[   465],  5.00th=[   515], 10.00th=[   545], 20.00th=[   594],
     | 30.00th=[   627], 40.00th=[   660], 50.00th=[   693], 60.00th=[   734],
     | 70.00th=[   783], 80.00th=[   848], 90.00th=[   971], 95.00th=[  1270],
     | 99.00th=[ 35914], 99.50th=[ 63177], 99.90th=[120062], 99.95th=[225444],
     | 99.99th=[383779]
   bw (  KiB/s): min=  768, max=88192, per=12.83%, avg=34827.21, stdev=28972.91, samples=240
   iops        : min=   12, max= 1378, avg=544.12, stdev=452.73, samples=240
  lat (usec)   : 500=3.41%, 750=60.26%, 1000=27.35%
  lat (msec)   : 2=5.26%, 4=0.74%, 10=0.69%, 20=0.74%, 50=0.81%
  lat (msec)   : 100=0.57%, 250=0.13%, 500=0.05%
  cpu          : usr=0.39%, sys=0.93%, ctx=65607, majf=0, minf=88
  IO depths    : 1=100.0%, 2=0.0%, 4=0.0%, 8=0.0%, 16=0.0%, 32=0.0%, >=64=0.0%
     submit    : 0=0.0%, 4=100.0%, 8=0.0%, 16=0.0%, 32=0.0%, 64=0.0%, >=64=0.0%
     complete  : 0=0.0%, 4=100.0%, 8=0.0%, 16=0.0%, 32=0.0%, 64=0.0%, >=64=0.0%
     issued rwts: total=0,65536,0,0 short=0,0,0,0 dropped=0,0,0,0
     latency   : target=0, window=0, percentile=100.00%, depth=1

Run status group 0 (all jobs):
  WRITE: bw=265MiB/s (278MB/s), 265MiB/s-265MiB/s (278MB/s-278MB/s), io=4096MiB (4295MB), run=15447-15447msec
root@prx01:/mnt/pve/backuptest10#
 
is the PBS datastore directly on ZFS or also accessed via NFS? what does the PBS client benchmark command report when run directly on the PBS server?
 
so you have a theoretical max throughput of 264MB/s (neither your server's hashing performance, nor your ZFS pools random write performance is higher than that). in practice you seem to be getting 70MB/s.

how is the random read performance inside the VM? how is the backup performance when you run backups in parallel from multiple nodes? how is it when you generate random file (e.g., a few GB worth of /dev/urandom into a tmpfs) and back that up directly using proxmox-backup-client? how is the load on the PBS server side during a backup (CPU & disks)?
 
  • Like
Reactions: guletz
yes, around 240-270MiB/s is what im expecting with this ZFS and old CPU im using on the PBS.

################
Random read and write inside VM:

which VM?


################
Backup parallel performance from multiple nodes:

The Speed dropped on all parallel Backups tried 3 Nodes parallel:

1617785782173.png


################
Random File - direct pbs backup:

Load on PBS (8 Cores,):
Load is Hardly over 3, averages at 1.8,
in iftop you read the MiB/s the Proxmox Status Windows shows (20-50MiB/s),

heres iotop while backup is running (what you see is pretty much the average +/- a bit):
1617786266210.png
vmstat shows no swapping
 
yes, around 240-270MiB/s is what im expecting with this ZFS and old CPU im using on the PBS.

################
Random read and write inside VM:

which VM?

one using the same storage as your logs so far ;)

################
Backup parallel performance from multiple nodes:

The Speed dropped on all parallel Backups tried 3 Nodes parallel:

View attachment 25065

so this confirms there really is a bottle neck, and it's not lack of IO depth..

################
Random File - direct pbs backup:

Load on PBS (8 Cores,):
Load is Hardly over 3, averages at 1.8,
in iftop you read the MiB/s the Proxmox Status Windows shows (20-50MiB/s),

that is kinda surprising - did you put the random file on a tmpfs? how big was it? if this was from memory to PBS, then either your client system is really slow at hashing, or the bottle neck is the server/ZFS end..

heres iotop while backup is running (what you see is pretty much the average +/- a bit):
View attachment 25066
vmstat shows no swapping
you didn't give concrete models for you disks, but here we have a few with 60-80 writes/s, which might already be the limit for those disks if they are 7.2k or 5.4k spinners..
 
how is the random read performance inside the VM? how is the backup performance when you run backups in parallel from multiple nodes? how is it when you generate random file (e.g., a few GB worth of /dev/urandom into a tmpfs) and back that up directly using proxmox-backup-client? how is the load on the PBS server side during a backup (CPU & disks)?
Hi,

@fabian try to figure out if your problem is on your VMs side or not, because on pbs side it seems to be ok.

So try to do this test as he told you.

Good luck / Bafta !
 
Inside VM:
Random write with Fio to the ZFS Backup Storage
Run status group 0 (all jobs):
WRITE: bw=277MiB/s (291MB/s), 277MiB/s-277MiB/s (291MB/s-291MB/s), io=4096MiB (4295MB), run=14772-14772msec

iostat on the ZFS while writing:
1617791148680.png

Random readwith Fio to the ZFS Backup Storage
Run status group 0 (all jobs):
READ: bw=748MiB/s (784MB/s), 748MiB/s-748MiB/s (784MB/s-784MB/s), io=4096MiB (4295MB), run=5479-5479msec

iostat on the ZFS while reading
1617791233342.png


The same storage was previously used with rbd incremental snapshots (eve4barc) (of course its something else then chunks) and has reached steady 240+ MiB/s

Disks are all Seagate Ironwolf, 8TB, 7200u/min, 256MB Cache, SATA 6 Gb/s
 
that's trivial to find out - just do a backup of a VM not stored on Ceph?

################
Random File - direct pbs backup:

Load on PBS (8 Cores,):
Load is Hardly over 3, averages at 1.8,
in iftop you read the MiB/s the Proxmox Status Windows shows (20-50MiB/s),

that is kinda surprising - did you put the random file on a tmpfs? how big was it? if this was from memory to PBS, then either your client system is really slow at hashing, or the bottle neck is the server/ZFS end..

you didn't reply to this - if a backup from memory/tmpfs is slow, then it can't really be Ceph as source that is at fault?
 
Same/similar problem in my setup ... Proxmox VE nodes connected with 10 Gbit NICs (10 Gbit tested by iperf) ... proxmox-backup-client benchmark shows 250 MB/s TLS-speed ... backups to Proxmox Backup Server "only" in the area of 70-80 MB/s ...

Bildschirmfoto 2021-04-08 um 17.13.50.png

... one (interesting) point ... at the end of the backup process read speed increases dramatically (perhaps due to the unused blocks in the disk image of the vm?)

Bildschirmfoto 2021-04-08 um 17.09.50.png
 
Last edited:
One more information:

My Proxmox Backup Server is running inside a VM (on a Proxmox VE node) ... backup data is residing on a TrueNas device (connected over 10 GBit per CIFS share). I run fio benchmark on the Proxmox Server (on the CIFS share) once with "--direct=1" flag ... 80 MB/s ...

Bildschirmfoto 2021-04-08 um 17.45.36.png

... and once without "--direct=1" ... 330 MB/s

Bildschirmfoto 2021-04-08 um 17.37.59.png
 

Attachments

  • Bildschirmfoto 2021-04-08 um 17.37.59.png
    Bildschirmfoto 2021-04-08 um 17.37.59.png
    716.3 KB · Views: 2
Last edited:
One more information:

My Proxmox Backup Server is running inside a VM (on a Proxmox VE node) ... backup data is residing on a TrueNas device (connected over 10 GBit per CIFS share). I run fio benchmark on the Proxmox Server (on the CIFS share) once with "--direct=1" flag ... 80 MB/s ...

View attachment 25101

... and once without "--direct=1" ... 330 MB/s

View attachment 25100
the second one likely benchmarks your cache (data size is only 4G).
 
Testing with a VM on another Storage (full SSD, no ceph) with 2x10GB NIC, was slightly better but not good (was more like ~80MiBs read/write):

1618293515219.png

Network is ok:
1618293555911.png
and vice-versa:
1618293577464.png


Back to testing:

fio --rw=readwrite --name=testrand --size=5G --direct=1 --bs=64k --rwmixread=50
(read and write test, without Memory, Blocksize 64k read/write ratio 50/50)

shows:
1618294594773.png

only ~80MiBs !

while the same with 1024k Blocksize (fio --rw=readwrite --name=testrand --size=5G --direct=1 --bs=1024k --rwmixread=50) shows:
1618294679226.png

What Blocksize does pbs use? is there a posibility to change it - for testing issues?
 

About

The Proxmox community has been around for many years and offers help and support for Proxmox VE, Proxmox Backup Server, and Proxmox Mail Gateway.
We think our community is one of the best thanks to people like you!

Get your subscription!

The Proxmox team works very hard to make sure you are running the best software and getting stable updates and security enhancements, as well as quick enterprise support. Tens of thousands of happy customers have a Proxmox subscription. Get yours easily in our online shop.

Buy now!