Show more VM/LXC stats in cluster overview

DerDanilo

Renowned Member
Jan 21, 2017
477
135
83
It would be really nice to see the stats of the VMs and LXC Containers in der Node and/or cluster overview.

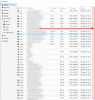
Average/Max/Min usage for all details that are seen per instance:
2017-11-20_19h57_45-png.6297


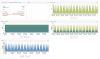
They could be shown in the overview for example:

2017-11-20_19h59_51-png.6299


On the other hand it would also be nice if the graphs were shown for "selected" VMs/LXC Containers.
It might make sense to only show graps when the user wants to see them.

Otherwise the overview could show mini graps that give an overall overview of how all systems use available ressources over time.

I am not asking for a full stats displaying solution, but to display data in the already quiet nice GUI that was collected already.

Thanks!
 

Attachments

  • 2017-11-20_19h57_45.png
    2017-11-20_19h57_45.png
    208.6 KB · Views: 155
  • 2017-11-20_19h59_51.png
    2017-11-20_19h59_51.png
    204.5 KB · Views: 155
sadly this is easier said than done, because the information in that grid is replicated cluster wide with the pmxcfs and polled every few seconds
so if we would add all the graph data in there, this would have a major impact on cluster operation and site useability
 
That makes sense. Would it be possible to at least give the table some more information to be shown on cluster level?
 
in case you did not know: there are several columns hidden by default; they can be shown by clicking the down-arrow besides a column
in case you did already know about that: which information do you miss ?
 
Could you add the "average" values to this view as well?
what 'average' do you mean? we do not save a single average value for either hour/day/etc..
those values are all in rrd databases and saved for a time interval

but if you want more detailed monitoring, i would recommend to use something built for it, like nagios,incinga or something like that

also we support exporting to exernal metric servers (graphite and influxdb) with that and e.g., grafana you can
build dashboards and overviews as complicated as you wish :)
(see https://pve.proxmox.com/wiki/External_Metric_Server)
 
Well. Grafana is the long term solution but there is no project out there that provides and updates Grafana dashboards for this.
I found https://grafana.com/dashboards/1147. But who guarantees that this continues working in future?

Currently I have no time to continue supporting this.
 
Well. Grafana is the long term solution but there is no project out there that provides and updates Grafana dashboards for this.
I found https://grafana.com/dashboards/1147. But who guarantees that this continues working in future?
what i meant is that you setup your own monitoring and customize it for your needs, i think that any monitoring/graphing solution needs customization/tweaking

but as for our output format, since this comes from the api, it should only change if we change the api (which we seldom do, and mostly in a non-breaking way)
 

About

The Proxmox community has been around for many years and offers help and support for Proxmox VE, Proxmox Backup Server, and Proxmox Mail Gateway.
We think our community is one of the best thanks to people like you!

Get your subscription!

The Proxmox team works very hard to make sure you are running the best software and getting stable updates and security enhancements, as well as quick enterprise support. Tens of thousands of happy customers have a Proxmox subscription. Get yours easily in our online shop.

Buy now!