Restore stuck at 100%

zpeters

New Member
Jul 2, 2020
3
0
1
46
i'm new here, I apologize if this has been asked/answered before.

I have recently backed up a bunch of vms over NFS. Reviewed all of the logs to confirm they completed successfully

When i try to restore the file through the gui to will start the process and get to 100% and just sit there. It never completes, but also i do not see any errors in the syslog. Most of these VMs can be rebuilt so it isn't a life or death situation. Would just like to know what else i should troubleshoot or what might be going on.

I did a full check of the system hardware, ram and harddrive (SSD) and they all passed extensive tests successfully.

Besides being able to restore everything else seems fine.

Thank you for your help, i'm pulling my hair out here!'

* Edit *

Just tested restoring the backup file to another NFS share and that works flawlessly. Is there any reason why i would be having issues restoring locally but not to a NFS share?
 
Last edited:
Hi,
what is your pveversion -v? Could you share the backup configuration (in the GUI there's a button Show Configuration)? Just to make sure I got it right, when you select the local storage in the restore dialog (is this a directory based storage or one of the default local-lvm or local-zfs ones?) it gets stuck, but when you select a different NFS storage (or the same one) it works? Is there enough space on the local storage?
 
Hi,
Did u manage to solve your problem zpeters? this situation is happening to me too ...
please share the output of pveversion -v, the restore task log and the VM configuration from the backup. What storage are you using as a target?
 
Hi,

please share the output of pveversion -v, the restore task log and the VM configuration from the backup. What storage are you using as a target?
I used version 5.4.15, everything worked perfect! But we had to replace the machine with another identical one, just changing the disks from (5 x 600G) to (5 x 1.2T). I installed version 6, had this problem, installed version 7, same problem, went back to version 5.4.15, same problem. I use a DL380 G7 with raid5 P480i controller. I believe that if you solve for 5, it solves for the others. Because, as I said, I already installed version 6 and 7 and the problem persists
 

Attachments

  • pr13.png
    pr13.png
    42 KB · Views: 36
  • pr14.png
    pr14.png
    180.7 KB · Views: 33
  • pr15.png
    pr15.png
    25.7 KB · Views: 32
I used version 5.4.15, everything worked perfect! But we had to replace the machine with another identical one, just changing the disks from (5 x 600G) to (5 x 1.2T). I installed version 6, had this problem, installed version 7, same problem, went back to version 5.4.15, same problem. I use a DL380 G7 with raid5 P480i controller. I believe that if you solve for 5, it solves for the others. Because, as I said, I already installed version 6 and 7 and the problem persists
That rather makes it sound like an issue with the hardware/firmware/controller. I'm not saying it definitely is, but I'd check there first. The system log indicates that qemu-img is stuck (most likely on I/O because of some low-level issue).
 
That rather makes it sound like an issue with the hardware/firmware/controller. I'm not saying it definitely is, but I'd check there first. The system log indicates that qemu-img is stuck (most likely on I/O because of some low-level issue).
I've done all kinds of tests on the disks, I've changed the P410i, I've changed the raid 5 type to (1+0), the p410i's firmware is updated to the latest version 3.00. I do not know what else to do
 
Last edited:
I've done all kinds of tests on the disks, I've changed the P410i, I've changed the raid 5 type to (1+0), the p410i's firmware is updated to the latest version 3.00. I do not know what else to do
The solution I found to this problem was:

I removed the 1.2T 5 disk RAID5 via P410i and created 5 logical ones with 1.1T. In the installation of proxmox 7.1.2, I chose the option ZFS-RAID1 (RAID 5 with 3 disks or more) and it selected the 5 logical disks and created a logical disk of 4.4T and life that follows, no more errors. It is very fast. Thanks guys.
 
Hello,

So I can't see through it anymore and I hope you'll forgive me for bringing up the question again.

I have an HPE ProLiant DL380 Gen9 which should be completely sufficient in terms of performance for my application.

The problem is that it hasn't been possible to restore my backups for some time. It doesn't matter whether the backups are recent or older, and it doesn't matter whether the backups were created on the DL380 or another computer.

The backup process always runs to 100% in the information window and then it gets stuck there.

During my research I found several potential indications of already known problems.

But I just can't see which ones could be relevant to me.

For example, there is a theory that the HW RAID controller could have something to do with it.
But I have deactivated all RAID features and the disks should be passed directly to the OS (PVE).

There is also the theory that the RAID controller needs a battery. Mine has a battery anyway. Some claim that it is only really relevant in RAID mode.

Then there are reports from Gen8 that some bugs arose with the switch from PVE 6 to PVE 7.

That could coincide in terms of timing and Gen8 and Gen9 are very similar. There are also reports of very slow SAS performance, which could also be related.

Then there is this kernel patch...
It seems to have something to do with the PCIe passthrough (which I have no problems with) and is also older but maybe there is a link?

How can I narrow down the problem?

Which of the known DL380 problems could have anything to do with mine?

Thanks a lot!

Specs:
ProLiant DL380 Gen9
2x Xeon(R) CPU E5-2690 v4
256GB RAM
1737966909986.png
PVE 8.2.8
Linux 6.8.12-2-pve (2024-09-05T10:03Z)
System Boot SSD and all other data disks/SSDs are connected over P840 SAS Controller
 
Hi,
Hello,

So I can't see through it anymore and I hope you'll forgive me for bringing up the question again.

I have an HPE ProLiant DL380 Gen9 which should be completely sufficient in terms of performance for my application.

The problem is that it hasn't been possible to restore my backups for some time. It doesn't matter whether the backups are recent or older, and it doesn't matter whether the backups were created on the DL380 or another computer.

The backup process always runs to 100% in the information window and then it gets stuck there.

During my research I found several potential indications of already known problems.

But I just can't see which ones could be relevant to me.

For example, there is a theory that the HW RAID controller could have something to do with it.
But I have deactivated all RAID features and the disks should be passed directly to the OS (PVE).

There is also the theory that the RAID controller needs a battery. Mine has a battery anyway. Some claim that it is only really relevant in RAID mode.

Then there are reports from Gen8 that some bugs arose with the switch from PVE 6 to PVE 7.

That could coincide in terms of timing and Gen8 and Gen9 are very similar. There are also reports of very slow SAS performance, which could also be related.

Then there is this kernel patch...
It seems to have something to do with the PCIe passthrough (which I have no problems with) and is also older but maybe there is a link?

How can I narrow down the problem?

Which of the known DL380 problems could have anything to do with mine?

Thanks a lot!

Specs:
ProLiant DL380 Gen9
2x Xeon(R) CPU E5-2690 v4
256GB RAM
View attachment 81424
PVE 8.2.8
Linux 6.8.12-2-pve (2024-09-05T10:03Z)
System Boot SSD and all other data disks/SSDs are connected over P840 SAS Controller
please share the full restore task log, the backed-up configuration as well as the system logs/journal from around the time of the restore operation. What does ps faxl show that the task is doing when it's stuck?
 
Hi,

please share the full restore task log, the backed-up configuration as well as the system logs/journal from around the time of the restore operation. What does ps faxl show that the task is doing when it's stuck?
Thanks for the answer!

I have now performed a restore of an extremely small CT and after about 24 hours in 100% state it finally worked.
So it shouldn't freeze completely, just become extremely slow.

Below are the logs of another restore process of a 19.54GB VM.
It is getting slower and slower over time until it seems to get stuck at 100%.
Code:
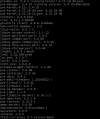
restore vma archive: zstd -q -d -c /mnt/pve/BackupSrv-CIFS/dump/vzdump-qemu-3012-2025_01_23-19_48_47.vma.zst | vma extract -v -r /var/tmp/vzdumptmp7745.fifo - /var/tmp/vzdumptmp7745
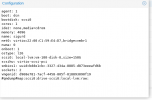
CFG: size: 504 name: qemu-server.conf
DEV: dev_id=1 size: 68719476736 devname: drive-virtio0
CTIME: Thu Jan 23 19:48:48 2025
new volume ID is 'local-zfs:vm-9999-disk-2'
map 'drive-virtio0' to '/dev/zvol/rpool/data/vm-9999-disk-2' (write zeros = 0)
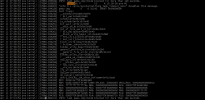
progress 1% (read 687210496 bytes, duration 4 sec)
progress 2% (read 1374420992 bytes, duration 7 sec)
progress 3% (read 2061631488 bytes, duration 11 sec)
progress 4% (read 2748841984 bytes, duration 15 sec)
progress 5% (read 3435986944 bytes, duration 18 sec)
progress 6% (read 4123197440 bytes, duration 21 sec)
progress 7% (read 4810407936 bytes, duration 25 sec)
progress 8% (read 5497618432 bytes, duration 28 sec)
progress 9% (read 6184763392 bytes, duration 30 sec)
progress 10% (read 6871973888 bytes, duration 36 sec)
progress 11% (read 7559184384 bytes, duration 39 sec)
progress 12% (read 8246394880 bytes, duration 43 sec)
progress 13% (read 8933539840 bytes, duration 47 sec)
progress 14% (read 9620750336 bytes, duration 51 sec)
progress 15% (read 10307960832 bytes, duration 54 sec)
progress 16% (read 10995171328 bytes, duration 58 sec)
progress 17% (read 11682316288 bytes, duration 61 sec)
progress 18% (read 12369526784 bytes, duration 65 sec)
progress 19% (read 13056737280 bytes, duration 70 sec)
progress 20% (read 13743947776 bytes, duration 73 sec)
progress 21% (read 14431092736 bytes, duration 77 sec)
progress 22% (read 15118303232 bytes, duration 82 sec)
progress 23% (read 15805513728 bytes, duration 85 sec)
progress 24% (read 16492724224 bytes, duration 89 sec)
progress 25% (read 17179869184 bytes, duration 93 sec)
progress 26% (read 17867079680 bytes, duration 98 sec)
progress 27% (read 18554290176 bytes, duration 101 sec)
progress 28% (read 19241500672 bytes, duration 107 sec)
progress 29% (read 19928711168 bytes, duration 111 sec)
progress 30% (read 20615856128 bytes, duration 115 sec)
progress 31% (read 21303066624 bytes, duration 120 sec)
progress 32% (read 21990277120 bytes, duration 125 sec)
progress 33% (read 22677487616 bytes, duration 129 sec)
progress 34% (read 23364632576 bytes, duration 133 sec)
progress 35% (read 24051843072 bytes, duration 136 sec)
progress 36% (read 24739053568 bytes, duration 139 sec)
progress 37% (read 25426264064 bytes, duration 143 sec)
progress 38% (read 26113409024 bytes, duration 148 sec)
progress 39% (read 26800619520 bytes, duration 152 sec)
progress 40% (read 27487830016 bytes, duration 158 sec)
progress 41% (read 28175040512 bytes, duration 162 sec)
progress 42% (read 28862185472 bytes, duration 166 sec)
progress 43% (read 29549395968 bytes, duration 171 sec)
progress 44% (read 30236606464 bytes, duration 176 sec)
progress 45% (read 30923816960 bytes, duration 181 sec)
progress 46% (read 31610961920 bytes, duration 185 sec)
progress 47% (read 32298172416 bytes, duration 190 sec)
progress 48% (read 32985382912 bytes, duration 195 sec)
progress 49% (read 33672593408 bytes, duration 200 sec)
progress 50% (read 34359738368 bytes, duration 205 sec)
progress 51% (read 35046948864 bytes, duration 210 sec)
progress 52% (read 35734159360 bytes, duration 212 sec)
progress 53% (read 36421369856 bytes, duration 213 sec)
progress 54% (read 37108580352 bytes, duration 215 sec)
progress 55% (read 37795725312 bytes, duration 217 sec)
progress 56% (read 38482935808 bytes, duration 218 sec)
progress 57% (read 39170146304 bytes, duration 220 sec)
progress 58% (read 39857356800 bytes, duration 222 sec)
progress 59% (read 40544501760 bytes, duration 226 sec)
progress 60% (read 41231712256 bytes, duration 230 sec)
progress 61% (read 41918922752 bytes, duration 232 sec)
progress 62% (read 42606133248 bytes, duration 236 sec)
progress 63% (read 43293278208 bytes, duration 241 sec)
progress 64% (read 43980488704 bytes, duration 245 sec)
progress 65% (read 44667699200 bytes, duration 295 sec)
progress 66% (read 45354909696 bytes, duration 343 sec)
progress 67% (read 46042054656 bytes, duration 384 sec)
progress 68% (read 46729265152 bytes, duration 420 sec)
progress 69% (read 47416475648 bytes, duration 470 sec)
progress 70% (read 48103686144 bytes, duration 503 sec)
progress 71% (read 48790831104 bytes, duration 553 sec)
progress 72% (read 49478041600 bytes, duration 604 sec)
progress 73% (read 50165252096 bytes, duration 662 sec)
progress 74% (read 50852462592 bytes, duration 700 sec)
progress 75% (read 51539607552 bytes, duration 736 sec)
progress 76% (read 52226818048 bytes, duration 777 sec)
progress 77% (read 52914028544 bytes, duration 820 sec)
progress 78% (read 53601239040 bytes, duration 882 sec)
progress 79% (read 54288449536 bytes, duration 934 sec)
progress 80% (read 54975594496 bytes, duration 969 sec)
progress 81% (read 55662804992 bytes, duration 1008 sec)
progress 82% (read 56350015488 bytes, duration 1057 sec)
progress 83% (read 57037225984 bytes, duration 1096 sec)
progress 84% (read 57724370944 bytes, duration 1134 sec)
progress 85% (read 58411581440 bytes, duration 1172 sec)
progress 86% (read 59098791936 bytes, duration 1220 sec)
progress 87% (read 59786002432 bytes, duration 1276 sec)
progress 88% (read 60473147392 bytes, duration 1325 sec)
progress 89% (read 61160357888 bytes, duration 1369 sec)
progress 90% (read 61847568384 bytes, duration 1419 sec)
progress 91% (read 62534778880 bytes, duration 1471 sec)
progress 92% (read 63221923840 bytes, duration 1509 sec)
progress 93% (read 63909134336 bytes, duration 1556 sec)
progress 94% (read 64596344832 bytes, duration 1602 sec)
progress 95% (read 65283555328 bytes, duration 1645 sec)
progress 96% (read 65970700288 bytes, duration 1692 sec)
progress 97% (read 66657910784 bytes, duration 1730 sec)
progress 98% (read 67345121280 bytes, duration 1747 sec)
progress 99% (read 68032331776 bytes, duration 1792 sec)
progress 100% (read 68719476736 bytes, duration 1838 sec)


Backup VM config:
Code:
agent: 1
balloon: 2048
bios: ovmf
boot: order=virtio0
cores: 3
cpu: host
memory: 8192
meta: creation-qemu=6.1.1,ctime=1675934087
name: HomeSrvGu
net0: virtio=82:4C:D0:62:3E:A4,bridge=vmbr0
numa: 1
onboot: 1
ostype: l26
scsihw: virtio-scsi-pci
smbios1: uuid=41f6c03e-1317-4855-8598-ed7f3acd4ff9
sockets: 1
startup: order=3
tags: critical;server
virtio0: local-zfs:vm-3012-disk-0,discard=on,iothread=1,size=64G
vmgenid: c0d46ad9-844b-4a42-8eb3-a6b97ab41b90
#qmdump#map:virtio0:drive-virtio0:local-zfs:raw:

Sys Log is filled up with these messages:
Code:
Jan 27 23:01:24 ProxHpDL380 pvestatd[3259]: storage 'FileSrv-CIFS' is not online
Jan 27 23:01:24 ProxHpDL380 pvestatd[3259]: status update time (11.593 seconds)
Jan 27 23:01:27 ProxHpDL380 kernel: IPv4: martian destination 0.0.0.0 from 10.1.189.1, dev eth0
Jan 27 23:01:27 ProxHpDL380 kernel: IPv4: martian destination 0.0.0.0 from 10.1.189.2, dev eth0
Jan 27 23:01:29 ProxHpDL380 kernel: IPv4: martian destination 0.0.0.0 from 10.1.189.3, dev eth0
Jan 27 23:01:32 ProxHpDL380 pvestatd[3259]: VM 1003 qmp command failed - VM 1003 qmp command 'query-proxmox-support' failed - unable to connect to VM 1003 qmp socket - timeout after 51 retries
I guess none of these has something to do with the restore?

Huge output with ps faxl
but here are the processes while running <100%:
1738015965245.png
Here are the processes when standing at 100%:
1738016253073.png

Maybe my system SSD is also part of the fault:
1738016397628.png
Has 57% wearout?!

Thanks a lot for helping!
 
On a first glance, that sounds like there might be an issue with the network or network storage. Please double check your network configs, those martian packets should not be there. Also I'd try using a bandwidth limit when restoring.