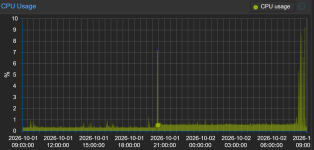
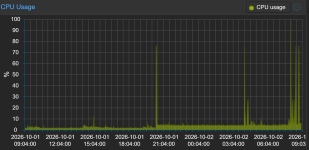
Yes — this is a
real and fairly specific difference between 11.0.3-3 and 11.0.3-4.
Side-by-side
| pidstat average | 11.0.3-3 | 11.0.3-4 | Change |
|---|
| whole QEMU process | 1.03% | 2.83% | 2.75× |
| QEMU main thread | 0.10% | 0.97% | 9.7× |
| all 4 vCPU threads combined | 0.93% | 1.93% | 2.1× |
| vCPU0 | 0.30% | 1.07% | 3.6× |
| vCPU1 | 0.30% | 0.20% | lower |
| vCPU2 | 0.13% | 0.33% | 2.5× |
| vCPU3 | 0.20% | 0.33% | 1.7× |
| vhost | 0 | 0 | unchanged |
| io_uring worker | 0 | 0 | unchanged |
The -4 averages are explicitly visible at the end of the attached sample. Pasted text
So this is
not an io_uring worker issue, not vhost networking, and not nx-lpage recovery.
More importantly, the increase is disproportionately
host-side QEMU CPU, not simply the guest doing more work:
- -3: %usr + %system ≈ 0.73%
- -4: %usr + %system ≈ 2.04%
- guest time only rises from 0.30% → 0.80%
About
1.31 percentage points of the 1.80-point regression are host-side QEMU execution.
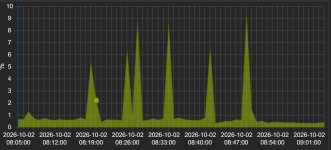
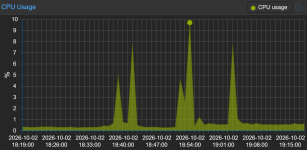
The strongest clue: exact ~10-second bursts
Look at -4:
At
19:25:02:
- whole QEMU: 20%
- main QEMU thread: 5%
- vCPU0: 13%
Pasted text
At
19:25:12, exactly 10 seconds later:
- whole QEMU: 6%
- main thread: 4%
Pasted text
At
19:25:22, another 10 seconds later:
- whole QEMU: 19%
- main thread: 6%
- vCPU0: 11%
Pasted text
That cadence is highly significant.
pvestatd currently performs its normal status update on a
10-second interval, and its update path invokes the full QEMU VM status collection.
GitHub Current qemu-server also explicitly documents that full vmstatus queries KVM through QMP and queues QMP status queries.
Proxmox qemu-server vmstatus source
My working hypothesis
The data now points much more toward:
11.0.3-4 is spending substantially more CPU handling Proxmox's periodic QMP/status collection.
rather than:
the guest simply stopped entering HLT / KVM idle correctly.
The latter would normally show primarily as continuously busier CPU n/KVM threads. Here, the standout change is the
QEMU main thread, synchronized to a host-side 10-second timer.
That also makes the savevm-async QIOChannel patch a
less convincing direct explanation. Nothing about normal pvestatd polling should exercise save/load VM-state code.
Best next test
On 11.0.3-4, temporarily stop pvestatd and repeat exactly the same measurement.
VMID=YOUR_VMID
PID=$(cat /run/qemu-server/$VMID.pid)
systemctl stop pvestatd
pidstat -t -p "$PID" 1 30
systemctl start pvestatd
A short stop does
not stop the VMs. It does temporarily stop Proxmox status/RRD updates and auto-ballooning, so don't do it during host memory pressure if you're relying on dynamic ballooning.
There are two very useful possible results.
A. CPU falls from ~2.8% toward ~1%
And the :02/:12/:22 style bursts disappear.
That would be very strong evidence that the regression is specifically triggered by
QMP/status polling.
At that point we can isolate which QMP operation is responsible.
B. CPU stays near ~2.8%
Then the 10-second alignment is coincidental, and we'd switch focus back to:
- guest timer/interrupt injection;
- APIC/HPET/RTC behaviour;
- KVM exits;
- a QEMU internal periodic timer.
If test A confirms it
The next step should be perf on the
main QEMU thread, because that is where the biggest relative regression is.
For -4:
PID=$(cat /run/qemu-server/$VMID.pid)
perf record \
-F 499 \
-g \
-t "$PID" \
-- sleep 35
perf report --stdio --sort=dso,symbol
PID == main-thread TID, so -t "$PID" deliberately profiles only QEMU's main thread.
Thirty-five seconds covers at least three pvestatd cycles.
I would expect the -4 profile to reveal something in one of these classes:
QMP dispatch
↓
query-blockstats
query-balloon
query-status
QOM/property traversal
block graph iteration
timer/BH processing
Then run the same profile under -3.
The difference between those two main-thread call graphs should be much more diagnostic than aggregate pidstat.
I'd also profile vCPU0 separately
Your -4 sample has another distinctive feature: the largest QMP/main-thread bursts sometimes coincide with vCPU0 becoming very active.
For example at 19:25:02, vCPU0 accounts for
13%, including
7% guest and
5% system. Pasted text
And at 19:25:22 it reaches
11%. Pasted text
That suggests the main-thread operation may also cause a virtual device event/interrupt that wakes the BSP/vCPU0.
This pattern would fit things such as a device statistics request much better than a generic QEMU busy loop.
To get its TID automatically:
ps -L -p "$PID" -o tid,comm
Then:
perf record -F 499 -g -t VCPU0_TID -- sleep 35
perf report --stdio
One candidate worth testing: balloon statistics
I wouldn't call it the culprit yet, but
virtio-balloon is interesting here.
Proxmox enables the balloon device by default unless explicitly disabled, and QEMU's virtio-balloon statistics mechanism uses a QEMU timer that notifies the guest through a virtqueue when polling statistics.
GitHub
That can produce exactly the general shape:
QEMU main thread
│
│ device/timer work
▼
virtio notification
│
▼
guest interrupt
│
▼
vCPU0 wakes
However, Proxmox historically sets balloon guest-stat polling more frequently than 10 seconds, so
the 10-second pattern points more directly at pvestatd itself than the balloon timer alone.
If your VM config has:
balloon: ...
or no explicit balloon: 0, I'd keep balloon/QMP memory-stat collection near the top of the candidate list.
What these logs rule out
I would now give very low priority to:
- io_uring polling regression — worker is 0%;
- vhost networking — 0%;
- nx hugepage recovery — 0%;
- RCU thread — 0%;
- one continuously spinning vCPU — load is bursty and spread;
- a simple guest CPU workload difference — host %usr/%system growth is much too prominent.
The pattern is instead:
11.0.3-4
│
every ~10 seconds
│
▼
QEMU main thread wakes
4–6% for ~1 s
│
sometimes
▼
vCPU0 wakes
up to 11–13%
That is much narrower than where we started.
Current likelihood order
- QMP/status polling interacting differently with the -4 binary
- A QMP-triggered virtual-device path, especially memory/balloon/block stats
- Rebuild/toolchain/library difference in -4, since none of the seven source commits obviously modifies these paths
- Savevm QIOChannel lifetime fix
- The other -4 source changes
If you run the
30-second pvestatd-stopped pidstat test, paste that output. That single test should tell us whether to dissect QMP next or abandon that branch entirely.