pve-qemu-kvm 11.0.3-4 performance degradation

atomek

Member
Nov 19, 2023
10
0
6
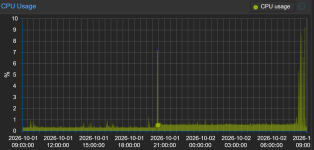
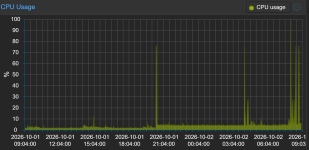
I'm doing frequent proxmox updates, today I've noticed much higher CPU usage of VMs (linux and BSD) after yesterday upgrade. I've checked that kernel was updated to 7.0.14-20-pve, but reverting the issue remains. After I downgraded pve-qemu-kvm 11.0.3-4 to pve-qemu-kvm 11.0.3-3 the issue is gone. Have you noticed this? Can I report it somewhere?


1790924600232.png

1790924629344.png

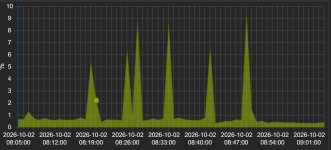
And this is after the downgrade of package - notice the idle CPU usage at around 8:50 dropped in half:


1790924700210.png
 
Hi,
the only changes in the pve-qemu-kvm package were in very specific subsystems related to backup, snapshot and migration and should not affect performance otherwise:
Code:
pve-qemu-kvm (11.0.3-4) trixie; urgency=medium

  * vma: reject archive member names that are not a single path component
    when reading an archive. Previously, extracting a crafted backup archive,
    as done on restore, could write configuration files outside of the
    extraction directory.

  * vma: fix out-of-bounds reads and resulting crashes when reading an
    archive with a crafted header, for example one containing a zero-length
    name or an invalid blob buffer location.

  * savevm-async: fix leaking the state file channel and a reference to its
    block backend each time the VM state is saved or loaded, for example for
    snapshots including RAM or for hibernation.

  * migration: fail with an error instead of possibly crashing when the
    Proxmox Backup Server dirty bitmap state in an incoming migration stream
    or saved VM state is corrupt.

 -- Proxmox Support Team <support@proxmox.com>  Wed, 30 Sep 2026 22:53:48 +0200

Are you sure nothing else changed between the tests? Can you check the timings of the latest boots and which kernel each used?
 
  • Like
Reactions: atomek
Hello,

I am seeing similar behaviour on a Debian Linux VM running Checkmk in my Proxmox cluster.

Current package versions:
- pve-manager: 9.2.21
- qemu-server: 9.2.10
- pve-qemu-kvm: 11.0.3-4
- Kernel: 7.0.14-20-pve

On October 1, I updated the nodes and performed rolling reboots with HA live migrations. On hv06, the upgrade from pve-qemu-kvm 11.0.3-3 to 11.0.3-4 was logged at 06:57:18. VM 100 was subsequently migrated from hv04 to hv06, completing the VM-state transfer at 07:45:27, and back to hv04 at 07:58:37.

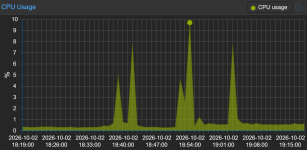
The monitoring history shows a sustained increase in the VM's baseline load that morning. CPU usage reported from inside the guest was substantially lower than the host-side VM CPU usage. A subsequent VM restart did not provide a lasting improvement. Moving the VM to hv06 changed the pattern to frequent CPU spikes, but did not eliminate the issue.

Today I downgraded only pve-qemu-kvm on hv06 to 11.0.3-3, retaining kernel 7.0.14-20-pve. The running VM process now reports:
QEMU emulator version 11.0.3 (pve-qemu-kvm_11.0.3-3)

The initial result is encouraging: the frequent spikes have disappeared so far, and host-side VM CPU usage has settled around 9–11%. However, this is still preliminary; I am allowing at least an hour for Checkmk to catch up after startup before drawing a conclusion.

One important caveat: automatic service restarts during the downgrade included pve-cluster and both HA services, followed by an unexpected host reset, apparently due to fencing. Consequently, this comparison includes both a host and a guest restart, rather than solely a QEMU package change.

ChatGPT assisted me with researching this thread, reviewing the monitoring screenshots and migration logs, and drafting this comment. The commands were executed by me, and the observations above are from my own system.

Thank you for investigating. I can provide the graphs and migration logs if useful.
 
Are you sure nothing else changed between the tests? Can you check the timings of the latest boots and which kernel each used?

I confirm there is something wrong. I've retested this in isolation, only changing pve-qemu-kvm package: (11.0.3-4, 11.0.3-3). The stats are from Debian 13 VM (latest updates)

18:10: booted with 11.0.3-3, after startup spike the load stabilise at 0.26-0.3 %
18:50: booted with 11.0.3-4, after startup spike the load stabilise at 0.6-0.7 % - one reboot of VM to see if change anything, but idle stays elevated


1790961499830.png


I've asked The Wise (GPT) what could go awry with commits for 11.0.3-4, here is what she told me (sounds crypto to me but maybe you can find it useful):

The interesting commit: 513917f9a7
This commit fixes this lifetime sequence:
qio_channel_savevm_async_new()
│
▼
QIOChannel
│
├── owns BlockBackend ref
│
▼
qemu_file_new_input/output()
│
└── takes its own QIOChannel reference

Previously, Proxmox retained the original channel reference in addition to the one owned by QEMUFile. As a consequence, after closing the QEMUFile, the QIOChannel and its BlockBackend reference could remain leaked.
-4 effectively does:
QIOChannel *ioc = qio_channel_savevm_async_new(...);

f = qemu_file_new_...(ioc);

/* QEMUFile now owns its reference */
object_unref(ioc);

Proxmox's patch discussion explicitly describes this as a QIOChannel/BlockBackend leak occurring for snapshots/state loading. Lore Proxmox
There are two reasons I don't think this explains ordinary idle CPU:
1. It isn't executed continuously. It belongs to savevm-async, used when saving/loading VM state—RAM snapshots, hibernation, rollback/state load, etc.
2. Its expected effect is to remove a leaked object, not add a polling object or worker. If anything, after a state operation it should leave fewer resources around.
A refcount bug could theoretically cause unexpected lifecycle behavior, which is why this is the first commit I'd bisect if the package is conclusively responsible. But the usual manifestation would be a crash, use-after-free, failed snapshot, or state-operation problem—not every idle VM consistently consuming twice as much CPU.

The other QEMU-process changes
45d5a170a7 changes:
f->buf = malloc(buffer_size);
...
free(f->buf);

to:
f->buf = g_malloc(buffer_size);
...
g_free(f->buf);

For savevm-async the buffer is 4 MiB. The significant semantic difference is OOM behavior: g_malloc() does not return NULL in the ordinary way. There is no timer, poll, coroutine wakeup, thread creation, or repeated allocation introduced by this change. Mail Archive
b6f2adbcea affects pbs_state_load(): zero-sized state returns early, allocation uses g_try_malloc(), errors are handled instead of potentially dereferencing NULL, and the buffer is automatically freed. Again, this only matters while loading migration/saved PBS bitmap state. Mail Archive
The VMA fixes only validate archive names and header bounds while reading VMA archives; the official changelog describes them as restore/archive parsing hardening.

A very useful discriminator
If you do the following:
1. install 11.0.3-4;
2. fully stop and start a VM;
3. take no snapshot, perform no migration/rollback/hibernate;
4. observe elevated idle CPU immediately;
then the savevm/migration changes have essentially not been exercised.
That would be strong evidence that the source-level semantic changes above aren't the direct cause.
A guest reboot is not sufficient for this test. You need a QEMU process restart (qm stop / qm start) because replacing the pve-qemu-kvm package on disk does not replace an already-running QEMU process. Proxmox similarly advises starting/migrating VMs afresh when testing a changed QEMU package.
 
Some more findings after comparing -3 to -4 VM with pidstat -t -p "$PID" 1 30 (also GPT output)

Yes — this is a real and fairly specific difference between 11.0.3-3 and 11.0.3-4.

Side-by-side​

pidstat average11.0.3-311.0.3-4Change
whole QEMU process1.03%2.83%2.75×
QEMU main thread0.10%0.97%9.7×
all 4 vCPU threads combined0.93%1.93%2.1×
vCPU00.30%1.07%3.6×
vCPU10.30%0.20%lower
vCPU20.13%0.33%2.5×
vCPU30.20%0.33%1.7×
vhost00unchanged
io_uring worker00unchanged
The -4 averages are explicitly visible at the end of the attached sample. Pasted text

So this is not an io_uring worker issue, not vhost networking, and not nx-lpage recovery.

More importantly, the increase is disproportionately host-side QEMU CPU, not simply the guest doing more work:

  • -3: %usr + %system ≈ 0.73%
  • -4: %usr + %system ≈ 2.04%
  • guest time only rises from 0.30% → 0.80%
About 1.31 percentage points of the 1.80-point regression are host-side QEMU execution.

The strongest clue: exact ~10-second bursts​

Look at -4:

At 19:25:02:

  • whole QEMU: 20%
  • main QEMU thread: 5%
  • vCPU0: 13%
Pasted text

At 19:25:12, exactly 10 seconds later:

  • whole QEMU: 6%
  • main thread: 4%
Pasted text

At 19:25:22, another 10 seconds later:

  • whole QEMU: 19%
  • main thread: 6%
  • vCPU0: 11%
Pasted text

That cadence is highly significant.

pvestatd currently performs its normal status update on a 10-second interval, and its update path invokes the full QEMU VM status collection. GitHub Current qemu-server also explicitly documents that full vmstatus queries KVM through QMP and queues QMP status queries. Proxmox qemu-server vmstatus source

My working hypothesis​

The data now points much more toward:

11.0.3-4 is spending substantially more CPU handling Proxmox's periodic QMP/status collection.
rather than:

the guest simply stopped entering HLT / KVM idle correctly.
The latter would normally show primarily as continuously busier CPU n/KVM threads. Here, the standout change is the QEMU main thread, synchronized to a host-side 10-second timer.

That also makes the savevm-async QIOChannel patch a less convincing direct explanation. Nothing about normal pvestatd polling should exercise save/load VM-state code.


Best next test​

On 11.0.3-4, temporarily stop pvestatd and repeat exactly the same measurement.

VMID=YOUR_VMID
PID=$(cat /run/qemu-server/$VMID.pid)

systemctl stop pvestatd

pidstat -t -p "$PID" 1 30

systemctl start pvestatd
A short stop does not stop the VMs. It does temporarily stop Proxmox status/RRD updates and auto-ballooning, so don't do it during host memory pressure if you're relying on dynamic ballooning.

There are two very useful possible results.

A. CPU falls from ~2.8% toward ~1%​

And the :02/:12/:22 style bursts disappear.

That would be very strong evidence that the regression is specifically triggered by QMP/status polling.

At that point we can isolate which QMP operation is responsible.

B. CPU stays near ~2.8%​

Then the 10-second alignment is coincidental, and we'd switch focus back to:

  • guest timer/interrupt injection;
  • APIC/HPET/RTC behaviour;
  • KVM exits;
  • a QEMU internal periodic timer.

If test A confirms it​

The next step should be perf on the main QEMU thread, because that is where the biggest relative regression is.

For -4:

PID=$(cat /run/qemu-server/$VMID.pid)

perf record \
-F 499 \
-g \
-t "$PID" \
-- sleep 35

perf report --stdio --sort=dso,symbol
PID == main-thread TID, so -t "$PID" deliberately profiles only QEMU's main thread.

Thirty-five seconds covers at least three pvestatd cycles.

I would expect the -4 profile to reveal something in one of these classes:

QMP dispatch
↓
query-blockstats
query-balloon
query-status
QOM/property traversal
block graph iteration
timer/BH processing
Then run the same profile under -3.

The difference between those two main-thread call graphs should be much more diagnostic than aggregate pidstat.


I'd also profile vCPU0 separately​

Your -4 sample has another distinctive feature: the largest QMP/main-thread bursts sometimes coincide with vCPU0 becoming very active.

For example at 19:25:02, vCPU0 accounts for 13%, including 7% guest and 5% system. Pasted text

And at 19:25:22 it reaches 11%. Pasted text

That suggests the main-thread operation may also cause a virtual device event/interrupt that wakes the BSP/vCPU0.

This pattern would fit things such as a device statistics request much better than a generic QEMU busy loop.

To get its TID automatically:

ps -L -p "$PID" -o tid,comm
Then:

perf record -F 499 -g -t VCPU0_TID -- sleep 35
perf report --stdio

One candidate worth testing: balloon statistics​

I wouldn't call it the culprit yet, but virtio-balloon is interesting here.

Proxmox enables the balloon device by default unless explicitly disabled, and QEMU's virtio-balloon statistics mechanism uses a QEMU timer that notifies the guest through a virtqueue when polling statistics. GitHub

That can produce exactly the general shape:

QEMU main thread
│
│ device/timer work
▼
virtio notification
│
▼
guest interrupt
│
▼
vCPU0 wakes
However, Proxmox historically sets balloon guest-stat polling more frequently than 10 seconds, so the 10-second pattern points more directly at pvestatd itself than the balloon timer alone.

If your VM config has:

balloon: ...
or no explicit balloon: 0, I'd keep balloon/QMP memory-stat collection near the top of the candidate list.


What these logs rule out​

I would now give very low priority to:

  • io_uring polling regression — worker is 0%;
  • vhost networking — 0%;
  • nx hugepage recovery — 0%;
  • RCU thread — 0%;
  • one continuously spinning vCPU — load is bursty and spread;
  • a simple guest CPU workload difference — host %usr/%system growth is much too prominent.
The pattern is instead:

11.0.3-4
│
every ~10 seconds
│
▼
QEMU main thread wakes
4–6% for ~1 s
│
sometimes
▼
vCPU0 wakes
up to 11–13%
That is much narrower than where we started.

Current likelihood order​

  1. QMP/status polling interacting differently with the -4 binary
  2. A QMP-triggered virtual-device path, especially memory/balloon/block stats
  3. Rebuild/toolchain/library difference in -4, since none of the seven source commits obviously modifies these paths
  4. Savevm QIOChannel lifetime fix
  5. The other -4 source changes
If you run the 30-second pvestatd-stopped pidstat test, paste that output. That single test should tell us whether to dissect QMP next or abandon that branch entirely.

 
Please share the configuration of an affected VM with qm config ID, the storage configuration cat /etc/pve/storage.cfg as well as the output of pveversion -v. What physical CPU model do you have?
 
  • Like
Reactions: kohly and atomek
Please share the configuration of an affected VM with qm config ID, the storage configuration cat /etc/pve/storage.cfg as well as the output of pveversion -v. What physical CPU model do you have?

Bash:
root@hv04:~$ cat /etc/pve/qemu-server/100.conf
#https%3A//checkmk.com/de
agent: 1,fstrim_cloned_disks=1
bootdisk: virtio0
cores: 8
cpu: x86-64-v3
ide2: none,media=cdrom
memory: 8192
name: monitor.chaos.inc
net0: virtio=C6:54:9E:**:**:**,bridge=vmbr0
numa: 0
onboot: 1
ostype: l26
protection: 1
scsihw: virtio-scsi-pci
smbios1: uuid=21398746-3e6c-4433-a3e7-************
sockets: 1
tags: chaos.inc;critical;debian;prod
vga: std
virtio0: local-zfs:vm-100-disk-0,discard=on,iothread=1,size=16G
virtio1: local-zfs:vm-100-disk-1,discard=on,iothread=1,size=4G
virtio2: local-zfs:vm-100-disk-2,discard=on,iothread=1,size=32G

Code:
root@hv04:~$ cat /etc/pve/storage.cfg
dir: local
        path /var/lib/vz
        content images,rootdir
        shared 0

nfs: nfs-backup
        export /volume1/backup
        path /mnt/pve/nfs-backup
        server 10.0.0.2
        content backup
        options noatime,nodiratime,vers=3
        prune-backups keep-daily=7,keep-monthly=3,keep-weekly=4

nfs: nfs-images
        export /volume3/images
        path /mnt/pve/nfs-images
        server 10.0.0.2
        content images,rootdir
        options noatime,nodiratime,vers=3

nfs: nfs-iso
        export /volume1/iso
        path /mnt/pve/nfs-iso
        server 10.0.0.2
        content iso
        options noatime,nodiratime,vers=3

nfs: nfs-templates
        export /volume1/templates
        path /mnt/pve/nfs-templates
        server 10.0.0.2
        content import,vztmpl
        options noatime,nodiratime,vers=3

pbs: pbs
        datastore pbs-nfs-backup
        server 10.0.0.200
        content backup
        fingerprint b5:58:4f:47:38:c9:e5:79:bf:18:36:02:85:63:04:70:83:3f:68:ba:b7:**:**:**:**:**:**:**:**:**:**:**
        prune-backups keep-all=1
        username root@pam

zfspool: local-zfs
        pool rpool/data
        content images,rootdir
        nodes hv06,hv02,hv01,hv05,hv04
        sparse 1

Code:
root@hv04:~$ pveversion -v
proxmox-ve: 9.2.0 (running kernel: 7.0.14-20-pve)
pve-manager: 9.2.21 (running version: 9.2.21/4f6e0ac86f9e8c7f)
proxmox-kernel-helper: 9.2.0
proxmox-kernel-7.0: 7.0.14-20
proxmox-kernel-7.0.14-20-pve-signed: 7.0.14-20
ceph-fuse: 19.2.6-pve4
corosync: 3.1.10-pve3
criu: 4.1.1-1
frr-pythontools: 10.6.1-1+pve3
ifupdown2: 3.3.0-1+pmx12
intel-microcode: 3.20251111.1~deb13u1
ksm-control-daemon: 1.5-1
libjs-extjs: 7.0.0-7
libproxmox-acme-perl: 1.7.2
libproxmox-backup-qemu0: 2.0.3
libproxmox-rs-perl: 0.4.1
libpve-access-control: 9.1.2
libpve-apiclient-perl: 3.4.3
libpve-cluster-api-perl: 9.1.6
libpve-cluster-perl: 9.1.6
libpve-common-perl: 9.2.2
libpve-guest-common-perl: 6.0.5
libpve-http-server-perl: 6.0.5
libpve-network-perl: 1.6.7
libpve-notify-perl: 9.1.6
libpve-rs-perl: 0.15.3
libpve-storage-perl: 9.1.11
libspice-server1: 0.15.2-1+b1
lvm2: 2.03.31-2+pmx1
lxc-pve: 7.0.0-2
lxcfs: 7.0.0-pve1
novnc-pve: 1.7.0-2
proxmox-backup-client: 4.2.7-1
proxmox-backup-file-restore: 4.2.7-1
proxmox-backup-restore-image: 1.0.0
proxmox-enterprise-support-keyring: 1.1
proxmox-firewall: 1.2.3
proxmox-kernel-helper: 9.2.0
proxmox-mail-forward: 1.0.3
proxmox-mini-journalreader: 1.7
proxmox-offline-mirror-helper: 0.7.4
proxmox-widget-toolkit: 5.2.10
pve-cluster: 9.1.6
pve-container: 6.1.14
pve-docs: 9.2.13
pve-edk2-firmware: 4.2026.08-1
pve-esxi-import-tools: 1.0.1
pve-firewall: 6.0.6
pve-firmware: 3.18-6
pve-ha-manager: 5.2.5
pve-i18n: 3.10.0
pve-qemu-kvm: 11.0.3-3
pve-xtermjs: 6.0.0-2
qemu-server: 9.2.10
smartmontools: 7.5-pve2
spiceterm: 3.4.2
swtpm: 0.8.0+pve3
vncterm: 1.9.2
zfsutils-linux: 2.4.4-pve1

Code:
root@hv04:~$ lscpu
Architecture:                x86_64
  CPU op-mode(s):            32-bit, 64-bit
  Address sizes:             46 bits physical, 48 bits virtual
  Byte Order:                Little Endian
CPU(s):                      18
  On-line CPU(s) list:       0-17
Vendor ID:                   GenuineIntel
  Model name:                Intel(R) Core(TM) Ultra 5 125H
    CPU family:              6
    Model:                   170
    Thread(s) per core:      2
    Core(s) per socket:      14
    Socket(s):               1
    Stepping:                4
    CPU(s) scaling MHz:      14%
    CPU max MHz:             4500.0000
    CPU min MHz:             400.0000
    BogoMIPS:                5990.40
    Flags:                   fpu vme de pse tsc msr pae mce cx8 apic sep mtrr pge mca cmov pat pse36 clflush dts acpi mmx fxsr sse sse2 ss ht tm pbe syscall nx pdpe1gb rdtscp lm constant_tsc art arch_perfmon pebs bts rep_good nopl xtopology nonstop_tsc cpuid aperfmperf tsc_known_freq pni pclmulqdq dtes64 mo
                             nitor ds_cpl vmx smx est tm2 ssse3 sdbg fma cx16 xtpr pdcm pcid sse4_1 sse4_2 x2apic movbe popcnt tsc_deadline_timer aes xsave avx f16c rdrand lahf_lm abm 3dnowprefetch cpuid_fault epb ssbd ibrs ibpb stibp ibrs_enhanced tpr_shadow flexpriority ept vpid ept_ad fsgsbase tsc_adjust
                              bmi1 avx2 smep bmi2 erms invpcid rdseed adx smap clflushopt clwb intel_pt sha_ni xsaveopt xsavec xgetbv1 xsaves split_lock_detect user_shstk avx_vnni dtherm ida arat pln pts hwp hwp_notify hwp_act_window hwp_epp hwp_pkg_req hfi vnmi umip pku ospke waitpkg gfni vaes vpclmulqdq r
                             dpid bus_lock_detect movdiri movdir64b fsrm md_clear serialize arch_lbr ibt flush_l1d arch_capabilities
Virtualization features:     
  Virtualization:            VT-x
Caches (sum of all):         
  L1d:                       448 KiB (12 instances)
  L1i:                       768 KiB (12 instances)
  L2:                        14 MiB (7 instances)
  L3:                        18 MiB (1 instance)
NUMA:                       
  NUMA node(s):              1
  NUMA node0 CPU(s):         0-17
Vulnerabilities:             
  Gather data sampling:      Not affected
  Ghostwrite:                Not affected
  Indirect target selection: Not affected
  Itlb multihit:             Not affected
  L1tf:                      Not affected
  Mds:                       Not affected
  Meltdown:                  Not affected
  Mmio stale data:           Not affected
  Old microcode:             Not affected
  Reg file data sampling:    Not affected
  Retbleed:                  Not affected
  Spec rstack overflow:      Not affected
  Spec store bypass:         Mitigation; Speculative Store Bypass disabled via prctl
  Spectre v1:                Mitigation; usercopy/swapgs barriers and __user pointer sanitization
  Spectre v2:                Mitigation; Enhanced / Automatic IBRS; IBPB conditional; PBRSB-eIBRS Not affected; BHI BHI_DIS_S
  Srbds:                     Not affected
  Tsa:                       Not affected
  Tsx async abort:           Not affected
  Vmscape:                   Mitigation; IBPB before exit to userspace
 
Please share the configuration of an affected VM with qm config ID, the storage configuration cat /etc/pve/storage.cfg as well as the output of pveversion -v. What physical CPU model do you have?
qm config 200
agent: 1
balloon: 1024
boot: order=scsi0
cores: 4
cpu: host
hotplug: 0
memory: 8192
meta: creation-qemu=11.0.3,ctime=1788342452
name: deb-Debian
net0: virtio=BC:24:11:61:C2:63,bridge=vmbr2
numa: 0
onboot: 1
ostype: l26
scsi0: local-lvm:vm-200-disk-0,discard=on,size=50G,ssd=1
scsi1: local-lvm:vm-200-disk-1,backup=0,discard=on,replicate=0,size=1500G,ssd=1
scsihw: virtio-scsi-pci
serial0: socket
smbios1: uuid=73e5425d-e429-47b6-8922-d9a124d4202e
sockets: 1
tablet: 0
vga: serial0
vmgenid: 529acb9b-56d7-4d31-a0e2-c9dada62d797
cat /etc/pve/storage.cfg
dir: local
path /var/lib/vz
content iso,vztmpl,backup

lvmthin: local-lvm
thinpool data
vgname pve
content rootdir,images
#pveversion -v

pveversion -v
proxmox-ve: 9.2.0 (running kernel: 7.0.14-20-pve)
pve-manager: 9.2.21 (running version: 9.2.21/4f6e0ac86f9e8c7f)
proxmox-kernel-helper: 9.2.0
proxmox-kernel-7.0: 7.0.14-20
proxmox-kernel-7.0.14-20-pve-signed: 7.0.14-20
proxmox-kernel-7.0.14-19-pve-signed: 7.0.14-19
proxmox-kernel-6.17: 6.17.13-21
proxmox-kernel-6.17.13-21-pve-signed: 6.17.13-21
ceph-fuse: 20.2.4-pve5
corosync: 3.1.10-pve3
criu: 4.1.1-1
frr-pythontools: 10.6.1-1+pve3
ifupdown2: 3.3.0-1+pmx12
intel-microcode: 3.20251111.1~deb13u1
ksm-control-daemon: 1.5-1
libjs-extjs: 7.0.0-7
libproxmox-acme-perl: 1.7.2
libproxmox-backup-qemu0: 2.0.3
libproxmox-rs-perl: 0.4.1
libpve-access-control: 9.1.2
libpve-apiclient-perl: 3.4.3
libpve-cluster-api-perl: 9.1.6
libpve-cluster-perl: 9.1.6
libpve-common-perl: 9.2.2
libpve-guest-common-perl: 6.0.5
libpve-http-server-perl: 6.0.5
libpve-network-perl: 1.6.7
libpve-notify-perl: 9.1.6
libpve-rs-perl: 0.15.3
libpve-storage-perl: 9.1.11
libspice-server1: 0.15.2-1+b1
lvm2: 2.03.31-2+pmx1
lxc-pve: 7.0.0-2
lxcfs: 7.0.0-pve1
novnc-pve: 1.7.0-2
openvswitch-switch: 3.5.0-1+b1
proxmox-backup-client: 4.2.7-1
proxmox-backup-file-restore: 4.2.7-1
proxmox-backup-restore-image: 1.0.0
proxmox-enterprise-support-keyring: 1.1
proxmox-firewall: 1.2.3
proxmox-kernel-helper: 9.2.0
proxmox-mail-forward: 1.0.3
proxmox-mini-journalreader: 1.7
proxmox-widget-toolkit: 5.2.10
pve-cluster: 9.1.6
pve-container: 6.1.14
pve-docs: 9.2.13
pve-edk2-firmware: 4.2026.08-1
pve-esxi-import-tools: 1.0.1
pve-firewall: 6.0.6
pve-firmware: 3.18-6
pve-ha-manager: 5.2.5
pve-i18n: 3.10.0
pve-qemu-kvm: 11.0.3-3
pve-xtermjs: 6.0.0-2
qemu-server: 9.2.10
smartmontools: 7.5-pve2
spiceterm: 3.4.2
swtpm: 0.8.0+pve3
vncterm: 1.9.2
zfsutils-linux: 2.4.4-pve1
lscpu
Architecture: x86_64
CPU op-mode(s): 32-bit, 64-bit
Address sizes: 39 bits physical, 48 bits virtual
Byte Order: Little Endian
CPU(s): 4
On-line CPU(s) list: 0-3
Vendor ID: GenuineIntel
Model name: Intel(R) N100
CPU family: 6
Model: 190
Thread(s) per core: 1
Core(s) per socket: 4
Socket(s): 1
Stepping: 0
CPU(s) scaling MHz: 23%
CPU max MHz: 3400.0000
CPU min MHz: 700.0000
BogoMIPS: 1612.80
Flags: fpu vme de pse tsc msr pae mce cx8 apic sep mtrr pge mca cmov pat pse36 clflush dts acpi mmx fxsr sse sse2 ss ht tm pbe syscall
nx pdpe1gb rdtscp lm constant_tsc art arch_perfmon pebs bts rep_good nopl xtopology nonstop_tsc cpuid aperfmperf tsc_known_freq
pni pclmulqdq dtes64 monitor ds_cpl vmx est tm2 ssse3 sdbg fma cx16 xtpr pdcm pcid sse4_1 sse4_2 x2apic movbe popcnt tsc_deadlin
e_timer aes xsave avx f16c rdrand lahf_lm abm 3dnowprefetch cpuid_fault epb cat_l2 cdp_l2 ssbd ibrs ibpb stibp ibrs_enhanced tpr
_shadow flexpriority ept vpid ept_ad fsgsbase tsc_adjust bmi1 avx2 smep bmi2 erms invpcid rdt_a rdseed adx smap clflushopt clwb
intel_pt sha_ni xsaveopt xsavec xgetbv1 xsaves split_lock_detect user_shstk avx_vnni dtherm ida arat pln pts hwp hwp_notify hwp_
act_window hwp_epp hwp_pkg_req vnmi umip pku ospke waitpkg gfni vaes vpclmulqdq rdpid movdiri movdir64b fsrm md_clear serialize
arch_lbr ibt flush_l1d arch_capabilities
Virtualization features:
Virtualization: VT-x
Caches (sum of all):
L1d: 128 KiB (4 instances)
L1i: 256 KiB (4 instances)
L2: 2 MiB (1 instance)
L3: 6 MiB (1 instance)
NUMA:
NUMA node(s): 1
NUMA node0 CPU(s): 0-3
Vulnerabilities:
Gather data sampling: Not affected
Ghostwrite: Not affected
Indirect target selection: Not affected
Itlb multihit: Not affected
L1tf: Not affected
Mds: Not affected
Meltdown: Not affected
Mmio stale data: Not affected
Old microcode: Not affected
Reg file data sampling: Mitigation; Clear Register File
Retbleed: Not affected
Spec rstack overflow: Not affected
Spec store bypass: Mitigation; Speculative Store Bypass disabled via prctl
Spectre v1: Mitigation; usercopy/swapgs barriers and __user pointer sanitization
Spectre v2: Mitigation; Enhanced / Automatic IBRS; IBPB conditional; PBRSB-eIBRS Not affected; BHI BHI_DIS_S
Srbds: Not affected
Tsa: Not affected
Tsx async abort: Not affected
Vmscape: Mitigation; IBPB before exit to userspace