Proxmox VE monitoring

No, the site is still online but they replaced it with the new one where most of the templates are missing. If you for example searched 2 days ago for my "Aruba 1930" managed switch you found this template: https://share.zabbix.com/network_devices/aruba/aruba-instant-on-1930. All the links to the old templates are now dead and you get a "404 File not found". So I now won't be able to monitor my switch anymore. Same with hundreds or thousands of other integrations.

Wow that sucks. They aren't in the wayback machine either, but still show up in searches. You'd think they'd do a bunch of redirects or something. Hmm. I haven't dug into why this was done.

I see their site doesn't list any Aruba (HP switch) integrations anymore. The page is there but lists no "solutions".

https://www.zabbix.com/integrations/aruba
 
Last edited:
Wow that sucks. They aren't in the wayback machine either, but still show up in searches. You'd think they'd do a bunch of redirects or something. Hmm. I haven't dug into why this was done.

I see their site doesn't list any Aruba (HP switch) integrations anymore. The page is there but lists no "solutions".

https://www.zabbix.com/integrations/aruba
Jup, also checked Waybackmachine yesterday but it doesn'T archived the templates. As far as I undestand they opened a github with only a fraction of the templates. And the templates there often neither got a installation tutorial on how to use them nor the required config files for the zabbix agents so even the templates there are often useless and unusable. Until yesterday both existed in coexistence with a warning that the Github will replace the old site. Now it looks that all the old stuff is gone and what you now can fine on the share.zabbix.com site is just a export of the github content.

I've seen that warning and downloaded the required files and dumped the old zabbix page for all templates I was installing (so my plan was to have a backup copy of all I need) but they shut it down while I was migrating from Zabbix 5.0 to 6.0 so I wasn't able to finish downloading everything I need.

8 templates I already backed up, 7 are still missing and of these 7 I was only able to find 4 somewhere online. So 3 are still lost now.
 
Last edited:
8 templates I already backed up, 7 are still missing and of these 7 I was only able to find 4 somewhere online. So 3 are still lost now.

Maybe you could extract them from your version 5 install.

I'm guessing the community templates they added to the repo are the MIT ones and they dropped the GPL ones, based on their new policy. So that would be why there still are a few, but most are missing.

I saw your post in the Zabbix forum. There's a couple tickets open about it. I'm surprised there isn't more uproar, but maybe it's because not enough people have tried to upgrade yet.
 
Maybe you could extract them from your version 5 install.
I tried that. Indeed I could export my template files from my version 5 VM and import them to my version 6 LXC. I already did that for some templates because I edited them to my needs and didn't wanted to edit all that again. But many templates are very complex and require you to...
- install additional scripts on the zabbix server or on the hosts that run the zabbix agent
- edit some linux config files ( like the sudoers file to give the zabbix user access to specific commands like smartctl as root)
- install additional packages so scripts can make use of programs they rely on
- edit some program configs so they allow to grab additional metrics (like enabling the status page of apache/nginx or APIs for nextcloud and so on)
- setup the correct values for macros
- create some unprivileged monitoring users on devices and tell the template how to use them
- import MIB files so ICMP is working
- ...
Thats a lot of stuff that has to be done in addition to just importing the template file. And I don't remember anymore what I did 1 year go to get everything running. So even if I got the required files (and I found some in backups) I can't use them without the installation instruction of the creators which aren't online anymore. And the user comments on that site were important too. Often the only available integrations were outdated templates that won't work anymore. But often people in the comments got them still running and explained what to change it fix them.
I'm guessing the community templates they added to the repo are the MIT ones and they dropped the GPL ones, based on their new policy. So that would be why there still are a few, but most are missing.
Jup. Its really a shame that they took all the non-MIT templates offline without offering a replacement.
I saw your post in the Zabbix forum. There's a couple tickets open about it. I'm surprised there isn't more uproar, but maybe it's because not enough people have tried to upgrade yet.
Jup, I'm wondering too.
 
Last edited:

Ya, now it is a million steps again! ;)

I realized something last night when trying to get SPICE to start unmuted in Proxmox. Back in the day, you pretty much had to start with some basic tools and conjure up a bunch of perl. Each bit you had to build up yourself. Same with cluster filesystems, vm management, graphing, alerts (modems dialing pagers!) etc. The new tools now do so much, you don't have to figure out anything. But then when something comes up like volume is muted, one has a hard time tracking down where in the whole stack of applications that switch is getting flipped. (I still haven't found it, I just run an unmute script.)

So we're kind of back to square one with OP's need. What is the one true best way to do this with Proxmox? It seems many have no solution running and those that do, all have some sort of custom build.

That said, there is also a lot more of this data available directly in Proxmox itself, than there was in years past. Maybe the question could be framed, what do we need that isn't in there now? Assuming just viewing from outside KVM/CTs.
 
Last edited:
That said, there is also a lot more of this data available directly in Proxmox itself, than there was in years past. Maybe the question could be framed, what do we need that isn't in there now? Assuming just viewing from outside KVM/CTs.
I think a big problem is that RAM usage isn't detailed because the linux qemu-agent won't report how much of the used RAM is used for caching. People always get confused why PVE reports the RAM of a guest to be 90+% used when programs inside the guest are reporting that most of the RAM is availalbe what they they interpret as free. Would be really useful if PVE could display free, used and availabe RAM in the graphs. I already posted how I would like that in the German subforum: https://forum.proxmox.com/threads/realer-ram-verbrauch-von-vms.80645/#post-356420

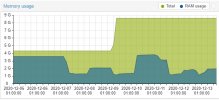
Instead of this...
ram2.jpg
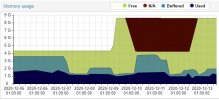
...Something like this would be great:
ram5.jpg
Free and used would be like it' s already done now. N/A (red) is the RAM that can't be used by the VM because it got temporarily taken away by ballooning. Right now, if you give a VM 8GB RAM with 4GB "min RAM" for ballooning, PVE will steal the guest up to 4GB of RAM. In such a case the guest only got 4GB of RAM (free -h inside a guest will also show only 4GB of total RAM) but the PVE graphs will still show 8GB RAM with 4GB of it as free even if that 4GB isn'T availalbe for the guest. Then you run into situations where the guest will report 3.7 of 4GB used + 300MB free while PVE is reporting 3.7GB of 8GB used with 4.3 GB free.
The other addition I would like to see is the "Buffered" (light blue) and "Used" (dark blue). Basically it just means that PVE should show how much of the used RAM is actually used by the guest for caching. So you can see from the PVE webUI if that guest is running out of available RAM or not.

But I guess for that the qemu-guest-agent needs to be changed to make it possible.
 
Last edited:
I'll edit this as I get additions/corrections.

Needs
----------
* System that produces alerts when something has gone bad.
* System that warns when things are getting bad.
* System that allows visualization of metrics to aid in system optimization.
* Monitoring of hardware, such as temperature and failed fans.
* Perhaps extend to monitoring of UPS and other relevant hardware.
* Monitoring of KVM metrics available via qemu-agent.
* Monitoring of KVM metrics not available via qemu-agent (such as KVM cached memory).
* Monitoring of filesystems, such as ZFS (I don't personally use this) and Ceph.
* Monitoring of network switches.

Proxmox + InfluxDB + Grafana + Prometheus
-----------------------------------------------------------------
This is the best setup so far, imho. Proxmox Metric Server and Prometheus node exporters of various flavours export to an InfluxDB server. The data is then viewed in a web browser with Grafana.

Pros:
Uses Proxmox "Metric Server"
InfluxDB is in Debian/Proxmox.
Pretty graphs.
Prometheus is in Debian

Cons:
Grafana isn't in Debian.
General use, no concept of data center


Proxmox + InfluxDB + Grafana + Telegraf
-----------------------------------------------------------
Pros:
Uses Proxmox "Metric Server"
InfluxDB is in Debian/Proxmox.
Pretty graphs.
Can also be used with Chronograf (alternative to Grafana) and Kapacitor (alerts?)

Cons:
Grafana isn't in Debian.
Telegraf isn't in Debian.
Not really good alerting dashboards (yet?)
General use, no concept of data center
Need to set up Telegraf too for sensor data

Prometheus
-----------------
This can be used with

Pros:
In Debian.
Well established.
Many plugins (35 packages in debian repo).


Cons:
No direct Proxmox Metric Server integration. But can work with Influx (iirc), so Metric Server + Influx + Grafana then add Prometheus to pick up metrics like sensors and in-VM monitoring that the Metric Server doesn't cover.


Zabbix
----------
Pros:
Long history
Designed for use in data center
Main application is in Debian
Good for hardware sensors (e.g. hard drive temperature)

Cons:
Appears to be heading in the wrong direction, but was once a viable solution.
No direct Proxmox integration. Could be wrong assumption: but I think it will scrape from a virt lib not consume the Proxmox "Metric Server".


VictoriaMetrics
----------------------
Pros:
Can be used as drop-in replacement for Influx.
Supposedly much higher performance in speed, storage size, and scalability than other solutions.
Can be used with Prometheus.
Should be able to connect directly to Proxmox Metric Server using InfluxDB export.
In Debian.
Has its own Grafana dashboards.

Cons:
Per Debian changes, it doesn't include the web GUI: "Exclude and disable vmui from code, based on TypeScript and node.js, with unclear source provenance."
Has enterprise version with features not in open source version, such as machine learning anomoly detection.


CV4PVE
------------
Pros:
Explicitly made for Proxmox.
Proxmox Certified Partner.
Same free software / subscription model as Proxmox, afaict.
Uses Proxmox "Metric Server".
Uses InfluxDB which is in Debian.
Made a lot of Grafana dashboards usable by everyone.
Suite of many more tools for Proxmox.


Cons:
Requires Telegraf not in Debian.
In C# mostly?
I am setting this up. I used the "Toolbox" docker and all that went smooth. When you log into the web GUI it gives a really obnoxious subscription notice. I configured authentication with the Proxmox cluster and after some fudging, got that to connect and authenticate. But once it finally authenticated, CV4PVE seems to have locked access to other parts of the CV4PVE GUI (???) since I don't have a CV4PVE subscription key. I tried to buy one on their site, but it isn't automated like Proxmox, you have to fill out a request form. Then in the CV4PVE to do a request via that, you have to use an SMTP server, so gotta set up firewall etc. for that. It was looking kind of nice, but the license junk is what I want to avoid... Now I'm logged out of the CV4PVE web gui and can't log back in. hmm. Not sure about this one.


Netdata
------------
I installed this on Debian KVM and on a OPNSense firewall. It collects a *lot* of metrics. The cloud interface, which allows you to see multiple nodes at once, is proprietary service.

There is also a "TV" dashboard, available at http://127.0.0.1:19999/tv.html

When I went to the "TV" URL, it pulled data from "registry.my-netdata.io", despite me not wanting to use any external services. That hostname maps to Google IPs. Sigh.


Pros:
In Debian.
Been around a long time, lots of development.

Cons:
Phones home to proprietary services by default even when using Debian's package.
No direct Proxmox integration (has libvirt and others, but not Proxmox directly).


Check_mk
---------------
Pros:
Established.
Proxmox Integration.

Cons:


PandoraFMS
------------------
Pros:
Proxmox plugin.
Huge featureset.
Agent in Debian repo.

Cons:
"Metaconsole" and other key features are non-free "enterprise".
Doesn't connect directly with "Metric Server".
Server isn't in Debian.
Installation looks long/complex.
"Metaconsole" and other key features are non-free "enterprise".
Small community (three posts in forum in last month).


Graphite
--------------
Pros:
Integrated into Proxmox "Metric Server".

Cons:
Code stagnating? Appears to still be based on obsolete Python 2.7.
Not in Debian.


Nagios & forks
---------------------
Pros:
This has been around for years, tried and true.
Many variations/forks
In Debian
Good for hardware sensors (e.g. hard drive temperature)

Cons:
Many variationsf/forks
No direct Proxmox integration. Could be wrong assumption: but I think it will scrape from a virt lib not consume the Proxmox "Metric Server".

Icinga
---------
Pros:
Old, established.
In Debian.

Cons:
No Proxmox plugin/Metric server.
icingaweb isn't in Debian Bookworm (testing) because it doesn't work with PHP 8.1. Could be problem in future.


Monit
---------
Pros:
In Debian.

Cons:
Looks like MMonit, the web gui, is proprietary (?)


Misc
-------
Also notable:

* Graylog. Centralized logging system. Not in Debian.
* Collectd. Monitoring. Old school, works with lots of other systems. Good for hardware monitoring iirc. In Debian.


Linkies
-----------
Grafana: https://grafana.com/

Grafana Proxmox Dashboards:
https://grafana.com/grafana/dashboa...rce=influxdb&orderBy=updatedAt&direction=desc

InfluxDB: https://www.influxdata.com/products/influxdb-overview/

Telegraf: https://www.influxdata.com/time-series-platform/telegraf/
https://github.com/influxdata/telegraf

Cronograf: https://www.influxdata.com/time-series-platform/chronograf/
https://github.com/influxdata/chronograf

Kapacitor: https://www.influxdata.com/time-series-platform/kapacitor/
https://github.com/influxdata/kapacitor

Prometheus: https://prometheus.io/

Monit: https://mmonit.com/monit/

Zabbix: https://www.zabbix.com/

CV4PVE: https://www.cv4pve-tools.com/en/
CV4PVE Proxmox: https://www.corsinvest.it/proxmox/?lang=en

PandoraFMS: https://pandorafms.com/en/

CollectD: https://collectd.org/

Graphite: https://graphiteapp.org/

Nagios: https://www.nagios.org/

Icinga: https://icinga.com/

Checkmk: https://checkmk.com/
https://checkmk.com/blog/proxmox-monitoring

Graylog: https://www.graylog.org/

Netdata: https://www.netdata.cloud/

VictoriaMetrics: https://docs.victoriametrics.com/Single-server-VictoriaMetrics.html
https://docs.victoriametrics.com/Single-server-VictoriaMetrics.html

Cacti: in Debian. https://www.cacti.net/ Web frontend for RRD tool.

Also note OPNSense includes plugins for: collectd, munin, snmp, netdata, Prometheus, ntopng, and zabbix.
 
Last edited:
  • Like
Reactions: DerDanilo and tjk
I think a big problem is that RAM usage isn't detailed because the linux qemu-agent won't report how much of the used RAM is used for caching.

Ha! Exactly, I was thinking this myself. I have one system that I give a lot of RAM for just for the caching, but it appears to be the "worst". This is true whether you use Proxmox internal graphs or view InfluxDB data with Grafana. Really qemu limitation afaict, not necessarily Proxmox.
 
Someone knows if PVE is reporting smart attributes, ZFS pool states, ZFS ARC stats and number of availalbe updates through its metrics output? All things that I would personally require of a monitoring tool to monitor. And failed fans/temperatures too, but I guess thats to hardware specific for PVE to monitor.
 
Last edited:
ZFS pool states

From the API. "The state of the zpool":
https://pve.proxmox.com/pve-docs/api-viewer/#/nodes/{node}/disks/zfs/{name}

I don't see anything for ARC, but it could be in the array it dumps. As a side note, I did notice collectd has ZFS ARC support, afaict.

> smart attributes

https://pve.proxmox.com/pve-docs/api-viewer/#/nodes/{node}/disks/smart

> updates

"List available updates"
https://pve.proxmox.com/pve-docs/api-viewer/#/nodes/{node}/apt/update

You can see the output of these commands also on the command line, ala:

Bash:
# To see list from top:
pvesh get /

# Get list of nodes:
pvesh get /nodes

# To get smart for /dev/sda on node rs1. Note: change "rs1" for your node name.
pvesh get /nodes/rs1/disks/smart/ --disk /dev/sda --noborder 1  --output-format json-pretty

From what I can tell, these aren't all available via the Metric Server.
 
Last edited:
  • Like
Reactions: Dunuin
I'll edit this as I get additions/corrections.

Needs
----------
* System that produces alerts when something has gone bad.
* System that warns when things are getting bad.
* System that allows visualization of metrics to aid in system optimization.
* Monitoring of hardware, such as temperature and failed fans.
* Perhaps extend to monitoring of UPS and other relevant hardware.
* Monitoring of KVM metrics available via qemu-agent.
* Monitoring of KVM metrics not available via qemu-agent (such as KVM cached memory).
* Monitoring of filesystems, such as ZFS (I don't personally use this) and Ceph.
* Monitoring of network switches.

Proxmox + InfluxDB + Grafana + Prometheus
-----------------------------------------------------------------
This is the best setup so far, imho. Proxmox Metric Server and Prometheus node exporters of various flavours export to an InfluxDB server. The data is then viewed in a web browser with Grafana.

Pros:
Uses Proxmox "Metric Server"
InfluxDB is in Debian/Proxmox.
Pretty graphs.
Prometheus is in Debian

Cons:
Grafana isn't in Debian.
General use, no concept of data center


Proxmox + InfluxDB + Grafana + Telegraf
-----------------------------------------------------------
Pros:
Uses Proxmox "Metric Server"
InfluxDB is in Debian/Proxmox.
Pretty graphs.
Can also be used with Chronograf (alternative to Grafana) and Kapacitor (alerts?)

Cons:
Grafana isn't in Debian.
Telegraf isn't in Debian.
Not really good alerting dashboards (yet?)
General use, no concept of data center
Need to set up Telegraf too for sensor data

Prometheus
-----------------
This can be used with

Pros:
In Debian.
Well established.
Many plugins (35 packages in debian repo).


Cons:
No direct Proxmox Metric Server integration. But can work with Influx (iirc), so Metric Server + Influx + Grafana then add Prometheus to pick up metrics like sensors and in-VM monitoring that the Metric Server doesn't cover.


Zabbix
----------
Pros:
Long history
Designed for use in data center
Main application is in Debian
Good for hardware sensors (e.g. hard drive temperature)

Cons:
Appears to be heading in the wrong direction, but was once a viable solution.
No direct Proxmox integration. Could be wrong assumption: but I think it will scrape from a virt lib not consume the Proxmox "Metric Server".


VictoriaMetrics
----------------------
Pros:
Can be used as drop-in replacement for Influx.
Supposedly much higher performance in speed, storage size, and scalability than other solutions.
Can be used with Prometheus.
Should be able to connect directly to Proxmox Metric Server using InfluxDB export.
In Debian.
Has its own Grafana dashboards.

Cons:
Smaller community ?
Not as established?
Per Debian changes, it doesn't include the web GUI: "Exclude and disable vmui from code, based on TypeScript and node.js, with unclear source provenance."


CV4PVE
------------
Pros:
Explicitly made for Proxmox.
Proxmox Certified Partner.
Same free software / subscription model as Proxmox, afaict.
Uses Proxmox "Metric Server".
Uses InfluxDB which is in Debian.
Made a lot of Grafana dashboards usable by everyone.
Suite of many more tools for Proxmox.


Cons:
Requires Telegraf not in Debian.
In C# mostly?
I am setting this up. I used the "Toolbox" docker and all that went smooth. When you log into the web GUI it gives a really obnoxious subscription notice. I configured authentication with the Proxmox cluster and after some fudging, got that to connect and authenticate. But once it finally authenticated, CV4PVE seems to have locked access to other parts of the CV4PVE GUI (???) since I don't have a CV4PVE subscription key. I tried to buy one on their site, but it isn't automated like Proxmox, you have to fill out a request form. Then in the CV4PVE to do a request via that, you have to use an SMTP server, so gotta set up firewall etc. for that. It was looking kind of nice, but the license junk is what I want to avoid... Now I'm logged out of the CV4PVE web gui and can't log back in. hmm. Not sure about this one.


Netdata
------------
I installed this on Debian KVM and on a OPNSense firewall. It collects a *lot* of metrics. The cloud interface, which allows you to see multiple nodes at once, is proprietary service.

There is also a "TV" dashboard, available at http://127.0.0.1:19999/tv.html

When I went to the "TV" URL, it pulled data from "registry.my-netdata.io", despite me not wanting to use any external services. That hostname maps to Google IPs. Sigh.


Pros:
In Debian.
Been around a long time, lots of development.

Cons:
Phones home to proprietary services by default even when using Debian's package.
No direct Proxmox integration (has libvirt and others, but not Proxmox directly).


Check_mk
---------------
Pros:
Established.
Proxmox Integration.

Cons:


PandoraFMS
------------------
Pros:
Proxmox plugin.
Huge featureset.
Agent in Debian repo.

Cons:
"Metaconsole" and other key features are non-free "enterprise".
Doesn't connect directly with "Metric Server".
Server isn't in Debian.
Installation looks long/complex.
"Metaconsole" and other key features are non-free "enterprise".
Small community (three posts in forum in last month).


Graphite
--------------
Pros:
Integrated into Proxmox "Metric Server".

Cons:
Code stagnating? Appears to still be based on obsolete Python 2.7.
Not in Debian.


Nagios & forks
---------------------
Pros:
This has been around for years, tried and true.
Many variations/forks
In Debian
Good for hardware sensors (e.g. hard drive temperature)

Cons:
Many variationsf/forks
No direct Proxmox integration. Could be wrong assumption: but I think it will scrape from a virt lib not consume the Proxmox "Metric Server".

Icinga
---------
Pros:
Old, established.
In Debian.

Cons:
No Proxmox plugin/Metric server.
icingaweb isn't in Debian Bookworm (testing) because it doesn't work with PHP 8.1. Could be problem in future.


Monit
---------
Pros:
In Debian.

Cons:
Looks like MMonit, the web gui, is proprietary (?)


Misc
-------
Also notable:

* Graylog. Centralized logging system. Not in Debian.
* Collectd. Monitoring. Old school, works with lots of other systems. Good for hardware monitoring iirc. In Debian.


Linkies
-----------
Grafana: https://grafana.com/

Grafana Proxmox Dashboards:
https://grafana.com/grafana/dashboa...rce=influxdb&orderBy=updatedAt&direction=desc

InfluxDB: https://www.influxdata.com/products/influxdb-overview/

Telegraf: https://www.influxdata.com/time-series-platform/telegraf/
https://github.com/influxdata/telegraf

Cronograf: https://www.influxdata.com/time-series-platform/chronograf/
https://github.com/influxdata/chronograf

Kapacitor: https://www.influxdata.com/time-series-platform/kapacitor/
https://github.com/influxdata/kapacitor

Prometheus: https://prometheus.io/

Monit: https://mmonit.com/monit/

Zabbix: https://www.zabbix.com/

CV4PVE: https://www.cv4pve-tools.com/en/
CV4PVE Proxmox: https://www.corsinvest.it/proxmox/?lang=en

PandoraFMS: https://pandorafms.com/en/

CollectD: https://collectd.org/

Graphite: https://graphiteapp.org/

Nagios: https://www.nagios.org/

Icinga: https://icinga.com/

Checkmk: https://checkmk.com/
https://checkmk.com/blog/proxmox-monitoring

Graylog: https://www.graylog.org/

Netdata: https://www.netdata.cloud/

VictoriaMetrics: https://docs.victoriametrics.com/Single-server-VictoriaMetrics.html
https://docs.victoriametrics.com/Single-server-VictoriaMetrics.html

Cacti: in Debian. https://www.cacti.net/ Web frontend for RRD tool.

Also note OPNSense includes plugins for: collectd, munin, snmp, netdata, Prometheus, ntopng, and zabbix.
VictoriaMetrics
----------------------


Cons:
1) Smaller community ?
2) Not as established?
3) Per Debian changes, it doesn't include the web GUI: "Exclude and disable vmui from code, based on TypeScript and node.js, with unclear source provenance."

1) It has a big community on github but Quantity doesn't always equate to Quality =)
2) What do you mean?
3) All source code is stored on github and have Apache 2.0 License so you can fork and build what you want but better to send your PR's to repository.
 
1) It has a big community on github but Quantity doesn't always equate to Quality =)
2) What do you mean?
3) All source code is stored on github and have Apache 2.0 License so you can fork and build what you want but better to send your PR's to repository.

1) ok, I edited that.
2) I edited that too. But what I meant is it (as it appeared to me) to not have been around as long as some of the others.
3) Apparently Debian Developers found licensing issues with the web GUI, so perhaps it isn't all under apache license. I don't know the details, but Debian Developers are generally pretty particular about these issues. I also don't want to fork, I just want to find something nice to run. :) I also don't log into microsoft github, so I won't send PRs.

I do see there is an "Enterprise" version with features not in the open source version, which is a con, in my view.

Thanks for the info. :)

-Jeff
 
Last edited:
FWIW, I've used collectd feeding into influxdb and viewed using grafana. collectd has a plugin for KVM called "virt". prometheus also has a libvirt exporter. If you wanted to dig into it some more, you can setup individual process monitoring matching for the kvm processes with collectd/prometheus (I haven't tried this) but it might not give you anything better than the virt plugins already provide.
 
  • Like
Reactions: jebbam
I just set up a KVM with influxdb and another KVM with Grafana. I didn't follow this, but it pretty much summarizes it:

https://melvin.ovh/proxmox-monitoring-with-influxdb-and-grafana/

I just used the web GUI on the Proxmox side to add the InfluxDB config. Proxmox dumps the data to InfluxDB, then Grafana reads that. I imported Grafana dashboard # 12910, and it looks really swell.

So built in Proxmox + InfluxDB + Grafana looks to be a good (partial) solution at least.
but it's on node basis, I think cluster view will be better.
 
If you use cluster - yes, but many people do not use clusters. =)
Sure.
I am considering to use PVE as private cloud infra for one of my customer, who needs tens of VM and storage sharing solution. Anyhow, PVE is a very good hyper-convergency platform, integrated ceph, role based management and HA function are very easy to use.
 

About

The Proxmox community has been around for many years and offers help and support for Proxmox VE, Proxmox Backup Server, and Proxmox Mail Gateway.
We think our community is one of the best thanks to people like you!

Get your subscription!

The Proxmox team works very hard to make sure you are running the best software and getting stable updates and security enhancements, as well as quick enterprise support. Tens of thousands of happy customers have a Proxmox subscription. Get yours easily in our online shop.

Buy now!