Proxmox Metrics Server - InfluxDB Cloud - Bug?

LGX550

New Member
Dec 25, 2024
6
1
3
I'm honestly starting to lose the will to live here—maybe I've just been staring at this for too long. At first glance, it looks like a Grafana issue, but I really don't think it is.

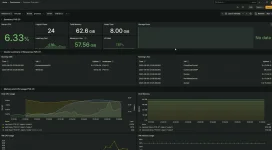
I was self-hosting an InfluxDB instance on a Proxmox LXC, which fed into a self-hosted Grafana LXC. Recently, I switched over to the cloud-hosted versions of both InfluxDB and Grafana. Everything's working great—except for one annoying thing: my Proxmox metrics are coming through fine except for the storage pools.

Back when everything was self-hosted, I could see LVM, ZFS, and all the disk-related metrics just fine. Now? Nothing. I’ve checked InfluxDB, and sure enough, that data is completely missing—anything related to the Proxmox host’s disks is just blank.

Looking into the system logs on Proxmox, I see this:
pvestatd[2227]: metrics send error 'influxdb': 400 Bad Request.

Now, you and I both know it's not a totally bad request—some metrics are getting through. So I’m wondering: could it be that the disk-related metrics are somehow malformed and triggering the 400 response specifically?

Is this a known issue with the metric server config when using InfluxDB Cloud? Every guide I’ve found assumes you're using a local InfluxDB instance with a LAN IP and port. I haven’t seen any that cover a cloud-based setup.

Has anyone run into this before? And if so... how did you fix it?proxmox-metrics-server-influxdb-cloud-bug-v0-g2uwvj45vr4f1.webp
 
Could the cloud instance of InfluxDB be rate limiting amount of data your node is sending to it? Do you have to pay for API costs and how many calls is it making to the cloud to store the data? When you query the data using the Grafana Dashboard is that also making API calls to visualise all the data?

Just some things I usually think of when cloud based hosting anything.
 
any logs on the cloud side that might give an indication? it does look like the cloud version rejects those measurements, where the local one accepted them..
 
Could the cloud instance of InfluxDB be rate limiting amount of data your node is sending to it? Do you have to pay for API costs and how many calls is it making to the cloud to store the data? When you query the data using the Grafana Dashboard is that also making API calls to visualise all the data?

Just some things I usually think of when cloud based hosting anything.
I don’t think it’s a limit, because literally every panel in the dashboard down the most obscure LXC/VM metrics is coming through, it’s literally just the storage pool/host disk data. I’m not sure how familiar you are with InfluxDB but if you use the data explorer (so taking Grafana out the equation entirely) you can browse the data. If I select system > disk, I can see all metrics for each LXC and VM. If I filter that by host and chose PVE-01 which is the proxmox host itself, there is no data. It’s the only thing missing data so I think it’s proxmox isn’t fully compatible with the cloud solution.
 
any logs on the cloud side that might give an indication? it does look like the cloud version rejects those measurements, where the local one accepted them..
Frustratingly, I don’t think the cloud solution provide access to their logs. I could perhaps request them, but having a look online, it looks like someone’s opened a feature request on git with no acknowledgment. Might have to go back to self hosting, which is a shame, as the cloud options are powerful, given they’re currently free
 
any logs on the cloud side that might give an indication? it does look like the cloud version rejects those measurements, where the local one accepted them..
Out of curiosity, would you have the ability to try and replicate it and see if it’s a me issue? The cloud instance of InfluxDB is free (with a 30 day log limit).

If it’s not just a me thing; it would be a good thing to have documented for the community
 
Just wanted to report that I just setup a new cloud InfluxDB and having the exact same issue. I've not dug any deeper into this other then some quick google search .. I'm running PVE 9.
 
YES! Finally someone else – at least I know I’m not alone.

I suspect it’s an issue with how Proxmox sends the metrics. The InfluxDB cloud instances might expect a different format or authentication method.

As a workaround, I reverted to running a self-hosted InfluxDB container on my cloud VPS, and then forwarding those metrics to Grafana Cloud. With that setup, disk metrics work perfectly. The problem definitely seems to be with Proxmox sending data directly to InfluxDB Cloud.

@fabian FYI – not saying Proxmox itself is the root cause, but perhaps it could help work around whatever’s happening on Influx’s side, now that two people have replicated it.
 
I was able to reproduce your issue with a local InfluxDB 3.4.1. While InfluxDB 3.x has a new v3 API, it also provides v2 and v1 compatibility APIs. At this moment, Proxmox VE implements the v2 API of InfluxDB, which is compatible with InfluxDB 3.x using its compatibility API. However, there are some small differences when using the v2 compatibility API compared to the native v2 API (with InfluxDB 2.x) with InfluxDB 3.x now refusing our API call:
2025-09-04T16:17:33.766052Z DEBUG influxdb3_catalog::catalog::versions::v2::update: starting catalog transaction db_name="proxmox"
2025-09-04T16:17:33.766120Z ERROR influxdb3_server::http: Error while handling request error=write buffer error: parsing for line protocol failed method=POST path="/api/v2/write" content_length=Some("1374") client_ip=192.168.23.163
2025-09-04T16:17:33.766129Z DEBUG influxdb3_server::http: API error error=WriteBuffer(ParseError(WriteLineError { original_line: "system,object=storages,nodename=node3,host=local-lvm2,type=lvm active=1,avail=11949572096,content=images,rootdir,enabled=1,shared=0,total=96095698944,type=lvm,used=84146126848 1757002650000000000", line_number: 1, error_message: "invalid column type for column 'type', expected iox::column_type::tag, got iox::column_type::field::string" }))
2025-09-04T16:17:34.730571Z DEBUG influxdb3_authz: time comparison expiry_ms=9223372036854775807 current_timestamp_ms=1757002654730
2025-09-04T16:17:34.730607Z DEBUG influxdb3_write::write_buffer: write_lp to proxmox in writebuffer

In the meantime, you can use the older InfluxDB 2.x to work around this issue.

To elaborate, the error above means that we cannot use the "type" both as a tag and as a field, so we'll need to choose either one or the other. Please let us know how you are currently using the information written by Proxmox VE to the InfluxDB (especially regarding the storage type) so that we can decide what's the best choice.
 
I was able to reproduce your issue with a local InfluxDB 3.4.1. While InfluxDB 3.x has a new v3 API, it also provides v2 and v1 compatibility APIs. At this moment, Proxmox VE implements the v2 API of InfluxDB, which is compatible with InfluxDB 3.x using its compatibility API. However, there are some small differences when using the v2 compatibility API compared to the native v2 API (with InfluxDB 2.x) with InfluxDB 3.x now refusing our API call:


In the meantime, you can use the older InfluxDB 2.x to work around this issue.

To elaborate, the error above means that we cannot use the "type" both as a tag and as a field, so we'll need to choose either one or the other. Please let us know how you are currently using the information written by Proxmox VE to the InfluxDB (especially regarding the storage type) so that we can decide what's the best choice.
Apologies for the delay @l.leahu-vladucu - That's what I opted to do, I self hosted an influxdb 2.x container and forwarded my metrics to that instead. The grafana dashboards now all work as expected.

To confirm, in terms of the data use, I think the issue lies with the "system" and "avail" metrics.

Looking at the data in influxdb 2.X explorer, I can see that these metrics are coming through:
|> filter(fn: (r) => r["_measurement"] == "system")
|> filter(fn: (r) => r["_field"] == "avail")
|> filter(fn: (r) => r["object"] == "storages")
|> filter(fn: (r) => r["nodename"] == "PVE-01")

However, when using InfluxCloud (and therefor the V3), those metrics never reach. I hope I've understood your question correctly.
 
  • Like
Reactions: Johannes S