I'm a bit confused regarding "Disk IO" graph (per VM) in Proxmox. The different thread where this topic is discussed concludes that:
In that case, if it's a total written/read from the drive, why is "month (maximum)" different from "month (average)" (or any other time scope)?
I just can't wrap my head around it and I don't know how to interpret that data. In my head it would make sense if that was a rate, not a total; "average write rate was 2MB/s yesterday, but the maximum was at 2:00 with 5MB/s".
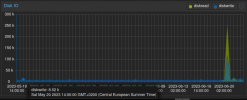
And this difference between "average" and "maximum" is really huge, as can be seen on the attached screenshots.
The average was 8.52k, while maximum was 552.93k diskwrite at the same moment in time:
How should I understand those values? I don't know how to comprehend that data. Disk IO should always be a sum in a given day/hours, right? I don't know, I find it confusing...
*I don't care about the GB/GiB here, nor do I care about the difference about bits/bytes in this question.
**I've just carried out an experiment and no - my prediction was wrong but I'm keeping it in just to show my line of thinking.
which indicates to me that it's a total amount of data written/read in a particular window of time. So, from what I understand, it's a total written/read and not the rate of reading/writing. So if I download a 10GB file at 17:00 within 1 hour on guest OS, I should get on the graph:The graph just shows the amount of data read/written (y-axis) at a particular moment in time (x-axis).
- a spike at 17:00 (or 17:30) at a month time scope with "10G"* diskwrite;
- a hill from 17:00 to 18:00 at an hour time scope with values adding up to 10G* diskwrite.
In that case, if it's a total written/read from the drive, why is "month (maximum)" different from "month (average)" (or any other time scope)?
I just can't wrap my head around it and I don't know how to interpret that data. In my head it would make sense if that was a rate, not a total; "average write rate was 2MB/s yesterday, but the maximum was at 2:00 with 5MB/s".
And this difference between "average" and "maximum" is really huge, as can be seen on the attached screenshots.
The average was 8.52k, while maximum was 552.93k diskwrite at the same moment in time:
How should I understand those values? I don't know how to comprehend that data. Disk IO should always be a sum in a given day/hours, right? I don't know, I find it confusing...
*I don't care about the GB/GiB here, nor do I care about the difference about bits/bytes in this question.
**I've just carried out an experiment and no - my prediction was wrong but I'm keeping it in just to show my line of thinking.


