Hello,
I am using proxmox :
and Influx :
At attachment "example.txt" there is segment with full stat of one VM from pvesh
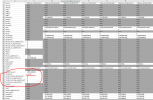
At attachment proxmox influxdb.zip there is "proxmox influxdb.xlsx" and there are collected by me stored inside influx db records about that VM (influxdb proxmox.png have little screen of it)
I cannot see there details about VM each disks and network cards.
here are details which I want to collect to my influxDB :
How can I set proxmox to sent also details about each VM disks and Network card like above?
I am using proxmox :
Code:
Kernel Version Linux 5.4.174-2-pve #1 SMP PVE 5.4.174-2 (Thu, 10 Mar 2022 15:58:44 +0100)
PVE Manager Version pve-manager/6.4-14/15e2bf61
and Influx :
Code:
ii influxdb 1.8.10-1 amd64 Distributed time-series database.At attachment "example.txt" there is segment with full stat of one VM from pvesh
Code:
pvesh get /nodes/hv-01/qemu --full --output-format jsonI cannot see there details about VM each disks and network cards.
here are details which I want to collect to my influxDB :
Code:
"blockstat":
{
"scsi0":{"account_failed":true,"account_invalid":true,"failed_flush_operations":0,"failed_rd_operations":0,"failed_unmap_operations":0,"failed_wr_operations":0,"flush_operations":114908,"flush_total_time_ns":448202082073,"idle_time_ns":4126170798,"invalid_flush_operations":0,"invalid_rd_operations":0,"invalid_unmap_operations":0,"invalid_wr_operations":0,"rd_bytes":2463664640,"rd_merged":0,"rd_operations":94579,"rd_total_time_ns":1596859366612,"timed_stats":[],"unmap_bytes":0,"unmap_merged":0,"unmap_operations":0,"unmap_total_time_ns":0,"wr_bytes":7482962944,"wr_highest_offset":4592762880,"wr_merged":0,"wr_operations":313908,"wr_total_time_ns":757006614639},
"scsi1":{"account_failed":true,"account_invalid":true,"failed_flush_operations":6,"failed_rd_operations":0,"failed_unmap_operations":0,"failed_wr_operations":54,"flush_operations":6185,"flush_total_time_ns":103381006837,"idle_time_ns":1344657303429953,"invalid_flush_operations":0,"invalid_rd_operations":0,"invalid_unmap_operations":0,"invalid_wr_operations":0,"rd_bytes":115831251968,"rd_merged":0,"rd_operations":465818,"rd_total_time_ns":8450940898769,"timed_stats":[],"unmap_bytes":0,"unmap_merged":0,"unmap_operations":0,"unmap_total_time_ns":0,"wr_bytes":152182001152,"wr_highest_offset":8053161984,"wr_merged":0,"wr_operations":545601,"wr_total_time_ns":2674354264307},
"scsi2":{"account_failed":true,"account_invalid":true,"failed_flush_operations":0,"failed_rd_operations":0,"failed_unmap_operations":0,"failed_wr_operations":0,"flush_operations":15247,"flush_total_time_ns":71228578657,"idle_time_ns":45081127103,"invalid_flush_operations":0,"invalid_rd_operations":0,"invalid_unmap_operations":0,"invalid_wr_operations":0,"rd_bytes":18556656640,"rd_merged":0,"rd_operations":75414,"rd_total_time_ns":2438460059165,"timed_stats":[],"unmap_bytes":0,"unmap_merged":0,"unmap_operations":0,"unmap_total_time_ns":0,"wr_bytes":23353269248,"wr_highest_offset":10737209344,"wr_merged":0,"wr_operations":57375,"wr_total_time_ns":887204080995},
"scsi3":{"account_failed":true,"account_invalid":true,"failed_flush_operations":0,"failed_rd_operations":0,"failed_unmap_operations":0,"failed_wr_operations":0,"flush_operations":39435,"flush_total_time_ns":184995896645,"idle_time_ns":6168082728,"invalid_flush_operations":0,"invalid_rd_operations":0,"invalid_unmap_operations":0,"invalid_wr_operations":0,"rd_bytes":87174152192,"rd_merged":0,"rd_operations":343102,"rd_total_time_ns":11856325866362,"timed_stats":[],"unmap_bytes":0,"unmap_merged":0,"unmap_operations":0,"unmap_total_time_ns":0,"wr_bytes":107944176128,"wr_highest_offset":53687091200,"wr_merged":0,"wr_operations":240359,"wr_total_time_ns":5849206289341},
"scsi4":{"account_failed":true,"account_invalid":true,"failed_flush_operations":6,"failed_rd_operations":0,"failed_unmap_operations":0,"failed_wr_operations":174,"flush_operations":4078,"flush_total_time_ns":72734784736,"idle_time_ns":1347421136333430,"invalid_flush_operations":0,"invalid_rd_operations":0,"invalid_unmap_operations":0,"invalid_wr_operations":0,"rd_bytes":40565722112,"rd_merged":0,"rd_operations":160347,"rd_total_time_ns":5577806110380,"timed_stats":[],"unmap_bytes":0,"unmap_merged":0,"unmap_operations":0,"unmap_total_time_ns":0,"wr_bytes":35363630592,"wr_highest_offset":25917964288,"wr_merged":0,"wr_operations":71372,"wr_total_time_ns":1971520114514}
},
Code:
"nics":
{
"tap6008i0":{"netin":"94169710","netout":"2205828"},
"tap6008i1":{"netin":"355861985367","netout":"299086920427"}
},
How can I set proxmox to sent also details about each VM disks and Network card like above?


