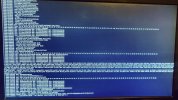
Kernel Panic, whole server crashes about every day

Not sure it's only AMD related....

I've got the same sort of kernel panic on a Dell R710 with Intel xeon.
The kernel panic from that log was just looking plain random, so I'm not sure if that has to be the case or if one can even just determine that from such random looking events.

Can you post yours here, without being able to reproduce it ourselves we need as much of relevant (!) logs and basic system info (exact CPU, what guests OS run, maybe even a VM config), so that we can actually narrow it down enough to find the actual issue at play. There could be more than one here, as said one kernel panic is not necessarily connected to the others, and from experience such threads tend to attract all which observed anything looking like a kernel oops, even if something completely different.
 
  • Like
Reactions: tikismoke
@t.lamprecht I'm on Intel as well and I'm successful in reproducing the panic with fio i/o test tool running on a vm, it crashes every time i run it with a high load, but the kernel panic doesn't print anything, it cuts of and the last line just shows a bunch of ^@^@^@.
I tried capturing a kernel panic with kdump-tools but I get the following when it tries to make a dump prox kdump-tools[787]: The kernel version is not supported., guess the tool doesn't like kernel 5.11

Edit: Using netconsole, I managed to capture a panic:

$ nc -l -p 5555 -u | sudo tee /var/log/netconsole/crash.log
[ 825.247549] BUG: kernel NULL pointer dereference, address: 00000000000000a0
[ 825.251136] #PF: supervisor read access in kernel mode
[ 825.254964] #PF: error_code(0x0000) - not-present page
[ 825.258899] PGD 0 P4D 0
[ 825.262724] Oops: 0000 [#1] SMP PTI
[ 825.266622] CPU: 3 PID: 2330 Comm: kvm Tainted: P O 5.11.22-1-pve #1
[ 825.270278] Hardware name: To Be Filled By O.E.M. To Be Filled By O.E.M./Z270M Extreme4, BIOS P2.30 01/18/2018
[ 825.274003] RIP: 0010:io_prep_async_work+0x1f6/0x2f0
[ 825.276899] Code: 01 00 48 c7 87 c0 00 00 00 00 00 00 00 48 c7 87 b8 00 00 00 00 00 00 00 48 c7 87 c8 00 00 00 00 00 00 00 48 83 c1 58 89 47 58 <48> 8b 51 48 48 89 97 c0 00 00 00 48 39 ca 0f 84 28 fe ff ff 48 8d
[ 825.279667] RSP: 0018:fffface9401a0ce0 EFLAGS: 00010002
[ 825.282221] RAX: 0000000000011000 RBX: 0000000000000001 RCX: 0000000000000058
[ 825.284568] RDX: ffff91bc8e6418c0 RSI: ffff91bc8d0d2d00 RDI: ffff91bc8903ec00
[ 825.286764] RBP: fffface9401a0d00 R08: fffface9401a0c50 R09: 0000000000000010
[ 825.288917] R10: 0000000000100000 R11: 000000007ffff000 R12: ffff91bc8903ec00
[ 825.290839] R13: ffff91bc93904400 R14: 0000000000000001 R15: ffff91bc8903fc18
[ 825.292792] FS: 00007f3b14f1b700(0000) GS:ffff91cbafcc0000(0000) knlGS:0000000000000000
[ 825.294644] CS: 0010 DS: 0000 ES: 0000 CR0: 0000000080050033
[ 825.296432] CR2: 00000000000000a0 CR3: 0000000480d5a006 CR4: 00000000003726e0
[ 825.298230] DR0: 0000000000000000 DR1: 0000000000000000 DR2: 0000000000000000
[ 825.299919] DR3: 0000000000000000 DR6: 00000000fffe0ff0 DR7: 0000000000000400
[ 825.301579] Call Trace:
[ 825.303233] <IRQ>
[ 825.304700] io_rw_reissue+0xb1/0xf0
[ 825.306131] io_complete_rw+0x18/0x40
[ 825.307574] blkdev_bio_end_io+0x80/0x100
[ 825.309008] bio_endio+0xe0/0x130
[ 825.310454] dec_pending+0x154/0x250
[ 825.311922] clone_endio+0x9c/0x220
[ 825.313376] bio_endio+0xe0/0x130
[ 825.314816] blk_update_request+0x227/0x390
[ 825.316268] blk_mq_end_request+0x21/0x140
[ 825.317716] nvme_complete_rq+0x7e/0x220
[ 825.319159] nvme_pci_complete_rq+0x58/0xe0
[ 825.320616] nvme_process_cq+0x15f/0x200
[ 825.322055] nvme_irq+0x14/0x30
[ 825.323495] __handle_irq_event_percpu+0x45/0x170
[ 825.324953] handle_irq_event+0x59/0xc0
[ 825.326393] handle_edge_irq+0x8c/0x220
[ 825.327845] asm_call_irq_on_stack+0x12/0x20
[ 825.329273] </IRQ>
[ 825.330734] common_interrupt+0xbe/0x140
[ 825.332158] ? vmx_set_hv_timer+0x36/0x100 [kvm_intel]
[ 825.333576] asm_common_interrupt+0x1e/0x40
[ 825.334999] RIP: 0010:vmx_do_interrupt_nmi_irqoff+0x13/0x20 [kvm_intel]
[ 825.336427] Code: 5a 41 59 41 58 5e 5f 5a 59 58 5d c3 66 66 2e 0f 1f 84 00 00 00 00 00 55 48 89 e5 48 83 e4 f0 6a 18 55 9c 6a 10 e8 62 62 19 d8 <48> 89 ec 5d c3 0f 1f 84 00 00 00 00 00 0f 1f 44 00 00 55 49 89 f8
[ 825.337899] RSP: 0018:fffface94ff43d80 EFLAGS: 00000082
[ 825.339386] RAX: 0000000000000180 RBX: ffff91c0198c0000 RCX: 00000000621654df
[ 825.340884] RDX: ffffffff00000000 RSI: fffa956d624d8f18 RDI: ffffffff99400180
[ 825.342420] RBP: fffface94ff43d80 R08: 0000000000000000 R09: 0000000000000000
[ 825.343925] R10: 0000000000000000 R11: 0000000000000000 R12: 0000000080000022
[ 825.345436] R13: 0000000000000000 R14: fffface94fe86378 R15: ffff91c0198c0ea8
[ 825.346948] ? irq_entries_start+0x10/0x660
[ 825.348443] vmx_handle_exit_irqoff+0x14f/0x260 [kvm_intel]
[ 825.349954] kvm_arch_vcpu_ioctl_run+0xb8a/0x1800 [kvm]
[ 825.351481] ? do_futex+0x7c4/0xb90
[ 825.352978] ? kvm_vm_ioctl+0x4c9/0xed0 [kvm]
[ 825.354494] kvm_vcpu_ioctl+0x247/0x5f0 [kvm]
[ 825.356021] ? kvm_on_user_return+0x68/0xa0 [kvm]
[ 825.357532] __x64_sys_ioctl+0x91/0xc0
[ 825.359022] do_syscall_64+0x38/0x90
[ 825.360525] entry_SYSCALL_64_after_hwframe+0x44/0xa9
[ 825.362028] RIP: 0033:0x7f3b1ff7dcc7
[ 825.363533] Code: 00 00 00 48 8b 05 c9 91 0c 00 64 c7 00 26 00 00 00 48 c7 c0 ff ff ff ff c3 66 2e 0f 1f 84 00 00 00 00 00 b8 10 00 00 00 0f 05 <48> 3d 01 f0 ff ff 73 01 c3 48 8b 0d 99 91 0c 00 f7 d8 64 89 01 48
[ 825.365093] RSP: 002b:00007f3b14f16408 EFLAGS: 00000246 ORIG_RAX: 0000000000000010
[ 825.366667] RAX: ffffffffffffffda RBX: 000000000000ae80 RCX: 00007f3b1ff7dcc7
[ 825.368241] RDX: 0000000000000000 RSI: 000000000000ae80 RDI: 0000000000000018
[ 825.369810] RBP: 0000563955161650 R08: 000056395444c4a8 R09: 000000000000ffff
[ 825.371380] R10: 0000000000000001 R11: 0000000000000246 R12: 0000000000000000
[ 825.372992] R13: 000056395489de00 R14: 0000000000000002 R15: 0000000000000000
[ 825.374580] Modules linked in: netconsole md4 cmac nls_utf8 cifs libarc4 fscache libdes vfio_pci vfio_virqfd veth ebtable_filter ebtables ip_set ip6table_raw iptable_raw ip6table_filter ip6_tables iptable_filter bpfilter softdog nfnetlink_log nfnetlink intel_rapl_msr intel_rapl_common x86_pkg_temp_thermal intel_powerclamp coretemp kvm_intel crct10dif_pclmul ghash_clmulni_intel aesni_intel crypto_simd mei_hdcp cryptd huawei_cdc_ncm glue_helper cdc_wdm rapl option cdc_ncm intel_cstate cdc_ether usb_wwan pcspkr intel_wmi_thunderbolt efi_pstore mxm_wmi mei_me usbnet ee1004 mii usbserial cdc_acm mei acpi_pad mac_hid zfs(PO) zunicode(PO) zzstd(O) zlua(O) zavl(PO) icp(PO) zcommon(PO) znvpair(PO) spl(O) vhost_net vhost vhost_iotlb tap ib_iser rdma_cm iw_cm ib_cm ib_core iscsi_tcp libiscsi_tcp libiscsi scsi_transport_iscsi nct6775 hwmon_vid sunrpc ip_tables x_tables autofs4 btrfs blake2b_generic xor raid6_pq libcrc32c kvmgt i915 i2c_algo_bit drm_kms_helper syscopyarea sysfillrect sysimgblt
[ 825.374623] fb_sys_fops cec rc_core drm vfio_mdev mdev kvm irqbypass vfio_iommu_type1 vfio hid_generic usbhid hid uas usb_storage i2c_i801 xhci_pci xhci_pci_renesas mpt3sas e1000e ahci raid_class crc32_pclmul i2c_smbus libahci scsi_transport_sas xhci_hcd wmi video [last unloaded: netconsole]
[ 825.381678] CR2: 00000000000000a0
[ 825.383521] ---[ end trace abf830f537070711 ]---
[ 825.500205] RIP: 0010:io_prep_async_work+0x1f6/0x2f0
[ 825.502086] Code: 01 00 48 c7 87 c0 00 00 00 00 00 00 00 48 c7 87 b8 00 00 00 00 00 00 00 48 c7 87 c8 00 00 00 00 00 00 00 48 83 c1 58 89 47 58 <48> 8b 51 48 48 89 97 c0 00 00 00 48 39 ca 0f 84 28 fe ff ff 48 8d
[ 825.503990] RSP: 0018:fffface9401a0ce0 EFLAGS: 00010002
[ 825.505906] RAX: 0000000000011000 RBX: 0000000000000001 RCX: 0000000000000058
[ 825.507824] RDX: ffff91bc8e6418c0 RSI: ffff91bc8d0d2d00 RDI: ffff91bc8903ec00
[ 825.509750] RBP: fffface9401a0d00 R08: fffface9401a0c50 R09: 0000000000000010
[ 825.511682] R10: 0000000000100000 R11: 000000007ffff000 R12: ffff91bc8903ec00
[ 825.513613] R13: ffff91bc93904400 R14: 0000000000000001 R15: ffff91bc8903fc18
[ 825.515536] FS: 00007f3b14f1b700(0000) GS:ffff91cbafcc0000(0000) knlGS:0000000000000000
[ 825.517462] CS: 0010 DS: 0000 ES: 0000 CR0: 0000000080050033
[ 825.519389] CR2: 00000000000000a0 CR3: 0000000480d5a006 CR4: 00000000003726e0
[ 825.521406] DR0: 0000000000000000 DR1: 0000000000000000 DR2: 0000000000000000
[ 825.523355] DR3: 0000000000000000 DR6: 00000000fffe0ff0 DR7: 0000000000000400
[ 825.525297] Kernel panic - not syncing: Fatal exception in interrupt
[ 825.527249] Kernel Offset: 0x17600000 from 0xffffffff81000000 (relocation range: 0xffffffff80000000-0xffffffffbfffffff)
[ 825.639843] ---[ end Kernel panic - not syncing: Fatal exception in interrupt ]---

Seems to be in relation to io_prep_async_work
 
Last edited:
Since it seems to coincide with IO load, could you try disabling io_uring? With "cache=writeback" that is already the case, so it would seem to be a candidate. That also would be something that clearly changed in PVE 7.0.

To test, edit your VM config in /etc/pve/qemu-server/<vmid>.conf and add ,aio=native to the end of your disks (i.e. scsi0, sata0, etc...). You can verify by making sure qm showcmd 100 --pretty | grep io_uring doesn't show anything.
I can confirm this has resolved my issues I've been experiencing with kernel panics after upgrading to version 7. Running 3 VMs on an old Intel i7 and was experiencing 1-3 crashes per day.
 
So does this io_uring have higher standards for more consistent memory etc? where as prior to this you could get by with lesser hardware?

Do I just 'hope' my hardware will work if I use this new feature? Do I upgrade to 7...hope it wont crash if it crashes then disable io_uring?

This is obviously a linux kernel thing and not a proxmox issue that would affect all future hardware.
 
@t.lamprecht I'm on Intel as well and I'm successful in reproducing the panic with fio i/o test tool running on a vm, it crashes every time i run it with a high load, but the kernel panic doesn't print anything, it cuts of and the last line just shows a bunch of ^@^@^@.
I tried capturing a kernel panic with kdump-tools but I get the following when it tries to make a dump prox kdump-tools[787]: The kernel version is not supported., guess the tool doesn't like kernel 5.11

Edit: Using netconsole, I managed to capture a panic:

$ nc -l -p 5555 -u | sudo tee /var/log/netconsole/crash.log
[ 825.247549] BUG: kernel NULL pointer dereference, address: 00000000000000a0
[ 825.251136] #PF: supervisor read access in kernel mode
[ 825.254964] #PF: error_code(0x0000) - not-present page
[ 825.258899] PGD 0 P4D 0
[ 825.262724] Oops: 0000 [#1] SMP PTI
[ 825.266622] CPU: 3 PID: 2330 Comm: kvm Tainted: P O 5.11.22-1-pve #1
[ 825.270278] Hardware name: To Be Filled By O.E.M. To Be Filled By O.E.M./Z270M Extreme4, BIOS P2.30 01/18/2018
[ 825.274003] RIP: 0010:io_prep_async_work+0x1f6/0x2f0
[ 825.276899] Code: 01 00 48 c7 87 c0 00 00 00 00 00 00 00 48 c7 87 b8 00 00 00 00 00 00 00 48 c7 87 c8 00 00 00 00 00 00 00 48 83 c1 58 89 47 58 <48> 8b 51 48 48 89 97 c0 00 00 00 48 39 ca 0f 84 28 fe ff ff 48 8d
[ 825.279667] RSP: 0018:fffface9401a0ce0 EFLAGS: 00010002
[ 825.282221] RAX: 0000000000011000 RBX: 0000000000000001 RCX: 0000000000000058
[ 825.284568] RDX: ffff91bc8e6418c0 RSI: ffff91bc8d0d2d00 RDI: ffff91bc8903ec00
[ 825.286764] RBP: fffface9401a0d00 R08: fffface9401a0c50 R09: 0000000000000010
[ 825.288917] R10: 0000000000100000 R11: 000000007ffff000 R12: ffff91bc8903ec00
[ 825.290839] R13: ffff91bc93904400 R14: 0000000000000001 R15: ffff91bc8903fc18
[ 825.292792] FS: 00007f3b14f1b700(0000) GS:ffff91cbafcc0000(0000) knlGS:0000000000000000
[ 825.294644] CS: 0010 DS: 0000 ES: 0000 CR0: 0000000080050033
[ 825.296432] CR2: 00000000000000a0 CR3: 0000000480d5a006 CR4: 00000000003726e0
[ 825.298230] DR0: 0000000000000000 DR1: 0000000000000000 DR2: 0000000000000000
[ 825.299919] DR3: 0000000000000000 DR6: 00000000fffe0ff0 DR7: 0000000000000400
[ 825.301579] Call Trace:
[ 825.303233] <IRQ>
[ 825.304700] io_rw_reissue+0xb1/0xf0
[ 825.306131] io_complete_rw+0x18/0x40
[ 825.307574] blkdev_bio_end_io+0x80/0x100
[ 825.309008] bio_endio+0xe0/0x130
[ 825.310454] dec_pending+0x154/0x250
[ 825.311922] clone_endio+0x9c/0x220
[ 825.313376] bio_endio+0xe0/0x130
[ 825.314816] blk_update_request+0x227/0x390
[ 825.316268] blk_mq_end_request+0x21/0x140
[ 825.317716] nvme_complete_rq+0x7e/0x220
[ 825.319159] nvme_pci_complete_rq+0x58/0xe0
[ 825.320616] nvme_process_cq+0x15f/0x200
[ 825.322055] nvme_irq+0x14/0x30
[ 825.323495] __handle_irq_event_percpu+0x45/0x170
[ 825.324953] handle_irq_event+0x59/0xc0
[ 825.326393] handle_edge_irq+0x8c/0x220
[ 825.327845] asm_call_irq_on_stack+0x12/0x20
[ 825.329273] </IRQ>
[ 825.330734] common_interrupt+0xbe/0x140
[ 825.332158] ? vmx_set_hv_timer+0x36/0x100 [kvm_intel]
[ 825.333576] asm_common_interrupt+0x1e/0x40
[ 825.334999] RIP: 0010:vmx_do_interrupt_nmi_irqoff+0x13/0x20 [kvm_intel]
[ 825.336427] Code: 5a 41 59 41 58 5e 5f 5a 59 58 5d c3 66 66 2e 0f 1f 84 00 00 00 00 00 55 48 89 e5 48 83 e4 f0 6a 18 55 9c 6a 10 e8 62 62 19 d8 <48> 89 ec 5d c3 0f 1f 84 00 00 00 00 00 0f 1f 44 00 00 55 49 89 f8
[ 825.337899] RSP: 0018:fffface94ff43d80 EFLAGS: 00000082
[ 825.339386] RAX: 0000000000000180 RBX: ffff91c0198c0000 RCX: 00000000621654df
[ 825.340884] RDX: ffffffff00000000 RSI: fffa956d624d8f18 RDI: ffffffff99400180
[ 825.342420] RBP: fffface94ff43d80 R08: 0000000000000000 R09: 0000000000000000
[ 825.343925] R10: 0000000000000000 R11: 0000000000000000 R12: 0000000080000022
[ 825.345436] R13: 0000000000000000 R14: fffface94fe86378 R15: ffff91c0198c0ea8
[ 825.346948] ? irq_entries_start+0x10/0x660
[ 825.348443] vmx_handle_exit_irqoff+0x14f/0x260 [kvm_intel]
[ 825.349954] kvm_arch_vcpu_ioctl_run+0xb8a/0x1800 [kvm]
[ 825.351481] ? do_futex+0x7c4/0xb90
[ 825.352978] ? kvm_vm_ioctl+0x4c9/0xed0 [kvm]
[ 825.354494] kvm_vcpu_ioctl+0x247/0x5f0 [kvm]
[ 825.356021] ? kvm_on_user_return+0x68/0xa0 [kvm]
[ 825.357532] __x64_sys_ioctl+0x91/0xc0
[ 825.359022] do_syscall_64+0x38/0x90
[ 825.360525] entry_SYSCALL_64_after_hwframe+0x44/0xa9
[ 825.362028] RIP: 0033:0x7f3b1ff7dcc7
[ 825.363533] Code: 00 00 00 48 8b 05 c9 91 0c 00 64 c7 00 26 00 00 00 48 c7 c0 ff ff ff ff c3 66 2e 0f 1f 84 00 00 00 00 00 b8 10 00 00 00 0f 05 <48> 3d 01 f0 ff ff 73 01 c3 48 8b 0d 99 91 0c 00 f7 d8 64 89 01 48
[ 825.365093] RSP: 002b:00007f3b14f16408 EFLAGS: 00000246 ORIG_RAX: 0000000000000010
[ 825.366667] RAX: ffffffffffffffda RBX: 000000000000ae80 RCX: 00007f3b1ff7dcc7
[ 825.368241] RDX: 0000000000000000 RSI: 000000000000ae80 RDI: 0000000000000018
[ 825.369810] RBP: 0000563955161650 R08: 000056395444c4a8 R09: 000000000000ffff
[ 825.371380] R10: 0000000000000001 R11: 0000000000000246 R12: 0000000000000000
[ 825.372992] R13: 000056395489de00 R14: 0000000000000002 R15: 0000000000000000
[ 825.374580] Modules linked in: netconsole md4 cmac nls_utf8 cifs libarc4 fscache libdes vfio_pci vfio_virqfd veth ebtable_filter ebtables ip_set ip6table_raw iptable_raw ip6table_filter ip6_tables iptable_filter bpfilter softdog nfnetlink_log nfnetlink intel_rapl_msr intel_rapl_common x86_pkg_temp_thermal intel_powerclamp coretemp kvm_intel crct10dif_pclmul ghash_clmulni_intel aesni_intel crypto_simd mei_hdcp cryptd huawei_cdc_ncm glue_helper cdc_wdm rapl option cdc_ncm intel_cstate cdc_ether usb_wwan pcspkr intel_wmi_thunderbolt efi_pstore mxm_wmi mei_me usbnet ee1004 mii usbserial cdc_acm mei acpi_pad mac_hid zfs(PO) zunicode(PO) zzstd(O) zlua(O) zavl(PO) icp(PO) zcommon(PO) znvpair(PO) spl(O) vhost_net vhost vhost_iotlb tap ib_iser rdma_cm iw_cm ib_cm ib_core iscsi_tcp libiscsi_tcp libiscsi scsi_transport_iscsi nct6775 hwmon_vid sunrpc ip_tables x_tables autofs4 btrfs blake2b_generic xor raid6_pq libcrc32c kvmgt i915 i2c_algo_bit drm_kms_helper syscopyarea sysfillrect sysimgblt
[ 825.374623] fb_sys_fops cec rc_core drm vfio_mdev mdev kvm irqbypass vfio_iommu_type1 vfio hid_generic usbhid hid uas usb_storage i2c_i801 xhci_pci xhci_pci_renesas mpt3sas e1000e ahci raid_class crc32_pclmul i2c_smbus libahci scsi_transport_sas xhci_hcd wmi video [last unloaded: netconsole]
[ 825.381678] CR2: 00000000000000a0
[ 825.383521] ---[ end trace abf830f537070711 ]---
[ 825.500205] RIP: 0010:io_prep_async_work+0x1f6/0x2f0
[ 825.502086] Code: 01 00 48 c7 87 c0 00 00 00 00 00 00 00 48 c7 87 b8 00 00 00 00 00 00 00 48 c7 87 c8 00 00 00 00 00 00 00 48 83 c1 58 89 47 58 <48> 8b 51 48 48 89 97 c0 00 00 00 48 39 ca 0f 84 28 fe ff ff 48 8d
[ 825.503990] RSP: 0018:fffface9401a0ce0 EFLAGS: 00010002
[ 825.505906] RAX: 0000000000011000 RBX: 0000000000000001 RCX: 0000000000000058
[ 825.507824] RDX: ffff91bc8e6418c0 RSI: ffff91bc8d0d2d00 RDI: ffff91bc8903ec00
[ 825.509750] RBP: fffface9401a0d00 R08: fffface9401a0c50 R09: 0000000000000010
[ 825.511682] R10: 0000000000100000 R11: 000000007ffff000 R12: ffff91bc8903ec00
[ 825.513613] R13: ffff91bc93904400 R14: 0000000000000001 R15: ffff91bc8903fc18
[ 825.515536] FS: 00007f3b14f1b700(0000) GS:ffff91cbafcc0000(0000) knlGS:0000000000000000
[ 825.517462] CS: 0010 DS: 0000 ES: 0000 CR0: 0000000080050033
[ 825.519389] CR2: 00000000000000a0 CR3: 0000000480d5a006 CR4: 00000000003726e0
[ 825.521406] DR0: 0000000000000000 DR1: 0000000000000000 DR2: 0000000000000000
[ 825.523355] DR3: 0000000000000000 DR6: 00000000fffe0ff0 DR7: 0000000000000400
[ 825.525297] Kernel panic - not syncing: Fatal exception in interrupt
[ 825.527249] Kernel Offset: 0x17600000 from 0xffffffff81000000 (relocation range: 0xffffffff80000000-0xffffffffbfffffff)
[ 825.639843] ---[ end Kernel panic - not syncing: Fatal exception in interrupt ]---

Seems to be in relation to io_prep_async_work
Hello,

can you give a short manual how you dump the kernel panic with netconsole?

I think we have the same problem on a Intel S5520UR and Intel Xeon E5620 with a MegaRAID SAS 2108, but I can't see the panic, the screen are frozen. With fio I can't reproduce this, but when I start a GC job in the PBS (2.0) then the system freeze after exactly 20 minutes.

Thanks

Edit: I also found the ^@^@^@^@^@^@^@^@^@^@^@^@^@^@^@^ in my syslog...
 
Last edited:
Hello,

can you give a short manual how you dump the kernel panic with netconsole?

I think we have the same problem on a Intel S5520UR and Intel Xeon E5620 with a MegaRAID SAS 2108, but I can't see the panic, the screen are frozen. With fio I can't reproduce this, but when I start a GC job in the PBS (2.0) then the system freeze after exactly 20 minutes.

Thanks

Edit: I also found the ^@^@^@^@^@^@^@^@^@^@^@^@^@^@^@^ in my syslog...
Hi, I followed this guide https://pve.proxmox.com/wiki/Kernel_Crash_Trace_Log
 
  • Like
Reactions: MarvinE
Since it seems to coincide with IO load, could you try disabling io_uring? With "cache=writeback" that is already the case, so it would seem to be a candidate. That also would be something that clearly changed in PVE 7.0.

To test, edit your VM config in /etc/pve/qemu-server/<vmid>.conf and add ,aio=native to the end of your disks (i.e. scsi0, sata0, etc...). You can verify by making sure qm showcmd 100 --pretty | grep io_uring doesn't show anything.
Thanks, it seams to fix it. Unfortunately, I was unable to create a kernel panic dump, because I use some nic bonding.
 
In the syslog we have segfaults in core libraries, general protection faults (access of memory addresses outside allowed virtual memory regions) and failure to handle a page fault.

So IMO it's either one of:
* bad HW (e.g. memory) - sometimes that can also be triggered (more often) by a different kernel version
* something causing havoc in kernel space, highly probably specific to some of the HW here in this thread

As we see quite some AMD 3xxx involved here it'd be good if you could ensure that the latest BIOS updates are installed, or to install the amd64-microcode package from the non-free Debian Repository component.

Hi - Just an update that since turning on write back cache this has been running without crashing. However I only did this against a single VM which used lots of IO, but I did not apply the same to another VM which does not do much io. All fine.

My spec if this is helpful is (and I built this specifically for proxmox, so all new components):
AMD Ryzen 5600x
64g mem - Corsair Vengeance 3600
Asrock b550 Taichi motherboard
Seasonic 850 psu
Intel i350 4-port PCI NIC
Samsung 870 ssd for boot
Samsung 860 ssd to hold ISOs
Multiple Exos 16tb disks for VMs / Containers
 
  • Like
Reactions: boopzz
Hi - Just an update that since turning on write back cache this has been running without crashing. However I only did this against a single VM which used lots of IO, but I did not apply the same to another VM which does not do much io. All fine.
Thanks for the info, a colleague of mine managed to reproduce something that would look like it could be the issue reported here, it is a bit flaky and can only be triggered in combination with VMs backed by LVM, using the new io_uring and having some seemingly special IO load (meaning, the same setup works mostly fine in one VM and breaks relatively often in another).

Setting the cache to write-back disables the use of io_uring, so that takes one component out of the equation. But it does not necesarrily have to mean that io_uring is the actual one having a bug here, could be well in LVM or kernel BIO code paths that just gets exposed with higher probability when io_uring is in use (e.g., as that has quite less overhead).
 
  • Like
Reactions: boopzz
Thanks for the info, a colleague of mine managed to reproduce something that would look like it could be the issue reported here, it is a bit flaky and can only be triggered in combination with VMs backed by LVM, using the new io_uring and having some seemingly special IO load (meaning, the same setup works mostly fine in one VM and breaks relatively often in another).

Setting the cache to write-back disables the use of io_uring, so that takes one component out of the equation. But it does not necesarrily have to mean that io_uring is the actual one having a bug here, could be well in LVM or kernel BIO code paths that just gets exposed with higher probability when io_uring is in use (e.g., as that has quite less overhead).
I think I am experiencing the same issue on my PVE. I have disabled io_uring on all VMs, let's see what happens. I was having this same problem on Proxmox 6.4 as well
 
I was having this same problem on Proxmox 6.4 as well
That sounds odd, at least for io_uring being involved in the cause of the issue, as io_uring is not available nor enabled in any form on Proxmox VE 6.4 at all...
 
That sounds odd, at least for io_uring being involved in the cause of the issue, as io_uring is not available nor enabled in any form on Proxmox VE 6.4 at all...
Well, I don't know if io_uring was involved in the issue, but I was getting random crashes as well. Unfortunately, I can no longer verify if it was due to the same problem.
Do you think I should update amd64_microcode considering that on Debian Bullseye it is still under testing?
 
Well, I don't know if io_uring was involved in the issue, but I was getting random crashes as well. Unfortunately, I can no longer verify if it was due to the same problem.
Do you think I should update amd64_microcode considering that on Debian Bullseye it is still under testing?
Yes, Bullseye is in hard freeze since March, Debian is very conservative here and the microcode comes directly from AMD as binary blob any way.
 
  • Like
Reactions: leofabri
Yes, Bullseye is in hard freeze since March, Debian is very conservative here and the microcode comes directly from AMD as binary blob any way.
I may try it anyway.

One more thing:
adding aio=native causes this problem:

kvm: -drive file=/dev/zvol/rpool/data/vm-216-disk-0,if=none,id=drive-scsi0,cache=writeback,aio=native,format=raw,detect-zeroes=on: aio=native was specified, but it requires cache.direct=on, which was not specified.

Although, if I enable cache.direct=on the VM will no longer load or go past the bios screen (it bootloops)
 
Update: so far so good guys. My server is still running after 2+ days with the latest amd64_microcode enabled (this needed the non-free repo enabled). I don't know if this was the same issue you guys had (it looks like so), but my machine seems quite stable at the moment
 
I may try it anyway.

One more thing:
adding aio=native causes this problem:

kvm: -drive file=/dev/zvol/rpool/data/vm-216-disk-0,if=none,id=drive-scsi0,cache=writeback,aio=native,format=raw,detect-zeroes=on: aio=native was specified, but it requires cache.direct=on, which was not specified.

Although, if I enable cache.direct=on the VM will no longer load or go past the bios screen (it bootloops)

If you have cache=writeback you should not have to add aio=native as far as I understood the previous comments as writeback implicitly sets this (or something very similar at least).

Update: so far so good guys. My server is still running after 2+ days with the latest amd64_microcode enabled (this needed the non-free repo enabled). I don't know if this was the same issue you guys had (it looks like so), but my machine seems quite stable at the moment

Was that in addition to the aio changes or did you just apply the microcodes now? I ran into this on Intel machines, installed the intel microcodes as well as disabled io_uring and to be 100% sure disabled the I/O task (backups) that was the most likely cause. So far also stable…
 
I also have kernel panic every 3-4 hours and everything worked fine on PVE 6.4

I have tried :
- no-cache (without aio=native),
- write-back.
- Update of intel-microcode
- BIOS update

I am currently trying with no-cache + ,aio=native.

Workstation config :
Motherboard : GA-H97M-D3H (last BIOS update F8b)
Processor : Intel i 4590
RAM : DDR3 32 Go

VM 100.conf
audio0: device=ich9-intel-hda,driver=spice
boot: order=ide0
cores: 2
ide0: local-lvm:vm-100-disk-0,aio=native,size=45G
ide2: none,media=cdrom
memory: 2048
name: BOT-3DS
net0: e1000=4E:03:DB:66:7C:7D,bridge=vmbr0,firewall=1
numa: 0
onboot: 1
ostype: win10
scsihw: virtio-scsi-pci
smbios1: uuid=bf2eabcf-592b-49fc-86b8-9668f3e6e81c
sockets: 1
vcpus: 2
vga: vmware
vmgenid: 139d4fcf-9287-41b6-92ed-7db46fea29f2

VM 101.conf
boot: order=scsi0;ide2;net0
cores: 1
ide2: none,media=cdrom
memory: 1024
name: Serveur-ReverseProxy
net0: virtio=1A:71:BF:00:B5:7C,bridge=vmbr0,firewall=1
numa: 0
onboot: 1
ostype: l26
scsi0: local-lvm:vm-101-disk-0,aio=native,size=10G
scsihw: virtio-scsi-pci
smbios1: uuid=2f4e29cf-c8d6-4f42-8c1a-b3ac02dec628
sockets: 1
startup: order=1
vmgenid: 638e2867-c5b3-4af9-92dd-d55d6582efcc

VM 102.conf
boot: order=scsi0;ide2;net0
cores: 4
ide2: none,media=cdrom
memory: 10240
name: Serveur-NAS
net0: virtio=6A:3D:DD:88:74:58,bridge=vmbr0,firewall=1
numa: 0
onboot: 1
ostype: l26
scsi0: local-lvm:vm-102-disk-0,aio=native,size=35G
scsi1: /dev/disk/by-id/ata-ST2000VN004-2E4164_Z52B3QD6,aio=native,size=1953514584K
scsi2: /dev/disk/by-id/ata-ST2000VN004-2E4164_Z52B3MM5,aio=native,size=1953514584K
scsihw: virtio-scsi-pci
smbios1: uuid=1299d9f3-0725-4d0f-93db-977bb5850236
sockets: 1
vmgenid: a840da22-b145-4e2b-80c1-2b1751804ca4

VM 104.conf
boot: order=scsi0;ide2;net0
cores: 4
ide2: none,media=cdrom
memory: 4096
name: Serveur-Web
net0: virtio=06:80:E7:8B:E0:0C,bridge=vmbr0,firewall=1
numa: 0
onboot: 1
ostype: l26
scsi0: local-lvm:vm-104-disk-0,aio=native,size=50G
scsihw: virtio-scsi-pci
smbios1: uuid=764272b8-3688-4801-9aa5-97fbbcab5366
sockets: 1
startup: order=3
vmgenid: 3a401a58-6ac2-4379-9535-aee127736aac

VM 105.conf
boot: order=scsi0;ide2;net0
cores: 1
ide2: none,media=cdrom
memory: 1024
name: Serveur-OpenVPN
net0: virtio=BA:71:3E:BB:21:EE,bridge=vmbr0,firewall=1
numa: 0
onboot: 1
ostype: l26
scsi0: local-lvm:vm-105-disk-0,aio=native,size=10G
scsihw: virtio-scsi-pci
smbios1: uuid=c2f0b481-830e-4e9e-b3af-8364f9b7b7ce
sockets: 1
startup: order=3
vmgenid: d8b59725-d5cf-4625-8aaf-be86e264cc2a

VM 106.conf
boot: order=scsi0;ide2;net0
cores: 1
cpu: host
ide2: none,media=cdrom
memory: 6144
name: Serveur-OSRM
net0: virtio=D2:71:C9:04:01:19,bridge=vmbr0,firewall=1
numa: 0
onboot: 1
ostype: l26
scsi0: StockageHDD:vm-106-disk-0,aio=native,size=100G
scsihw: virtio-scsi-pci
smbios1: uuid=6244e31b-c617-49a4-b956-aa05b0b48c8f
sockets: 1
vmgenid: 080330a8-ad2e-4cb3-82d4-4f5df3713e28

VM 107.conf
audio0: device=ich9-intel-hda,driver=spice
bootdisk: ide0
cores: 4
cpu: host
ide0: local-lvm:vm-107-disk-0,aio=native,size=35G
ide2: none,media=cdrom
memory: 4096
name: BOT-SWITCH
net0: e1000=0E:C5:E5:B2:8F:68,bridge=vmbr0
numa: 0
onboot: 1
ostype: win10
scsihw: virtio-scsi-pci
smbios1: uuid=dabf7ee0-6a79-498e-9e3e-829a8333f739
sockets: 1
usb0: host=0fd9:005c,usb3=1
usb1: host=2508:0032,usb3=1
vmgenid: 86213220-2072-48d9-a2eb-90a4d5222598

LXC 108.conf
arch: amd64
cores: 2
hostname: Serveur-MySQL
memory: 8192
net0: name=eth0,bridge=vmbr0,hwaddr=8E:2A:D2:4D:2E:86,ip=dhcp,ip6=dhcp,type=veth
onboot: 1
ostype: ubuntu
rootfs: local-lvm:vm-108-disk-0,size=20G
startup: order=2
swap: 2048
unprivileged: 1

up.jpg
 
Last edited:
We're also having trouble with "AMD Ryzen 9 5950X" CPUs and PVE7 / 5.11 Kernel (completely new PVE7 cluster). Random reboots out of the blue which seem to be connected to specific VMs. But those VMs seem to run just fine on other nodes with exactly the same hardware.
There seems still much going on with PVE7 since there are new updates nearly every day. So is it stable enough for production already? (Using enterprise repos here).
 
Code:
qemu-server (7.0-11) bullseye; urgency=medium

  * nic: support the intel e1000e model

  * lvm: avoid the use of io_uring for now

  * live-restore: fail early if target storage doesn't exist

  * api: always add new CD drives to bootorder

  * fix #2563: allow live migration with local cloud-init disk

 -- Proxmox Support Team <support@proxmox.com>  Fri, 23 Jul 2021 11:08:48 +0200

A new qemu server release seems to disable io_uring for lvm completely. That said I am also seeing this on ZFS etc… So not sure if this change is directly related to this issue.
 
There seems still much going on with PVE7 since there are new updates nearly every day.
PVE 6 also gets update almost every day, that's not a criterion against stability but rather for the fact that issues are actively worked on and also addressed fast. All OS are riddled by such issues occasionally, not ideal but with the amount of different HW and software configurations it's just a given.

So is it stable enough for production already?
PVE 7.0 is supported by the enterprise support agreement and seen as production ready, we have quite some production workload on that version since over a month.

A new qemu server release seems to disable io_uring for lvm completely. That said I am also seeing this on ZFS etc… So not sure if this change is directly related to this issue.
That's a stop-gap-measurement, we're working actively with upstream io_uring kernel devs to close down on the "real issue" behind this odd behavior. We could only see it LVM here, but it's general quite spurious (e.g., one VM breaks another not, same host, same config) to reproduce, that's why it slipped through in the first place.
 

About

The Proxmox community has been around for many years and offers help and support for Proxmox VE, Proxmox Backup Server, and Proxmox Mail Gateway.
We think our community is one of the best thanks to people like you!

Get your subscription!

The Proxmox team works very hard to make sure you are running the best software and getting stable updates and security enhancements, as well as quick enterprise support. Tens of thousands of happy customers have a Proxmox subscription. Get yours easily in our online shop.

Buy now!