Incorrect work of the rate limiter

Andrii.B

Well-Known Member
Oct 10, 2019
58
3
48
42
I have detected that network rate limit work wrong using HTTP request.

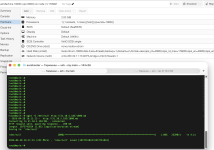
This is a speed without rate limit:
Screenshot 2026-04-20 at 4.11.25 PM.png

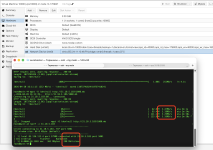
And here you can see a very slow speed using http, but normal speed when test using iperf:
Screenshot 2026-04-20 at 4.12.30 PM.png

I reproduced this bug on all nodes with the last proxmox.
pveversion
pve-manager/9.1.7/16b139a017452f16 (running kernel: 6.17.13-2-pve)
 
Hi,

The real bug is the opposite of what you think. iperf is bypassing the rate limit, not HTTP being too slow. The rate=37.5 in Proxmox translates to ~4.7 MB/s, and wget is showing something in that ballpark. iperf should be capped at ~37.5 Mbps but is hitting 298 Mbps.

Proxmox's rate= parameter applies traffic shaping via tc on the tap interface egress (outbound from host to VM). iperf in default mode measures the reverse direction — traffic flows from your external machine into the VM, which is ingress on the tap interface and is not shaped.
Verify this:

# Test outbound from VM instead:
iperf -c <external_host> # run FROM the VM
# or use reverse mode:
iperf3 -c 31.10.5.183 -R # server sends to client
 
The rate is in MB/s, not in Mb/s.

See e.g. the image https://pve.proxmox.com/pve-docs/images/screenshot/gui-create-vm-network.png
which is included in
https://pve.proxmox.com/pve-docs/chapter-qm.html#qm_network_device

Also in https://pve.proxmox.com/pve-docs/qm.1.html we read:

"rate=<number> (0 - N)
Rate limit in mbps (megabytes per second) as floating point number."

BTW, the abbreviation of the physical unit in this doc is grossly wrong, as mbps literally means milli (sic!) bits per second, not mega bytes per second.
As "m" means 10^-3, not 10^6.
See e.g. https://en.wikipedia.org/wiki/Metric_prefix

So:
37.5 MB/s * 8 bits/byte = 300 Mb/s which is quite the same result as the OP shown (298 Mb/s).
 
I got similar speeds with curl and scp:

Code:
$ curl http://devel:8888/big > /dev/null
  % Total    % Received % Xferd  Average Speed   Time    Time     Time  Current
                                 Dload  Upload   Total   Spent    Left  Speed
100  100M  100  100M    0     0  5805k      0  0:00:17  0:00:17 --:--:-- 5834k

except when I randomly added --trace-ascii it somehow got faster:

Code:
$ curl --trace-ascii foo http://devel:8888/big > /dev/null
  % Total    % Received % Xferd  Average Speed   Time    Time     Time  Current
                                 Dload  Upload   Total   Spent    Left  Speed
100  100M  100  100M    0     0  24.6M      0  0:00:04  0:00:04 --:--:-- 24.6M

I suspect this is just some unfortunate interaction between the rate limit and TCP. The first one had a lot more retransmissions and partial acknowledgements of segments.
 
Hi everyone,

I'm running a infrastructure with Proxmox VE 9 and have noticed significant TCP performance issues when using the built-in VM bandwidth limiter (rate).

The problem becomes more noticeable as RTT increases (10–15 ms, and especially 20–25 ms). With low latency, performance is generally much better.

Test setup:
  • Proxmox VE 9, Linux Bridge, VirtIO, firewall enabled
  • VM bandwidth limit: rate=80 (80 MiB/s / ~671 Mbit/s)
  • AlmaLinux VM with default TCP CUBIC
  • Large static file downloads over HTTP/HTTPS
My test results:

ConfigurationSingle TCP downloadTwo parallel TCP downloads
Proxmox Police/Drop + CUBIC (in vm)~66–67 MB/s~76 MB/s total, unstable and uneven sharing
Proxmox Police/Drop + BBR (in vm)~76 MB/s~76 MB/s total, ~ stable 38 + 38 MB/s
Proxmox Police HTB + FQ-CoDel + CUBIC (in vm)~76 MB/s~76 MB/s total, stable 38 + 38 MB/s

With the standard Proxmox policer, a single TCP connection cannot reach the same throughput as two parallel connections. With two downloads, the total throughput improves, but bandwidth sharing is unstable and one connection can dominate the other.

With HTB + FQ-CoDel, both single and parallel TCP downloads perform very well, with stable and fair bandwidth distribution.

TCP retransmission statistics:
  • Police/Drop + BBR: 2,149 policer drops during 30 seconds, approximately 138 MB retransmitted (5.51%).
  • HTB + FQ-CoDel + CUBIC: approximately 0.016% TCP retransmitted bytes, with only 7 FQ-CoDel drops during a separate 45-second measurement.
These measurements were collected during separate test runs, but the performance differences have been consistent.

Replacing the standard Proxmox ingress policer with HTB + FQ-CoDel (same bandwidth limit) significantly improved throughput stability, TCP fairness and retransmission rates.

For hosting providers serving users with different RTTs and connection speeds, this seems particularly important.

Is there currently a simple and officially supported way to switch from the default Police/Drop mechanism to HTB + FQ-CoDel in Proxmox, without having to maintain custom scripts or make complex changes to the networking configuration?

If not, would it be possible to offer HTB + FQ-CoDel as an optional shaping mode directly in the VM network settings?

This would be particularly useful for hosting providers, allowing better TCP performance and fairer bandwidth sharing without modifying the congestion control algorithm inside customer VMs or maintaining custom tc configurations.

Thanks to the Proxmox team for their great work!