High RAM usage in Proxmox 4.4

eth

Well-Known Member
Feb 24, 2016
68
3
48
37
I have 32 gb of memory which I shared in two CT's:
1. 2gb of RAM - Centos 6 for haproxy and nginx.
2. 29 gb of RAM - Centos 7 for Percona Cluster database.

I've noticed high swapping on 29 gb VM in decided to stop it. And then I completely removed it from the system.

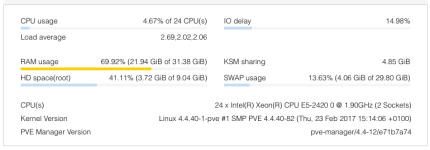
When I SSH'ed into the Proxmox host, it showed me that 12 GB of RAM are still used somewhere.

Code:
root@pve:~# free -mh
             total       used       free     shared    buffers     cached
Mem:           31G        12G        18G        91M        36M       421M
-/+ buffers/cache:        12G        19G
Swap:         8.0G       842M       7.2G

It's impossible, because the only virtual machine that is left has a 2GB RAM limit, and uses probably only 700 MB of it.

I ran a bash script to count total RAM usage from all processes and it came to 833 Megabytes:
Code:
ps aux | awk '{sum+=$6} END {print sum / 1024}'
833.605

So I'm wondering, where did other 11 Gigabytes go to? Is there a leak?
 
Last edited:
No, I don't use ZFS. I've attached my ps.
 

Attachments

  • ps.txt
    32.5 KB · Views: 8
Dropping caches didn't help.

Code:
root@pve:~# echo 1 > /proc/sys/vm/drop_caches
root@pve:~# free -mh
             total       used       free     shared    buffers     cached
Mem:           31G        12G        19G        91M       828K       158M
-/+ buffers/cache:        12G        19G
Swap:         8.0G       834M       7.2G
root@pve:~# echo 2 > /proc/sys/vm/drop_caches
root@pve:~# free -mh
             total       used       free     shared    buffers     cached
Mem:           31G        12G        19G        91M       1.3M       154M
-/+ buffers/cache:        11G        19G
Swap:         8.0G       834M       7.2G
root@pve:~# echo 3 > /proc/sys/vm/drop_caches
root@pve:~# free -mh
             total       used       free     shared    buffers     cached
Mem:           31G        12G        19G        91M       1.6M       139M
-/+ buffers/cache:        11G        19G
Swap:         8.0G       834M       7.2G
 
df -h doesn't show anything unusual.

Code:
root@pve:~# df -h
Filesystem      Size  Used Avail Use% Mounted on
udev             10M     0   10M   0% /dev
tmpfs           6.3G  8.8M  6.3G   1% /run
/dev/dm-0       583G   41G  518G   8% /
tmpfs            16G   43M   16G   1% /dev/shm
tmpfs           5.0M     0  5.0M   0% /run/lock
tmpfs            16G     0   16G   0% /sys/fs/cgroup
/dev/fuse        30M   20K   30M   1% /etc/pve
 
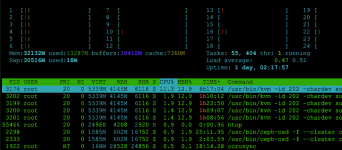
Here is my top:

Code:
root@pve:/run# top -d1
top - 02:15:02 up 3 days, 21:24,  2 users,  load average: 0.24, 0.15, 0.11
Tasks: 378 total,   1 running, 377 sleeping,   0 stopped,   0 zombie
%Cpu(s):  2.1 us,  4.2 sy,  0.0 ni, 92.2 id,  0.9 wa,  0.0 hi,  0.6 si,  0.0 st
KiB Mem:  32946120 total, 13166684 used, 19779436 free,    16008 buffers
KiB Swap:  8388604 total,   834664 used,  7553940 free.   368448 cached Mem

  PID USER      PR  NI    VIRT    RES    SHR S  %CPU %MEM     TIME+ COMMAND
20349 501       20   0  151908  19580  11736 S  16.8  0.1   0:00.17 php
 6573 root      20   0  148060  15088  11420 S   1.0  0.0   0:00.64 php
10922 99        20   0   13100    788    636 S   1.0  0.0   0:45.61 dnsmasq
18747 501       20   0   56052   3328   1824 S   1.0  0.0   0:00.16 nginx
    1 root      20   0   30168   4120   2168 S   0.0  0.0   0:09.49 systemd
    2 root      20   0       0      0      0 S   0.0  0.0   0:00.25 kthreadd
    3 root      20   0       0      0      0 S   0.0  0.0   1:25.46 ksoftirqd/0
    5 root       0 -20       0      0      0 S   0.0  0.0   0:00.00 kworker/0:0H
    7 root      20   0       0      0      0 S   0.0  0.0   9:13.22 rcu_sched
    8 root      20   0       0      0      0 S   0.0  0.0   0:00.00 rcu_bh
    9 root      rt   0       0      0      0 S   0.0  0.0   0:05.41 migration/0
   10 root      rt   0       0      0      0 S   0.0  0.0   0:00.48 watchdog/0
   11 root      rt   0       0      0      0 S   0.0  0.0   0:00.50 watchdog/1
   12 root      rt   0       0      0      0 S   0.0  0.0   0:05.43 migration/1
   13 root      20   0       0      0      0 S   0.0  0.0   1:24.74 ksoftirqd/1
   15 root       0 -20       0      0      0 S   0.0  0.0   0:00.00 kworker/1:0H
   16 root      rt   0       0      0      0 S   0.0  0.0   0:00.46 watchdog/2
   17 root      rt   0       0      0      0 S   0.0  0.0   0:05.41 migration/2
   18 root      20   0       0      0      0 S   0.0  0.0   1:19.72 ksoftirqd/2
   20 root       0 -20       0      0      0 S   0.0  0.0   0:00.00 kworker/2:0H
   21 root      rt   0       0      0      0 S   0.0  0.0   0:00.42 watchdog/3
   22 root      rt   0       0      0      0 S   0.0  0.0   0:05.45 migration/3
   23 root      20   0       0      0      0 S   0.0  0.0   1:19.33 ksoftirqd/3
   25 root       0 -20       0      0      0 S   0.0  0.0   0:00.00 kworker/3:0H
   26 root      rt   0       0      0      0 S   0.0  0.0   0:00.70 watchdog/4
   27 root      rt   0       0      0      0 S   0.0  0.0   0:05.51 migration/4
   28 root      20   0       0      0      0 S   0.0  0.0   1:31.40 ksoftirqd/4
 
4.4.35-1 (that comes in the latest install package) but I am now doing a dist-upgrade to 4.4.40-1 through the pve-no-subscription repo.
 
Just rebooted into 4.4.40-1 and looks like I'm hitting the same error:

Code:
root@pve:~# free -mh
             total       used       free     shared    buffers     cached
Mem:           31G        30G       896M        52M        93M        16G
-/+ buffers/cache:        13G        17G
Swap:         8.0G       8.2M       8.0G
root@pve:~# ps aux | awk '{sum+=$6} END {print sum / 1024}'
3152.41
 
Not much. Problem still there.

Code:
root@pve:~# free -mh
             total       used       free     shared    buffers     cached
Mem:           31G        31G       228M        52M       114M        17G
-/+ buffers/cache:        14G        17G
Swap:         8.0G        15M       8.0G
root@pve:~# pct shutdown 101
root@pve:~# free -mh
             total       used       free     shared    buffers     cached
Mem:           31G        31G       226M        51M       109M        17G
-/+ buffers/cache:        13G        17G
Swap:         8.0G       120K       8.0G
 
I just wanted to follow up on this.
My problem was that I set the innodb_buffer_pool_size too high in my mysql settings which led to extreme swapping.
You should not worry about high RAM usage - it's normal.
 
the only difference is whether buffer and/or cache pages are counted as "free" or as "used", but all three "views" show the same memory situation.
 
Exactly!

And in the first post everything is fine too. The really used memory (not for buffer/cache) is about 1 GB.
And this confirmed by:
ps aux | awk '{sum+=$6} END {print sum / 1024}'
;)
 

About

The Proxmox community has been around for many years and offers help and support for Proxmox VE, Proxmox Backup Server, and Proxmox Mail Gateway.
We think our community is one of the best thanks to people like you!

Get your subscription!

The Proxmox team works very hard to make sure you are running the best software and getting stable updates and security enhancements, as well as quick enterprise support. Tens of thousands of happy customers have a Proxmox subscription. Get yours easily in our online shop.

Buy now!