Garbage collection speed

flai_hv

New Member
Nov 6, 2022
1
0
1
Hi devs and users,

Personally, I use proxmox in multiple domains (private and semi-professional).
For this reason, I have also two Backup servers running to handle the backups. All servers are doing daily backups, some even more, in total ~5TB with ~200GB changes per week.
One server is running with metadata SSD cached, data HDD ZFS filesystem as a VM. The other is "a bit weird", a cloud instance using remotely mounted storage for financial reasons.
Both of them run really well with a decent speed for backup creation and restore, even the remote storage one.

But one thing came up, the speed of garbage collection.
On the remote storage server, one run of garbage collection takes almost 2 days...
On the local storage server, one run takes 10 hours.

I know why this takes so long. PBS is going through all index files, "touches" all chunks assigned to it and later deletes all untouched chunks. This touching (even if you use features like relatime), involves the operating system and filesystem.
The required calls into the OS scale with amount of data aka chunks of data (or even better amount) and the amount of index files.
That means if you want to keep higher frequency backups, that quickly scales into billion touches per garbage collection cycles.

So, for all the users out there: What is your garbage collection duration? Anybody else out there having an "issue" like that?

But I didn't came here without an idea to change this.
I read (actually inside the code) that there were ideas to make this whole process inside memory. But that comes at a decent risk and memory footprint for large deployments.
The idea I have been trying on a replica of my backup server is deduplication of the touch requests.
There is no benefit of touching a chunk twice within one garbage collect. And the benefit is this calculation happens within PBS, no involvement of the OS. That can make this process magnitudes quicker. Especially for non-enterprise SSD deployments. Even for them, the lookup internal seems to be quicker than the touch, even on the NVME SSD I tried it with.
But that means a list of chunks needs to be kept in memory during garbage collection. In numbers 32MB per 1 million chunks. 1 million chunks means 4TB of VM data with default settings. It makes sense to truncate this data if it reaches a certain limit, what doesn't undermine the basic functionality, just slows it a bit down. But maybe that is fair if you have a single VM referencing 100TB+ on a single VM...

For the devs, what about memory footprint? Proxmox guides mention 1GB RAM per 1TB storage. So magnitudes more.
Do you think that such a solution has a chance?


BR

Florian
 
What is your garbage collection duration? Anybody else out there having an "issue" like that?

Dell gen12 box, mostly ssd with a hdd vdev for capacity.
3 TB of data, 57 Groups, 281 Snapshots

2024-08-25T18:00:42-04:00: starting garbage collection on store
2024-08-25T18:00:42-04:00: Start GC phase1 (mark used chunks)
2024-08-25T18:00:48-04:00: marked 1% (6 of 555 index files)
<snip>
2024-08-25T18:05:15-04:00: processed 99% (2197834 chunks)
2024-08-25T18:05:17-04:00: Removed garbage: 71.507 GiB
2024-08-25T18:05:17-04:00: Removed chunks: 73074
2024-08-25T18:05:17-04:00: Pending removals: 377.241 GiB (in 355233 chunks)
2024-08-25T18:05:17-04:00: Original data usage: 64.99 TiB
2024-08-25T18:05:17-04:00: On-Disk usage: 2.351 TiB (3.62%)
2024-08-25T18:05:17-04:00: On-Disk chunks: 1791641
2024-08-25T18:05:17-04:00: Deduplication factor: 27.65
2024-08-25T18:05:17-04:00: Average chunk size: 1.376 MiB
2024-08-25T18:05:17-04:00: TASK OK

Five minutes.
 
That first one was the primary, baremetal, made to perform.

This might be more fair.
Here's my secondary, runs as a TrueNAS guest virtual machine, so its right on top of the storage.
3 TB, 57 Groups, 299 Snapshots

2024-08-26T02:30:00-04:00: starting garbage collection on store
2024-08-26T02:30:00-04:00: task triggered by schedule '2,22:30'
2024-08-26T02:30:00-04:00: Start GC phase1 (mark used chunks)
2024-08-26T02:30:11-04:00: marked 1% (6 of 555 index files)
<snip>
2024-08-26T03:12:53-04:00: processed 99% (2154742 chunks)
2024-08-26T03:13:12-04:00: Removed garbage: 0 B
2024-08-26T03:13:12-04:00: Removed chunks: 0
2024-08-26T03:13:12-04:00: Pending removals: 384.927 GiB (in 355062 chunks)
2024-08-26T03:13:12-04:00: Original data usage: 64.99 TiB
2024-08-26T03:13:12-04:00: On-Disk usage: 2.393 TiB (3.68%)
2024-08-26T03:13:12-04:00: On-Disk chunks: 1821382
2024-08-26T03:13:12-04:00: Deduplication factor: 27.16
2024-08-26T03:13:12-04:00: Average chunk size: 1.377 MiB
2024-08-26T03:13:12-04:00: TASK OK

43 minutes.

BTW this is a non-typical day. I'm moving data around.
The secondary was just deployed, purging data from primary, shuffling it to secondary.
 
Last edited:
Just another random datapoint: this is a HP MicroServer Gen10, turned on once a week. With rotating rust in a single vdev = 4 drives in Raidz2 = worst case possible. No Special Device involved. Co-installed on PVE in an LXC, using a standard mountpoint for storage.

3.2 TB; 167 Groups, 2842 Snapshots

Code:
2024-08-25T07:06:00+02:00: starting garbage collection on store pbsc
2024-08-25T07:06:00+02:00: task triggered by schedule 'daily'
2024-08-25T07:06:00+02:00: Start GC phase1 (mark used chunks)
2024-08-25T07:07:43+02:00: marked 1% (41 of 4005 index files)
...
2024-08-25T07:36:48+02:00: marked 100% (4005 of 4005 index files)
2024-08-25T07:36:48+02:00: Start GC phase2 (sweep unused chunks)
2024-08-25T07:36:48+02:00: processed 1% (23338 chunks)
...
2024-08-25T07:36:59+02:00: processed 99% (2293891 chunks)
2024-08-25T07:36:59+02:00: Removed garbage: 0 B
2024-08-25T07:36:59+02:00: Removed chunks: 0
2024-08-25T07:36:59+02:00: Original data usage: 74.813 TiB
2024-08-25T07:36:59+02:00: On-Disk usage: 2.738 TiB (3.66%)
2024-08-25T07:36:59+02:00: On-Disk chunks: 2317035
2024-08-25T07:36:59+02:00: Deduplication factor: 27.33
2024-08-25T07:36:59+02:00: Average chunk size: 1.239 MiB
2024-08-25T07:36:59+02:00: TASK OK

30 minutes; I am surprised about zero chunks removed... obviously there was no backup in between...

The week before:
Code:
2024-08-18T09:53:00+02:00: starting garbage collection on store pbsc
2024-08-18T09:53:00+02:00: task triggered by schedule 'daily'
2024-08-18T09:53:00+02:00: Start GC phase1 (mark used chunks)
2024-08-18T09:53:47+02:00: marked 1% (42 of 4150 index files)
...
2024-08-18T10:21:36+02:00: marked 100% (4150 of 4150 index files)
2024-08-18T10:21:36+02:00: Start GC phase2 (sweep unused chunks)
2024-08-18T10:21:49+02:00: processed 1% (23701 chunks)
...
2024-08-18T11:05:09+02:00: processed 99% (2409651 chunks)
2024-08-18T11:05:36+02:00: Removed garbage: 109.197 GiB
2024-08-18T11:05:36+02:00: Removed chunks: 116999
2024-08-18T11:05:36+02:00: Original data usage: 74.813 TiB
2024-08-18T11:05:36+02:00: On-Disk usage: 2.738 TiB (3.66%)
2024-08-18T11:05:36+02:00: On-Disk chunks: 2317035
2024-08-18T11:05:36+02:00: Deduplication factor: 27.33
2024-08-18T11:05:36+02:00: Average chunk size: 1.239 MiB
2024-08-18T11:05:36+02:00: TASK OK

Okay, the same ~30 minutes for phase1 plus 44 minutes for the actual removal.
 
With rotating rust in a single vdev = 4 drives in Raidz2 = worst case possible. No Special Device involved.
...
~30 minutes for phase1

Just to complement my experience from above: some weeks ago I had added a Special Device consisting of three mirrored USB thingies. This is absolutely NOT recommended, but hey - it's a Homelab and I have multiple PBS' here :-)

Last night it did its weekly job as usual, so it was "warmed up" when I started manually an additional GC:
Code:
2025-02-23T09:04:11+01:00: starting garbage collection on store pbsc
2025-02-23T09:04:11+01:00: Start GC phase1 (mark used chunks)
2025-02-23T09:04:11+01:00: marked 1% (31 of 3063 index files)
...
2025-02-23T09:05:42+01:00: marked 100% (3063 of 3063 index files)
2025-02-23T09:05:42+01:00: Start GC phase2 (sweep unused chunks)
2025-02-23T09:05:43+01:00: processed 1% (20921 chunks)
...
2025-02-23T09:06:27+01:00: processed 99% (2055914 chunks)
2025-02-23T09:06:28+01:00: Removed garbage: 0 B
2025-02-23T09:06:28+01:00: Removed chunks: 0
2025-02-23T09:06:28+01:00: Original data usage: 57.061 TiB
2025-02-23T09:06:28+01:00: On-Disk usage: 2.511 TiB (4.40%)
2025-02-23T09:06:28+01:00: On-Disk chunks: 2076568
2025-02-23T09:06:28+01:00: Deduplication factor: 22.72
2025-02-23T09:06:28+01:00: Average chunk size: 1.268 MiB
2025-02-23T09:06:28+01:00: TASK OK

That run was in a "warm" state and it took only 2:17!

Too fast? Don't know without another test: I reboot and do the same, so all ARC are basically cold now:
Code:
2025-02-23T09:14:23+01:00: starting garbage collection on store pbsc
...
2025-02-23T09:18:35+01:00: Start GC phase2 (sweep unused chunks)
...
2025-02-23T09:18:46+01:00: TASK OK

So 4:23 this time, makes sense! (Later I notice that another container had started in parallel, so this measured duration is probably too high.) I run it immediately again, a third time:
Code:
2025-02-23T09:20:31+01:00: starting garbage collection on store pbsc
...
2025-02-23T09:22:05+01:00: TASK OK
Third run: 1:34

It looks like in my case this not-recommended construct has brought GC duration from ~30 minutes down to two to four minutes.

I am fine with this :-)
 
@UdoB what's so unrecommended about that?
Very similar config here.
Spinners in a raidz2. Mirror special vdev.

Sub-2 minute GC.


1740346478859.png

BTW, let's trade tuning notes!

Really, I'm curious where you drew the line between recordsize and special_small_blocks for PBS.
I ran the histogram prior to adding the SSDs, but making a judgement from it seems something of a dark art.
My workload is mixed win/lin. Lots of databases.

rpool recordsize 1M local

rpool special_small_blocks 512K local


rpool compression on local
rpool atime on local
rpool relatime on local
rpool redundant_metadata all default
rpool encryption off default
 
Last edited:
@UdoB what's so unrecommended about that?
a) the pure fact that my PBS datastore is based on rotating rust - it will slow down restores with or w/o Special Device
b) using USB on a critical device
c) in my case: cheap devices

I've had trouble again and again evaluating and actually using USB for datastores on the long run - usually with consumer grade devices. My personal impression: it works. Until it doesn't. (Remember: this is my Homelab - I would not tolerate this approach for my dayjob.)

In this specific case it is a tripple mirror not to match the redundancy level of the RaidZ2 (which would be the legitimate reason) but because the first iteration with two devices as a mirror was not stable.

BTW, let's trade tuning notes!
Sure:

My initial intention was to catch for metadata only. The "small blocks" aspect was a goodie I did not plan for. My random spare devices gave me 240 GB, and this seemed to be large enough to put some small blocks onto it, so I went for this:
Code:
~# zfs get  atime,encryption,relatime,redundant_metadata,recordsize,special_small_blocks  rpool/data/subvol-2004-disk-1
NAME                           PROPERTY              VALUE                 SOURCE
rpool/data/subvol-2004-disk-1  atime                 on                    inherited from rpool/data
rpool/data/subvol-2004-disk-1  encryption            off                   default
rpool/data/subvol-2004-disk-1  relatime              on                    inherited from rpool
rpool/data/subvol-2004-disk-1  redundant_metadata    all                   default
rpool/data/subvol-2004-disk-1  recordsize            256K                  inherited from rpool
rpool/data/subvol-2004-disk-1  special_small_blocks  128K                  inherited from rpool

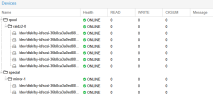
NAME                                                SIZE  ALLOC   FREE  CKPOINT  EXPANDSZ   FRAG    CAP  DEDUP    HEALTH  ALTROOT
special                                                -      -      -        -         -      -      -      -         -
  mirror-1                                          232G   127G   105G        -         -    77%  54.6%      -    ONLINE

With 55% used I hit the sweet spot I had hoped for :-)

For aiming I used a oneliner from some post here in the forum; I did not put the URL in my notes but only the command in itself:
Code:
find . -type f -print0 | xargs -0 ls -l | awk '{ n=int(log($5)/log(2)); if (n<10) { n=10; } size[n]++ } END { for (i in size) printf("%d %d\n", 2^i, size[i]) }' | sort -n | awk 'function human(x) { x[1]/=1024; if (x[1]>=1024) { x[2]++; human(x) } } { a[1]=$1; a[2]=0; human(a); printf("%3d%s: %6d\n", a[1],substr("kMGTEPYZ",a[2]+1,1),$2) }'

  1k:  23554
  2k:  20848
  4k:  26084
  8k:  28332
 16k:  35175
 32k:  61425
 64k:  98496
128k: 149448
256k: 278598
Edit for clarification: that data is from November 2024, before adding the SD ;-)
Just add up those lines to know the sum of bytes stored in those ominous "small blocks".
Code:
$ echo "23554*2^10 + 20848*2^11 + 26084*2^12 + 28332*2^13 + 35175*2^14 + 61425*2^15 + 98496*2^16 + 149448*2^17 + 278598*2^18 " | bc
102071109632
This includes a large amount of 256k blocks and it is "just" 102 Gigabyte, so it would fit on those 240GB, right? But with not knowing how much space the pure Metadata would actually allocate I stepped down to 128K. My current situation proves this decision was a good one :cool:

Conclusion for this one and post #6: "Special Devices" are crucial for some use cases, PBS on rotating rust being the most prominent - at least in my (small) world.

Oh... this detail is important: this configuration impacts only newly written data - adding a "Special Device" to an already filled up pool does not help! To read and write again every piece of data I used a script: https://github.com/markusressel/zfs-inplace-rebalancing
Meanwhile I believe there are better ways to do that!
 
Last edited: