hello, we have three nodes each with one osd monitor and manager, suddenly one of them failed fatal, monitors are in unknow state, and managers are not showing
ceph -s hangs
ceph -s hangs
hello, we have three nodes each with one osd monitor and manager, suddenly one of them failed fatal, monitors are in unknow state, and managers are not showing
ceph -s hangs
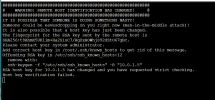
/etc/pve/ceph.conf and check your ceph-network. Can you ping from on host to the others on the ceph network? If you have jumbo-frames enabled can you ping with ping -M do -s 8972 IP-NodeX ?


Post your /etc/pve/ceph.conf and check your ceph-network. Can you ping from on host to the others on the ceph network? If you have jumbo-frames enabled can you ping with ping -M do -s 8972 IP-NodeX ? What about timesync, do you have correct time and a working chrony?Did you ever resolve this? I am having same issue.
ceph -s jsut sites there and freezes
timeout 500 on gui for ceph status page/dashboard
config shows all the correct hosts for monitors and correct node ip
proxmox node to node connectivity is fine - just ceph MANAGERS are missing and no OSDs are shown.
View attachment 34595
View attachment 34596
View attachment 34597
The disks show OSD are there but ceph is dead to the world without manager working.. no clue what happened... was thinking this might be a related post - sorry to hijack it.. but no one respond to my other requests so thinking maybe you fixed your issue and can help me too.
#1 - I have 9 nodesBest practice for CEPH is minimum 4 nodes with adequate resources (4GB of RAM per OSD and one CPU core per OSD) and redundant (aggregated) network interfaces for CEPH public and monitor networks. If your CEPH is failing, consider rebooting each node and make sure to back up guests frequently during operation, especially when not following best practices...
Tmanok
Sorry that you did not appreciate the format and approach in my response, I will put more effort in next time to avoid a tone where it seems that I am making assumptions. Your posts did not mention the number of nodes and the most probable cause for failing ceph is due to underprovisioning or too few nodes.#1 - I have 9 nodes
#2 - all nodes are plenty resources
#4 - of course I rebooted all nodes...
this happened after octo update to pacific with the automatic update and upgrade script....
Aside from generic info - your answer has no value to my case posted... ceph just hangs and mds and osd data is like it is wiped out... need to see if I can recover manager mds data.... driver still show they have ods stores on them... so need to rebuild or find out what is cause for managers on the nodes to not turn on...


[global]
     auth_client_required = cephx
     auth_cluster_required = cephx
     auth_service_required = cephx
     cluster_network = 10.0.1.1/16
     fsid = cfa7f7e5-64a7-48dd-bd77-466ff1e77bbb
     mon_allow_pool_delete = true
     mon_host = 10.0.1.2 10.0.1.1 10.0.1.6 10.0.1.5 10.0.90.0 10.0.1.7
     ms_bind_ipv4 = true
     osd_pool_default_min_size = 2
     osd_pool_default_size = 3
     public_network = 10.0.1.1/16

[client]
     keyring = /etc/pve/priv/$cluster.$name.keyring

[mds]
     keyring = /var/lib/ceph/mds/ceph-$id/keyring

[mds.node2]
     host = node2
     mds_standby_for_name = pve

[mds.node7]
     host = node7
     mds standby for name = pve

[mds.node900]
     host = node900
     mds_standby_for_name = pve

[mds.stack1]
     host = stack1
     mds_standby_for_name = pve

[mon.node2]
     public_addr = 10.0.1.2

[mon.node5]
     public_addr = 10.0.1.5

[mon.node6]
     public_addr = 10.0.1.6

[mon.node7]
     public_addr = 10.0.1.7

[mon.node900]
     public_addr = 10.0.90.0

[mon.stack1]
     public_addr = 10.0.1.1

[mon]
mon_mds_skip_sanity = trueFeb 27 16:35:54 node900 pvedaemon[1804215]: got timeout
Feb 27 16:36:01 node900 mount[1808559]: mount error: no mds server is up or the cluster is laggy
Feb 27 16:36:01 node900 systemd[1]: mnt-pve-ISO_store1.mount: Mount process exited, code=exited, status=32/n/a
Feb 27 16:36:01 node900 systemd[1]: mnt-pve-ISO_store1.mount: Failed with result 'exit-code'.
Feb 27 16:36:01 node900 kernel: ceph: No mds server is up or the cluster is laggy
Feb 27 16:36:01 node900 systemd[1]: Failed to mount /mnt/pve/ISO_store1.
Feb 27 16:36:01 node900 pvestatd[1614]: mount error: Job failed. See "journalctl -xe" for details.
Feb 27 16:36:06 node900 pvestatd[1614]: got timeout
Feb 27 16:36:11 node900 pvestatd[1614]: got timeout
Feb 27 16:36:11 node900 pvestatd[1614]: status update time (82.828 seconds)
Feb 27 16:36:16 node900 pvestatd[1614]: got timeout
Feb 27 16:36:19 node900 pmxcfs[1348]: [status] notice: received log
Feb 27 16:36:21 node900 pvestatd[1614]: got timeout
Feb 27 16:36:21 node900 systemd[1]: Reloading.
Feb 27 16:36:21 node900 systemd[1]: /lib/systemd/system/ceph-volume@.service:8: Unit configured to use KillMode=none. This is unsafe, as it disables systemd's process lifecycle management for the service. Please update your service to use a safer KillMode=, such as 'mixed' or 'control-group'. Support for KillMode=none is deprecated and will eventually be removed.
Feb 27 16:36:21 node900 systemd[1]: /lib/systemd/system/ceph-volume@.service:8: Unit configured to use KillMode=none. This is unsafe, as it disables systemd's process lifecycle management for the service. Please update your service to use a safer KillMode=, such as 'mixed' or 'control-group'. Support for KillMode=none is deprecated and will eventually be removed.
Feb 27 16:36:21 node900 systemd[1]: /lib/systemd/system/ceph-volume@.service:8: Unit configured to use KillMode=none. This is unsafe, as it disables systemd's process lifecycle management for the service. Please update your service to use a safer KillMode=, such as 'mixed' or 'control-group'. Support for KillMode=none is deprecated and will eventually be removed.
Feb 27 16:36:21 node900 systemd[1]: /lib/systemd/system/ceph-volume@.service:8: Unit configured to use KillMode=none. This is unsafe, as it disables systemd's process lifecycle management for the service. Please update your service to use a safer KillMode=, such as 'mixed' or 'control-group'. Support for KillMode=none is deprecated and will eventually be removed.
Feb 27 16:36:21 node900 systemd[1]: /lib/systemd/system/ceph-volume@.service:8: Unit configured to use KillMode=none. This is unsafe, as it disables systemd's process lifecycle management for the service. Please update your service to use a safer KillMode=, such as 'mixed' or 'control-group'. Support for KillMode=none is deprecated and will eventually be removed.
Feb 27 16:36:21 node900 systemd[1]: /lib/systemd/system/ceph-volume@.service:8: Unit configured to use KillMode=none. This is unsafe, as it disables systemd's process lifecycle management for the service. Please update your service to use a safer KillMode=, such as 'mixed' or 'control-group'. Support for KillMode=none is deprecated and will eventually be removed.
Feb 27 16:36:21 node900 systemd[1]: /lib/systemd/system/ceph-volume@.service:8: Unit configured to use KillMode=none. This is unsafe, as it disables systemd's process lifecycle management for the service. Please update your service to use a safer KillMode=, such as 'mixed' or 'control-group'. Support for KillMode=none is deprecated and will eventually be removed.
Feb 27 16:36:22 node900 systemd[1]: Mounting /mnt/pve/ISO_store1...
Feb 27 16:36:22 node900 kernel: libceph: mon3 (1)10.0.1.6:6789 socket closed (con state V1_BANNER)
Feb 27 16:36:22 node900 kernel: libceph: mon3 (1)10.0.1.6:6789 socket closed (con state V1_BANNER)
Feb 27 16:36:23 node900 kernel: libceph: mon3 (1)10.0.1.6:6789 socket closed (con state V1_BANNER)
Feb 27 16:36:24 node900 kernel: libceph: mon3 (1)10.0.1.6:6789 socket closed (con state V1_BANNER)
Feb 27 16:36:28 node900 kernel: libceph: mon5 (1)10.0.90.0:6789 socket closed (con state OPEN)
Feb 27 16:36:28 node900 pvedaemon[1803097]: got timeout2022-02-21T11:23:40.212664-0600 mon.node2 (mon.0) 2000851 : cluster [INF] mon.node2 is new leader, mons node2,stack1,node7 in quorum (ranks 0,1,3)
2022-02-21T11:23:40.219565-0600 mon.node2 (mon.0) 2000852 : cluster [DBG] monmap e14: 4 mons at {node2=[v2:10.0.1.2:3300/0,v1:10.0.1.2:6789/0],node7=[v2:10.0.1.7:3300/0,v1:10.0.1.7:6789/0],node900=[v2:10.0.90.0:3300/0,v1:10.0.90.0:6789/0],stack1=[v2:10.0.1.1:3300/0,v1:10.0.1.1:6789/0]}
2022-02-21T11:23:40.219633-0600 mon.node2 (mon.0) 2000853 : cluster [DBG] fsmap cephfs:1 {0=node2=up:active} 2 up:standby
2022-02-21T11:23:40.219653-0600 mon.node2 (mon.0) 2000854 : cluster [DBG] osdmap e967678: 14 total, 4 up, 10 in
2022-02-21T11:23:40.220140-0600 mon.node2 (mon.0) 2000855 : cluster [DBG] mgrmap e649: stack1(active, since 5d), standbys: node2, node7
2022-02-21T11:23:40.228388-0600 mon.node2 (mon.0) 2000856 : cluster [ERR] Health detail: HEALTH_ERR 1 MDSs report slow metadata IOs; mon node7 is very low on available space; mon stack1 is low on available space; 1/4 mons down, quorum node2,stack1,node7; 6 osds down; 1 host (7 osds) down; Reduced data availability: 169 pgs inactive, 45 pgs down, 124 pgs peering, 388 pgs stale; 138 slow ops, oldest one blocked for 61680 sec, osd.0 has slow ops
2022-02-21T11:23:40.228404-0600 mon.node2 (mon.0) 2000857 : cluster [ERR] [WRN] MDS_SLOW_METADATA_IO: 1 MDSs report slow metadata IOs
2022-02-21T11:23:40.228409-0600 mon.node2 (mon.0) 2000858 : cluster [ERR] mds.node2(mds.0): 7 slow metadata IOs are blocked > 30 secs, oldest blocked for 78670 secs
2022-02-21T11:23:40.228413-0600 mon.node2 (mon.0) 2000859 : cluster [ERR] [ERR] MON_DISK_CRIT: mon node7 is very low on available space
2022-02-21T11:23:40.228416-0600 mon.node2 (mon.0) 2000860 : cluster [ERR] mon.node7 has 1% avail
2022-02-21T11:23:40.228422-0600 mon.node2 (mon.0) 2000861 : cluster [ERR] [WRN] MON_DISK_LOW: mon stack1 is low on available space
2022-02-21T11:23:40.228428-0600 mon.node2 (mon.0) 2000862 : cluster [ERR] mon.stack1 has 8% avail
2022-02-21T11:23:40.228432-0600 mon.node2 (mon.0) 2000863 : cluster [ERR] [WRN] MON_DOWN: 1/4 mons down, quorum node2,stack1,node7
2022-02-21T11:23:40.228437-0600 mon.node2 (mon.0) 2000864 : cluster [ERR] mon.node900 (rank 2) addr [v2:10.0.90.0:3300/0,v1:10.0.90.0:6789/0] is down (out of quorum)
2022-02-21T11:23:40.228443-0600 mon.node2 (mon.0) 2000865 : cluster [ERR] [WRN] OSD_DOWN: 6 osds down
2022-02-21T11:23:40.228449-0600 mon.node2 (mon.0) 2000866 : cluster [ERR] osd.8 (root=default,host=node900) is down
2022-02-21T11:23:40.228454-0600 mon.node2 (mon.0) 2000867 : cluster [ERR] osd.9 (root=default,host=node900) is down
2022-02-21T11:23:40.228460-0600 mon.node2 (mon.0) 2000868 : cluster [ERR] osd.10 (root=default,host=node900) is down
2022-02-21T11:23:40.228466-0600 mon.node2 (mon.0) 2000869 : cluster [ERR] osd.11 (root=default,host=node900) is down
2022-02-21T11:23:40.228471-0600 mon.node2 (mon.0) 2000870 : cluster [ERR] osd.12 (root=default,host=node900) is down
2022-02-21T11:23:40.228477-0600 mon.node2 (mon.0) 2000871 : cluster [ERR] osd.13 (root=default,host=node900) is down
2022-02-21T11:23:40.228483-0600 mon.node2 (mon.0) 2000872 : cluster [ERR] [WRN] OSD_HOST_DOWN: 1 host (7 osds) down
2022-02-21T11:23:40.228488-0600 mon.node2 (mon.0) 2000873 : cluster [ERR] host node900 (root=default) (7 osds) is down
2022-02-21T11:23:40.228527-0600 mon.node2 (mon.0) 2000874 : cluster [ERR] [WRN] PG_AVAILABILITY: Reduced data availability: 169 pgs inactive, 45 pgs down, 124 pgs peering, 388 pgs stale
2022-02-21T11:23:40.228534-0600 mon.node2 (mon.0) 2000875 : cluster [ERR] pg 7.cd is stuck inactive for 21h, current state stale+down, last acting [0]
2022-02-21T11:23:40.228539-0600 mon.node2 (mon.0) 2000876 : cluster [ERR] pg 7.ce is stuck peering for 21h, current state peering, last acting [0,7]
2022-02-21T11:23:40.228544-0600 mon.node2 (mon.0) 2000877 : cluster [ERR] pg 7.cf is stuck stale for 21h, current state stale+active+clean, last acting [6,3,8]
2022-02-21T11:23:40.228550-0600 mon.node2 (mon.0) 2000878 : cluster [ERR] pg 7.d0 is stuck stale for 21h, current state stale+active+clean, last acting [12,2,6]
2022-02-21T11:23:40.228555-0600 mon.node2 (mon.0) 2000879 : cluster [ERR] pg 7.d1 is stuck stale for 21h, current state stale+active+clean, last acting [9,1,2]
2022-02-21T11:23:40.228561-0600 mon.node2 (mon.0) 2000880 : cluster [ERR] pg 7.d2 is stuck stale for 21h, current state stale+active+clean, last acting [3,9,2]
2022-02-21T11:23:40.228567-0600 mon.node2 (mon.0) 2000881 : cluster [ERR] pg 7.d3 is stuck peering for 21h, current state peering, last acting [0,6]
2022-02-21T11:23:40.228574-0600 mon.node2 (mon.0) 2000882 : cluster [ERR] pg 7.d4 is stuck stale for 21h, current state stale+active+clean, last acting [8,6,1]
2022-02-21T11:23:40.228580-0600 mon.node2 (mon.0) 2000883 : cluster [ERR] pg 7.d5 is stuck stale for 21h, current state stale+active+clean, last acting [13,6,7]
2022-02-21T11:23:40.228585-0600 mon.node2 (mon.0) 2000884 : cluster [ERR] pg 7.d6 is stuck stale for 21h, current state stale+active+clean, last acting [11,1,3]
2022-02-21T11:23:40.228591-0600 mon.node2 (mon.0) 2000885 : cluster [ERR] pg 7.d7 is stuck stale for 21h, current state stale+active+clean, last acting [8,2,6]
2022-02-21T11:23:40.228597-0600 mon.node2 (mon.0) 2000886 : cluster [ERR] pg 7.d8 is stuck stale for 21h, current state stale+active+clean, last acting [11,7,6]
2022-02-21T11:23:40.228602-0600 mon.node2 (mon.0) 2000887 : cluster [ERR] pg 7.d9 is stuck stale for 21h, current state stale+active+clean, last acting [2,6,11]
2022-02-21T11:23:40.228608-0600 mon.node2 (mon.0) 2000888 : cluster [ERR] pg 7.da is stuck peering for 21h, current state peering, last acting [0,7]
2022-02-21T11:23:40.228613-0600 mon.node2 (mon.0) 2000889 : cluster [ERR] pg 7.db is stuck peering for 21h, current state peering, last acting [0,7]
2022-02-21T11:23:40.228619-0600 mon.node2 (mon.0) 2000890 : cluster [ERR] pg 7.dc is stuck peering for 21h, current state peering, last acting [0,6]
2022-02-21T11:23:40.228624-0600 mon.node2 (mon.0) 2000891 : cluster [ERR] pg 7.dd is stuck stale for 18h, current state stale+down, last acting [0]
2022-02-21T11:23:40.228630-0600 mon.node2 (mon.0) 2000892 : cluster [ERR] pg 7.de is stuck stale for 21h, current state stale+active+clean, last acting [2,3,10]
2022-02-21T11:23:40.228635-0600 mon.node2 (mon.0) 2000893 : cluster [ERR] pg 7.df is stuck stale for 21h, current state stale+active+clean, last acting [3,1,14]
2022-02-21T11:23:40.228641-0600 mon.node2 (mon.0) 2000894 : cluster [ERR] pg 7.e0 is stuck peering for 21h, current state peering, last acting [0,7]
2022-02-21T11:23:40.228646-0600 mon.node2 (mon.0) 2000895 : cluster [ERR] pg 7.e1 is stuck peering for 21h, current state peering, last acting [0,1]
2022-02-21T11:23:40.228652-0600 mon.node2 (mon.0) 2000896 : cluster [ERR] pg 7.e2 is stuck stale for 21h, current state stale+active+clean, last acting [9,2,6]
2022-02-21T11:23:40.228658-0600 mon.node2 (mon.0) 2000897 : cluster [ERR] pg 7.e3 is stuck stale for 21h, current state stale+active+clean, last acting [7,9,1]
2022-02-21T11:23:40.228663-0600 mon.node2 (mon.0) 2000898 : cluster [ERR] pg 7.e4 is stuck stale for 21h, current state stale+active+clean, last acting [8,7,1]
2022-02-21T11:23:40.228669-0600 mon.node2 (mon.0) 2000899 : cluster [ERR] pg 7.e5 is stuck peering for 22h, current state peering, last acting [0,6]
2022-02-21T11:23:40.228675-0600 mon.node2 (mon.0) 2000900 : cluster [ERR] pg 7.e6 is stuck stale for 21h, current state stale+active+clean, last acting [3,11,6]
2022-02-21T11:23:40.228680-0600 mon.node2 (mon.0) 2000901 : cluster [ERR] pg 7.e7 is down, acting [0,7]
2022-02-21T11:23:40.228685-0600 mon.node2 (mon.0) 2000902 : cluster [ERR] pg 7.e8 is stuck stale for 21h, current state stale+active+clean, last acting [8,3,6]root@node7:/etc/pve# ceph auth ls
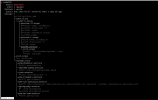
2022-02-27T17:17:55.616-0600 7f907359e700 0 monclient(hunting): authenticate timed out after 300
2022-02-27T17:22:55.618-0600 7f907359e700 0 monclient(hunting): authenticate timed out after 300
2022-02-27T17:27:55.615-0600 7f907359e700 0 monclient(hunting): authenticate timed out after 300
2022-02-27T17:32:55.617-0600 7f907359e700 0 monclient(hunting): authenticate timed out after 300Currently we only know that the PVE corosync talks fine, I would like to see the output of "ip a" and each node's Network page to help you verify that. Additionally if you could try the following pings on every node:They talk to each other fine...
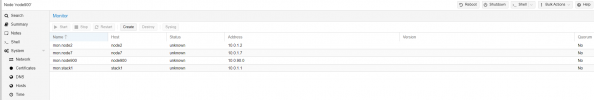
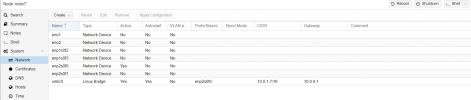
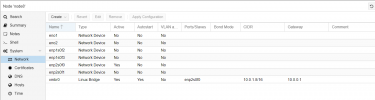
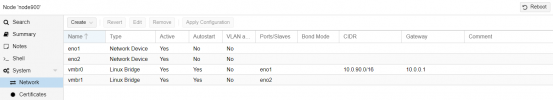
Not only no quorum, but status "unknown" I wouldn't exactly call that "on". Double check your screenshot, it states they are unknown which happens normally when networking has failed or worse when the software stack is encountering an issue. Additionally, not all of the configured monitors are displayed in that same screenshot of your monitors.Monitors appear to be on - but no quorum
Ok between your managers being missing and not all of your monitors are showing in one of your screenshots, something tells me the issue is related to the software stack or networking stack. By the way, if you monitors are not working (currently the case) your OSDs won't be displayed and when CEPH stack e.g. monitors and managers are not working, the CRUSH algorithm will be halted. First verify connectivity, then try:proxmox node to node connectivity is fine - just ceph MANAGERS are missing and no OSDs are shown.
systemctl statusHi GoZippy,
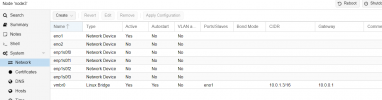
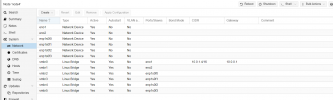
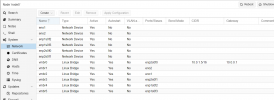
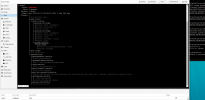
Currently we only know that the PVE corosync talks fine, I would like to see the output of "ip a" and each node's Network page to help you verify that. Additionally if you could try the following pings on every node:
- 10.0.1.2
- 10.0.1.5
- 10.0.1.6
- 10.0.1.7
- 10.0.90.0
- 10.0.1.1

root@stack1:~# ip a
1: lo: <LOOPBACK,UP,LOWER_UP> mtu 65536 qdisc noqueue state UNKNOWN group default qlen 1000
    link/loopback 00:00:00:00:00:00 brd 00:00:00:00:00:00
    inet 127.0.0.1/8 scope host lo
       valid_lft forever preferred_lft forever
    inet6 ::1/128 scope host
       valid_lft forever preferred_lft forever
2: eno1: <BROADCAST,MULTICAST,UP,LOWER_UP> mtu 1500 qdisc mq master vmbr0 state UP group default qlen 1000
    link/ether 00:0e:b6:5c:ea:b8 brd ff:ff:ff:ff:ff:ff
    altname enp2s0f0
3: eno2: <NO-CARRIER,BROADCAST,MULTICAST,UP> mtu 1500 qdisc mq master vmbr1 state DOWN group default qlen 1000
    link/ether 00:0e:b6:5c:ea:b9 brd ff:ff:ff:ff:ff:ff
    altname enp2s0f1
4: enp1s0f0: <NO-CARRIER,BROADCAST,MULTICAST,UP> mtu 1500 qdisc mq master vmbr2 state DOWN group default qlen 1000
    link/ether 00:0e:b6:a8:9d:10 brd ff:ff:ff:ff:ff:ff
5: enp1s0f1: <NO-CARRIER,BROADCAST,MULTICAST,UP> mtu 1500 qdisc mq master vmbr3 state DOWN group default qlen 1000
    link/ether 00:0e:b6:a8:9d:11 brd ff:ff:ff:ff:ff:ff
6: enp1s0f2: <NO-CARRIER,BROADCAST,MULTICAST,UP> mtu 1500 qdisc mq master vmbr4 state DOWN group default qlen 1000
    link/ether 00:0e:b6:a8:9d:12 brd ff:ff:ff:ff:ff:ff
7: enp1s0f3: <NO-CARRIER,BROADCAST,MULTICAST,UP> mtu 1500 qdisc mq master vmbr5 state DOWN group default qlen 1000
    link/ether 00:0e:b6:a8:9d:13 brd ff:ff:ff:ff:ff:ff
8: vmbr0: <BROADCAST,MULTICAST,UP,LOWER_UP> mtu 1500 qdisc noqueue state UP group default qlen 1000
    link/ether 00:0e:b6:5c:ea:b8 brd ff:ff:ff:ff:ff:ff
    inet 10.0.1.1/16 scope global vmbr0
       valid_lft forever preferred_lft forever
    inet6 fe80::20e:b6ff:fe5c:eab8/64 scope link
       valid_lft forever preferred_lft forever
9: vmbr1: <NO-CARRIER,BROADCAST,MULTICAST,UP> mtu 1500 qdisc noqueue state DOWN group default qlen 1000
    link/ether 00:0e:b6:5c:ea:b9 brd ff:ff:ff:ff:ff:ff
    inet 10.10.10.1/16 scope global vmbr1
       valid_lft forever preferred_lft forever
    inet6 fe80::20e:b6ff:fe5c:eab9/64 scope link
       valid_lft forever preferred_lft forever
10: vmbr2: <NO-CARRIER,BROADCAST,MULTICAST,UP> mtu 1500 qdisc noqueue state DOWN group default qlen 1000
    link/ether 00:0e:b6:a8:9d:10 brd ff:ff:ff:ff:ff:ff
11: vmbr3: <NO-CARRIER,BROADCAST,MULTICAST,UP> mtu 1500 qdisc noqueue state DOWN group default qlen 1000
    link/ether 00:0e:b6:a8:9d:11 brd ff:ff:ff:ff:ff:ff
12: vmbr4: <NO-CARRIER,BROADCAST,MULTICAST,UP> mtu 1500 qdisc noqueue state DOWN group default qlen 1000
    link/ether 00:0e:b6:a8:9d:12 brd ff:ff:ff:ff:ff:ff
13: vmbr5: <NO-CARRIER,BROADCAST,MULTICAST,UP> mtu 1500 qdisc noqueue state DOWN group default qlen 1000
    link/ether 00:0e:b6:a8:9d:13 brd ff:ff:ff:ff:ff:ff
root@node2:~# ip a
1: lo: <LOOPBACK,UP,LOWER_UP> mtu 65536 qdisc noqueue state UNKNOWN group default qlen 1000
    link/loopback 00:00:00:00:00:00 brd 00:00:00:00:00:00
    inet 127.0.0.1/8 scope host lo
       valid_lft forever preferred_lft forever
    inet6 ::1/128 scope host
       valid_lft forever preferred_lft forever
2: eno1: <BROADCAST,MULTICAST,UP,LOWER_UP> mtu 1500 qdisc mq master vmbr0 state UP group default qlen 1000
    link/ether 00:0e:b6:5c:9f:e0 brd ff:ff:ff:ff:ff:ff
    altname enp2s0f0
3: eno2: <BROADCAST,MULTICAST> mtu 1500 qdisc noop state DOWN group default qlen 1000
    link/ether 00:0e:b6:5c:9f:e1 brd ff:ff:ff:ff:ff:ff
    altname enp2s0f1
4: enp1s0f0: <BROADCAST,MULTICAST> mtu 1500 qdisc noop state DOWN group default qlen 1000
    link/ether 00:0e:b6:a8:63:d1 brd ff:ff:ff:ff:ff:ff
5: enp1s0f1: <BROADCAST,MULTICAST> mtu 1500 qdisc noop state DOWN group default qlen 1000
    link/ether 00:0e:b6:a8:63:d2 brd ff:ff:ff:ff:ff:ff
6: enp1s0f2: <BROADCAST,MULTICAST> mtu 1500 qdisc noop state DOWN group default qlen 1000
    link/ether 00:0e:b6:a8:63:d3 brd ff:ff:ff:ff:ff:ff
7: enp1s0f3: <BROADCAST,MULTICAST> mtu 1500 qdisc noop state DOWN group default qlen 1000
    link/ether 00:0e:b6:a8:63:d4 brd ff:ff:ff:ff:ff:ff
8: vmbr0: <BROADCAST,MULTICAST,UP,LOWER_UP> mtu 1500 qdisc noqueue state UP group default qlen 1000
    link/ether 00:0e:b6:5c:9f:e0 brd ff:ff:ff:ff:ff:ff
    inet 10.0.1.2/16 scope global vmbr0
       valid_lft forever preferred_lft forever
    inet6 fe80::20e:b6ff:fe5c:9fe0/64 scope link
       valid_lft forever preferred_lft forever
root@node2:~#root@node3:~# ip a
1: lo: <LOOPBACK,UP,LOWER_UP> mtu 65536 qdisc noqueue state UNKNOWN group default qlen 1000
link/loopback 00:00:00:00:00:00 brd 00:00:00:00:00:00
inet 127.0.0.1/8 scope host lo
valid_lft forever preferred_lft forever
inet6 ::1/128 scope host
valid_lft forever preferred_lft forever
2: eno1: <BROADCAST,MULTICAST,UP,LOWER_UP> mtu 1500 qdisc mq master vmbr0 state UP group default qlen 1000
link/ether 00:0e:b6:5c:d5:90 brd ff:ff:ff:ff:ff:ff
altname enp2s0f0
3: eno2: <BROADCAST,MULTICAST> mtu 1500 qdisc noop state DOWN group default qlen 1000
link/ether 00:0e:b6:5c:d5:91 brd ff:ff:ff:ff:ff:ff
altname enp2s0f1
4: enp1s0f0: <BROADCAST,MULTICAST> mtu 1500 qdisc noop state DOWN group default qlen 1000
link/ether 00:0e:b6:a8:54:b7 brd ff:ff:ff:ff:ff:ff
5: enp1s0f1: <BROADCAST,MULTICAST> mtu 1500 qdisc noop state DOWN group default qlen 1000
link/ether 00:0e:b6:a8:54:b8 brd ff:ff:ff:ff:ff:ff
6: enp1s0f2: <BROADCAST,MULTICAST> mtu 1500 qdisc noop state DOWN group default qlen 1000
link/ether 00:0e:b6:a8:54:b9 brd ff:ff:ff:ff:ff:ff
7: enp1s0f3: <BROADCAST,MULTICAST> mtu 1500 qdisc noop state DOWN group default qlen 1000
link/ether 00:0e:b6:a8:54:ba brd ff:ff:ff:ff:ff:ff
8: vmbr0: <BROADCAST,MULTICAST,UP,LOWER_UP> mtu 1500 qdisc noqueue state UP group default qlen 1000
link/ether 00:0e:b6:5c:d5:90 brd ff:ff:ff:ff:ff:ff
inet 10.0.1.3/16 scope global vmbr0
valid_lft forever preferred_lft forever
inet6 fe80::20e:b6ff:fe5c:d590/64 scope link
valid_lft forever preferred_lft forever
root@node3:~#root@node4:~# ip a
1: lo: <LOOPBACK,UP,LOWER_UP> mtu 65536 qdisc noqueue state UNKNOWN group default qlen 1000
link/loopback 00:00:00:00:00:00 brd 00:00:00:00:00:00
inet 127.0.0.1/8 scope host lo
valid_lft forever preferred_lft forever
inet6 ::1/128 scope host
valid_lft forever preferred_lft forever
2: eno1: <BROADCAST,MULTICAST,UP,LOWER_UP> mtu 1500 qdisc mq master vmbr0 state UP group default qlen 1000
link/ether 00:0e:b6:51:3b:b0 brd ff:ff:ff:ff:ff:ff
altname enp2s0f0
3: eno2: <NO-CARRIER,BROADCAST,MULTICAST,UP> mtu 1500 qdisc mq master vmbr1 state DOWN group default qlen 1000
link/ether 00:0e:b6:51:3b:b1 brd ff:ff:ff:ff:ff:ff
altname enp2s0f1
4: enp1s0f0: <NO-CARRIER,BROADCAST,MULTICAST,UP> mtu 1500 qdisc mq master vmbr2 state DOWN group default qlen 1000
link/ether 00:0e:b6:87:70:b2 brd ff:ff:ff:ff:ff:ff
5: enp1s0f1: <NO-CARRIER,BROADCAST,MULTICAST,UP> mtu 1500 qdisc mq master vmbr3 state DOWN group default qlen 1000
link/ether 00:0e:b6:87:70:b3 brd ff:ff:ff:ff:ff:ff
6: enp1s0f2: <NO-CARRIER,BROADCAST,MULTICAST,UP> mtu 1500 qdisc mq master vmbr4 state DOWN group default qlen 1000
link/ether 00:0e:b6:87:70:b4 brd ff:ff:ff:ff:ff:ff
7: enp1s0f3: <NO-CARRIER,BROADCAST,MULTICAST,UP> mtu 1500 qdisc mq master vmbr5 state DOWN group default qlen 1000
link/ether 00:0e:b6:87:70:b5 brd ff:ff:ff:ff:ff:ff
8: vmbr0: <BROADCAST,MULTICAST,UP,LOWER_UP> mtu 1500 qdisc noqueue state UP group default qlen 1000
link/ether 00:0e:b6:51:3b:b0 brd ff:ff:ff:ff:ff:ff
inet 10.0.1.4/16 scope global vmbr0
valid_lft forever preferred_lft forever
inet6 fe80::20e:b6ff:fe51:3bb0/64 scope link
valid_lft forever preferred_lft forever
9: vmbr1: <NO-CARRIER,BROADCAST,MULTICAST,UP> mtu 1500 qdisc noqueue state DOWN group default qlen 1000
link/ether 00:0e:b6:51:3b:b1 brd ff:ff:ff:ff:ff:ff
inet6 fe80::20e:b6ff:fe51:3bb1/64 scope link
valid_lft forever preferred_lft forever
10: vmbr2: <NO-CARRIER,BROADCAST,MULTICAST,UP> mtu 1500 qdisc noqueue state DOWN group default qlen 1000
link/ether 00:0e:b6:87:70:b2 brd ff:ff:ff:ff:ff:ff
11: vmbr3: <NO-CARRIER,BROADCAST,MULTICAST,UP> mtu 1500 qdisc noqueue state DOWN group default qlen 1000
link/ether 00:0e:b6:87:70:b3 brd ff:ff:ff:ff:ff:ff
12: vmbr4: <NO-CARRIER,BROADCAST,MULTICAST,UP> mtu 1500 qdisc noqueue state DOWN group default qlen 1000
link/ether 00:0e:b6:87:70:b4 brd ff:ff:ff:ff:ff:ff
13: vmbr5: <NO-CARRIER,BROADCAST,MULTICAST,UP> mtu 1500 qdisc noqueue state DOWN group default qlen 1000
link/ether 00:0e:b6:87:70:b5 brd ff:ff:ff:ff:ff:ff
root@node4:~#root@node5:~# ip a
1: lo: <LOOPBACK,UP,LOWER_UP> mtu 65536 qdisc noqueue state UNKNOWN group default qlen 1000
link/loopback 00:00:00:00:00:00 brd 00:00:00:00:00:00
inet 127.0.0.1/8 scope host lo
valid_lft forever preferred_lft forever
inet6 ::1/128 scope host
valid_lft forever preferred_lft forever
2: enp2s0f0: <BROADCAST,MULTICAST,UP,LOWER_UP> mtu 1500 qdisc mq master vmbr0 state UP group default qlen 1000
link/ether 00:0e:b6:5c:a3:e8 brd ff:ff:ff:ff:ff:ff
3: enp2s0f1: <NO-CARRIER,BROADCAST,MULTICAST,UP> mtu 1500 qdisc mq master vmbr3 state DOWN group default qlen 1000
link/ether 00:0e:b6:5c:a3:e9 brd ff:ff:ff:ff:ff:ff
4: eno1: <NO-CARRIER,BROADCAST,MULTICAST,UP> mtu 1500 qdisc mq master vmbr2 state DOWN group default qlen 1000
link/ether 00:0e:b6:a8:54:b3 brd ff:ff:ff:ff:ff:ff
altname enp1s0f0
5: eno2: <NO-CARRIER,BROADCAST,MULTICAST,UP> mtu 1500 qdisc mq master vmbr1 state DOWN group default qlen 1000
link/ether 00:0e:b6:a8:54:b4 brd ff:ff:ff:ff:ff:ff
altname enp1s0f1
6: enp1s0f2: <NO-CARRIER,BROADCAST,MULTICAST,UP> mtu 1500 qdisc mq master vmbr4 state DOWN group default qlen 1000
link/ether 00:0e:b6:a8:54:b5 brd ff:ff:ff:ff:ff:ff
7: enp1s0f3: <NO-CARRIER,BROADCAST,MULTICAST,UP> mtu 1500 qdisc mq master vmbr5 state DOWN group default qlen 1000
link/ether 00:0e:b6:a8:54:b6 brd ff:ff:ff:ff:ff:ff
8: vmbr0: <BROADCAST,MULTICAST,UP,LOWER_UP> mtu 1500 qdisc noqueue state UP group default qlen 1000
link/ether 00:0e:b6:5c:a3:e8 brd ff:ff:ff:ff:ff:ff
inet 10.0.1.5/16 scope global vmbr0
valid_lft forever preferred_lft forever
inet6 fe80::20e:b6ff:fe5c:a3e8/64 scope link
valid_lft forever preferred_lft forever
9: vmbr1: <NO-CARRIER,BROADCAST,MULTICAST,UP> mtu 1500 qdisc noqueue state DOWN group default qlen 1000
link/ether 00:0e:b6:a8:54:b4 brd ff:ff:ff:ff:ff:ff
10: vmbr2: <NO-CARRIER,BROADCAST,MULTICAST,UP> mtu 1500 qdisc noqueue state DOWN group default qlen 1000
link/ether 00:0e:b6:a8:54:b3 brd ff:ff:ff:ff:ff:ff
11: vmbr3: <NO-CARRIER,BROADCAST,MULTICAST,UP> mtu 1500 qdisc noqueue state DOWN group default qlen 1000
link/ether 00:0e:b6:5c:a3:e9 brd ff:ff:ff:ff:ff:ff
inet6 fe80::20e:b6ff:fe5c:a3e9/64 scope link
valid_lft forever preferred_lft forever
12: vmbr4: <NO-CARRIER,BROADCAST,MULTICAST,UP> mtu 1500 qdisc noqueue state DOWN group default qlen 1000
link/ether 00:0e:b6:a8:54:b5 brd ff:ff:ff:ff:ff:ff
13: vmbr5: <NO-CARRIER,BROADCAST,MULTICAST,UP> mtu 1500 qdisc noqueue state DOWN group default qlen 1000
link/ether 00:0e:b6:a8:54:b6 brd ff:ff:ff:ff:ff:ff
root@node5:~#root@node7:~# ip a
1: lo: <LOOPBACK,UP,LOWER_UP> mtu 65536 qdisc noqueue state UNKNOWN group default qlen 1000
link/loopback 00:00:00:00:00:00 brd 00:00:00:00:00:00
inet 127.0.0.1/8 scope host lo
valid_lft forever preferred_lft forever
inet6 ::1/128 scope host
valid_lft forever preferred_lft forever
2: enp2s0f0: <BROADCAST,MULTICAST,UP,LOWER_UP> mtu 1500 qdisc mq master vmbr0 state UP group default qlen 1000
link/ether 00:0e:b6:5c:a9:c8 brd ff:ff:ff:ff:ff:ff
3: enp2s0f1: <BROADCAST,MULTICAST> mtu 1500 qdisc noop state DOWN group default qlen 1000
link/ether 00:0e:b6:5c:a9:c9 brd ff:ff:ff:ff:ff:ff
4: eno1: <BROADCAST,MULTICAST> mtu 1500 qdisc noop state DOWN group default qlen 1000
link/ether 00:0e:b6:a8:99:0a brd ff:ff:ff:ff:ff:ff
altname enp1s0f0
5: eno2: <BROADCAST,MULTICAST> mtu 1500 qdisc noop state DOWN group default qlen 1000
link/ether 00:0e:b6:a8:99:0b brd ff:ff:ff:ff:ff:ff
altname enp1s0f1
6: enp1s0f2: <BROADCAST,MULTICAST> mtu 1500 qdisc noop state DOWN group default qlen 1000
link/ether 00:0e:b6:a8:99:0c brd ff:ff:ff:ff:ff:ff
7: enp1s0f3: <BROADCAST,MULTICAST> mtu 1500 qdisc noop state DOWN group default qlen 1000
link/ether 00:0e:b6:a8:99:0d brd ff:ff:ff:ff:ff:ff
8: vmbr0: <BROADCAST,MULTICAST,UP,LOWER_UP> mtu 1500 qdisc noqueue state UP group default qlen 1000
link/ether 56:33:43:45:7e:c7 brd ff:ff:ff:ff:ff:ff
inet 10.0.1.7/16 brd 10.0.255.255 scope global vmbr0
valid_lft forever preferred_lft forever
inet6 fe80::5433:43ff:fe45:7ec7/64 scope link
valid_lft forever preferred_lft foreverroot@node8:~# ip a
1: lo: <LOOPBACK,UP,LOWER_UP> mtu 65536 qdisc noqueue state UNKNOWN group default qlen 1000
link/loopback 00:00:00:00:00:00 brd 00:00:00:00:00:00
inet 127.0.0.1/8 scope host lo
valid_lft forever preferred_lft forever
inet6 ::1/128 scope host
valid_lft forever preferred_lft forever
2: enp2s0f0: <BROADCAST,MULTICAST,UP,LOWER_UP> mtu 1500 qdisc mq master vmbr0 state UP group default qlen 1000
link/ether 00:0e:b6:44:e7:c8 brd ff:ff:ff:ff:ff:ff
3: enp2s0f1: <BROADCAST,MULTICAST> mtu 1500 qdisc noop state DOWN group default qlen 1000
link/ether 00:0e:b6:44:e7:c9 brd ff:ff:ff:ff:ff:ff
4: eno1: <BROADCAST,MULTICAST> mtu 1500 qdisc noop state DOWN group default qlen 1000
link/ether 00:0e:b6:87:bb:6a brd ff:ff:ff:ff:ff:ff
altname enp1s0f0
5: eno2: <BROADCAST,MULTICAST> mtu 1500 qdisc noop state DOWN group default qlen 1000
link/ether 00:0e:b6:87:bb:6b brd ff:ff:ff:ff:ff:ff
altname enp1s0f1
6: enp1s0f2: <BROADCAST,MULTICAST> mtu 1500 qdisc noop state DOWN group default qlen 1000
link/ether 00:0e:b6:87:bb:6c brd ff:ff:ff:ff:ff:ff
7: enp1s0f3: <BROADCAST,MULTICAST> mtu 1500 qdisc noop state DOWN group default qlen 1000
link/ether 00:0e:b6:87:bb:6d brd ff:ff:ff:ff:ff:ff
8: vmbr0: <BROADCAST,MULTICAST,UP,LOWER_UP> mtu 1500 qdisc noqueue state UP group default qlen 1000
link/ether 00:0e:b6:44:e7:c8 brd ff:ff:ff:ff:ff:ff
inet 10.0.1.8/16 scope global vmbr0
valid_lft forever preferred_lft forever
inet6 fe80::20e:b6ff:fe44:e7c8/64 scope link
valid_lft forever preferred_lft forever
root@node8:~#root@node900:~# ip a
1: lo: <LOOPBACK,UP,LOWER_UP> mtu 65536 qdisc noqueue state UNKNOWN group default qlen 1000
link/loopback 00:00:00:00:00:00 brd 00:00:00:00:00:00
inet 127.0.0.1/8 scope host lo
valid_lft forever preferred_lft forever
inet6 ::1/128 scope host
valid_lft forever preferred_lft forever
2: eno1: <BROADCAST,MULTICAST,UP,LOWER_UP> mtu 1500 qdisc mq master vmbr0 state UP group default qlen 1000
link/ether 78:2b:cb:47:98:2d brd ff:ff:ff:ff:ff:ff
altname enp1s0f0
3: eno2: <BROADCAST,MULTICAST,UP,LOWER_UP> mtu 1500 qdisc mq master vmbr1 state UP group default qlen 1000
link/ether 78:2b:cb:47:98:2e brd ff:ff:ff:ff:ff:ff
altname enp1s0f1
4: vmbr0: <BROADCAST,MULTICAST,UP,LOWER_UP> mtu 1500 qdisc noqueue state UP group default qlen 1000
link/ether 56:51:91:97:b0:64 brd ff:ff:ff:ff:ff:ff
inet 10.0.90.0/16 brd 10.0.255.255 scope global vmbr0
valid_lft forever preferred_lft forever
inet6 fe80::5451:91ff:fe97:b064/64 scope link
valid_lft forever preferred_lft forever
5: vmbr1: <BROADCAST,MULTICAST,UP,LOWER_UP> mtu 1500 qdisc noqueue state UP group default qlen 1000
link/ether ea:17:4a:2b:30:0d brd ff:ff:ff:ff:ff:ff
inet6 fe80::e817:4aff:fe2b:300d/64 scope link
valid_lft forever preferred_lft forever
root@node900:~#Not only no quorum, but status "unknown" I wouldn't exactly call that "on". Double check your screenshot, it states they are unknown which happens normally when networking has failed or worse when the software stack is encountering an issue. Additionally, not all of the configured monitors are displayed in that same screenshot of your monitors.
Ok between your managers being missing and not all of your monitors are showing in one of your screenshots, something tells me the issue is related to the software stack or networking stack. By the way, if you monitors are not working (currently the case) your OSDs won't be displayed and when CEPH stack e.g. monitors and managers are not working, the CRUSH algorithm will be halted. First verify connectivity, then try:
- What does
show for each of the ceph processes on each of the nodes? They may ask you to run journalctl for each process too. You don't have to post all of that here, but pastebin or attach TXT files might be helpful.Code:systemctl status