[SOLVED] CEPH IOPS dropped by more than 50% after upgrade from Nautilus 14.2.22 to Octopus 15.2.15

May 19, 2021
37
4
13
46
Hi,

till last Wednesday we had a cute high performing litte CEPH cluster running on PVE 6.4. Then i started the upgrade to Octopus as given in https://pve.proxmox.com/wiki/Ceph_Nautilus_to_Octopus. Since we did an online upgrade, we stopped the autoconvert with

Code:
 ceph config set osd bluestore_fsck_quick_fix_on_mount false

but followed this up step by step by restarting one OSD after the other.

Our Setup is
5 x Storage Node, each : 16 x 2.3GHz, 64GB RAM, 1 x SSD OSD 1.6TB, 1 x 7.68TB (Both WD Enterprise, SAS-12), 3 HDD OSD (10TB, SAS-12) with Optane Cache)
4 x Compute Nodes
40 GE Storage network
10 GE Cluster/Mgmt Network

Our performance before the upgrade, Ceph 14.2.22 (about 36k IOPS on the SSD Pool)

Code:
### SSD Pool on 40GE Switches
# rados bench -p SSD 30 -t 256 -b 1024 write
hints = 1
Maintaining 256 concurrent writes of 1024 bytes to objects of size 1024 for up to 30 seconds or 0 objects
...
Total time run:         30.004
Total writes made:      1094320
Write size:             1024
Object size:            1024
Bandwidth (MB/sec):     35.6177
Stddev Bandwidth:       4.71909
Max bandwidth (MB/sec): 40.7314
Min bandwidth (MB/sec): 21.3037
Average IOPS:           36472
Stddev IOPS:            4832.35
Max IOPS:               41709
Min IOPS:               21815
Average Latency(s):     0.00701759
Stddev Latency(s):      0.00854068
Max latency(s):         0.445397
Min latency(s):         0.000909089
Cleaning up (deleting benchmark objects)

Our performance after the update CEPH 15.2.15 (drops to max 17k IOPS on the SSD Pool)
Code:
# rados bench -p SSD 30 -t 256 -b 1024 write
hints = 1
Maintaining 256 concurrent writes of 1024 bytes to objects of size 1024 for up to 30 seconds or 0 objects
...
Total time run:         30.0146
Total writes made:      468513
Write size:             1024
Object size:            1024
Bandwidth (MB/sec):     15.2437
Stddev Bandwidth:       0.78677
Max bandwidth (MB/sec): 16.835
Min bandwidth (MB/sec): 13.3184
Average IOPS:           15609
Stddev IOPS:            805.652
Max IOPS:               17239
Min IOPS:               13638
Average Latency(s):     0.016396
Stddev Latency(s):      0.00777054
Max latency(s):         0.140793
Min latency(s):         0.00106735
Cleaning up (deleting benchmark objects)

What we have done so far (no success)

- reformat two of the SSD OSD's (one was still from luminos, non LVM)
- set bluestore_allocator from hybrid back to bitmap
- set osd_memory_target to 6442450944 for some of the SSD OSDs
- cpupower idle-set -D 11
- bluefs_buffered_io to true (even though i just see its not relevant for RBD)
- disabled default firewalls between CEPH nodes (for testing only)
- disabled apparmor

What we observe
- HDD Pool has similar behaviour
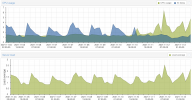
- load is higher since update, seems like more CPU consumption (see graph1), migration was on 10. Nov, around 10pm
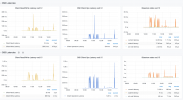
- latency on the "big" 7TB SSD's (OSD.15) is significantly higher than on the small 1.6TB SSDs (OSD.12), see graph2
- load of OSD.15 is 4 times higher than load of OSD.12 (due to the size??)
- start of OSD.15 (the 7TB SSD's is significantly slower (~10 sec) compared to the 1.6TB SSDs

Right now we are a bit helpless, any suggestions and / or does someone else has similar experiences?

Thanks,

Kai
 

Attachments

  • Screenshot 2021-11-13 at 13.55.41.png
    Screenshot 2021-11-13 at 13.55.41.png
    345.1 KB · Views: 21
  • Screenshot 2021-11-13 at 14.00.05.png
    Screenshot 2021-11-13 at 14.00.05.png
    487.9 KB · Views: 21
Last edited:
Our ceph.conf

Code:
[global]
     auth client required = cephx
     auth cluster required = cephx
     auth service required = cephx
     cluster network = xx
     fsid = aef995d0-0244-4a65-8b8a-2e75740b4cbb
     # keyring = /etc/pve/priv/$cluster.$name.keyring
     mon allow pool delete = true
     mon_max_pg_per_osd = 600
         mon_cluster_log_file_level = info
         mon_warn_pg_not_deep_scrubbed_ratio = 1.2
     osd journal size = 5120
     osd pool default min size = 2
     osd pool default size = 3
     public network = xx
         mon_host = xx

[osd]
     # keyring = /var/lib/ceph/osd/ceph-$id/keyring
     osd deep scrub interval = 1209600
     osd scrub begin hour = 19
     osd scrub end hour = 7
     osd scrub sleep = 0.1
         bluestore_allocator = bitmap
         bluefs_allocator = bitmap
         bluefs_buffered_io = true

[client]
         keyring = /etc/pve/priv/$cluster.$name.keyring

[mon.xx-ceph03]
     host = xx-ceph03
     mon addr = xx

[mon.xx-ceph04]
     host = xx-ceph04
     mon addr = xx

[mon.xx-ceph02]
     host = xx-ceph02
     mon addr = xx

[mon.xx-ceph05]
     host = xx-ceph05
     mon addr = xx

[mon.xx-ceph01]
     host = xx-ceph01
     mon addr = xx
 
you config look fine, I'm also using bitmap allocator && bluefs_buffered_io.

I remember quite the oposit when I have migrated to octopus, big boost with rbd. (writeback is working great now)

is the rados bench laucjed from the ceph storage ? if not, so you have also update ceph packages on the compute node ?
do you have tried an fio benchmark to compare ?

can you send a : #ceph osd tree && #ceph osd df ?
 
both, launched from ceph node or from compute node deliver the same result. just got a warning, that one of my ceph node ran out of swap! (still having 30GB linux fs cache free), dont know if this is related, swapoff and rados bench does not change a thing. can it be that octopus eats more ram in the default setup?

also tried to go backwards to an older kernel, but no change (saw this thread : https://forum.proxmox.com/threads/c...s-after-upgrade-from-15-2-8-to-15-2-10.87646/) and we also run completely on mellanox network equipment (40GBe though with Connect-X3 cards and vanilla drivers)

Note : OSD.17 is out on purpose

Code:
# ceph osd tree
ID   CLASS  WEIGHT     TYPE NAME            STATUS  REWEIGHT  PRI-AFF
 -1         208.94525  root default
 -3          41.43977      host xx-ceph01
  0    hdd    9.17380          osd.0            up   1.00000  1.00000
  5    hdd    9.17380          osd.5            up   1.00000  1.00000
 23    hdd   14.65039          osd.23           up   1.00000  1.00000
  7    ssd    1.45549          osd.7            up   1.00000  1.00000
 15    ssd    6.98630          osd.15           up   1.00000  1.00000
 -5          41.43977      host xx-ceph02
  1    hdd    9.17380          osd.1            up   1.00000  1.00000
  4    hdd    9.17380          osd.4            up   1.00000  1.00000
 24    hdd   14.65039          osd.24           up   1.00000  1.00000
  9    ssd    1.45549          osd.9            up   1.00000  1.00000
 20    ssd    6.98630          osd.20           up   1.00000  1.00000
 -7          41.43977      host xx-ceph03
  2    hdd    9.17380          osd.2            up   1.00000  1.00000
  3    hdd    9.17380          osd.3            up   1.00000  1.00000
 25    hdd   14.65039          osd.25           up   1.00000  1.00000
  8    ssd    1.45549          osd.8            up   1.00000  1.00000
 21    ssd    6.98630          osd.21           up   1.00000  1.00000
-17          41.43977      host xx-ceph04
 10    hdd    9.17380          osd.10           up   1.00000  1.00000
 11    hdd    9.17380          osd.11           up   1.00000  1.00000
 26    hdd   14.65039          osd.26           up   1.00000  1.00000
  6    ssd    1.45549          osd.6            up   1.00000  1.00000
 22    ssd    6.98630          osd.22           up   1.00000  1.00000
-21          43.18616      host xx-ceph05
 13    hdd    9.17380          osd.13           up   1.00000  1.00000
 14    hdd    9.17380          osd.14           up   1.00000  1.00000
 27    hdd   14.65039          osd.27           up   1.00000  1.00000
 12    ssd    1.45540          osd.12           up   1.00000  1.00000
 16    ssd    1.74660          osd.16           up   1.00000  1.00000
 17    ssd    3.49309          osd.17           up         0  1.00000
 18    ssd    1.74660          osd.18           up   1.00000  1.00000
 19    ssd    1.74649          osd.19           up   1.00000  1.00000

Code:
# ceph osd df
ID  CLASS  WEIGHT    REWEIGHT  SIZE     RAW USE  DATA     OMAP     META     AVAIL    %USE   VAR   PGS  STATUS
 0    hdd   9.17380   1.00000  9.2 TiB  2.5 TiB  2.4 TiB   28 MiB  5.0 GiB  6.6 TiB  27.56  0.96   88      up
 5    hdd   9.17380   1.00000  9.2 TiB  2.6 TiB  2.5 TiB   57 MiB  5.1 GiB  6.6 TiB  27.89  0.98   89      up
23    hdd  14.65039   1.00000   15 TiB  3.9 TiB  3.8 TiB   40 MiB  7.2 GiB   11 TiB  26.69  0.93  137      up
 7    ssd   1.45549   1.00000  1.5 TiB  634 GiB  633 GiB   33 MiB  1.8 GiB  856 GiB  42.57  1.49   64      up
15    ssd   6.98630   1.00000  7.0 TiB  2.6 TiB  2.6 TiB  118 MiB  5.9 GiB  4.4 TiB  37.70  1.32  272      up
 1    hdd   9.17380   1.00000  9.2 TiB  2.4 TiB  2.3 TiB   31 MiB  4.7 GiB  6.8 TiB  26.04  0.91   83      up
 4    hdd   9.17380   1.00000  9.2 TiB  2.6 TiB  2.5 TiB   28 MiB  5.2 GiB  6.6 TiB  28.51  1.00   91      up
24    hdd  14.65039   1.00000   15 TiB  4.0 TiB  3.9 TiB   38 MiB  7.2 GiB   11 TiB  27.06  0.95  139      up
 9    ssd   1.45549   1.00000  1.5 TiB  583 GiB  582 GiB   30 MiB  1.6 GiB  907 GiB  39.13  1.37   59      up
20    ssd   6.98630   1.00000  7.0 TiB  2.5 TiB  2.5 TiB   81 MiB  7.4 GiB  4.5 TiB  35.45  1.24  260      up
 2    hdd   9.17380   1.00000  9.2 TiB  2.4 TiB  2.3 TiB   26 MiB  4.8 GiB  6.8 TiB  26.01  0.91   83      up
 3    hdd   9.17380   1.00000  9.2 TiB  2.7 TiB  2.6 TiB   29 MiB  5.4 GiB  6.5 TiB  29.38  1.03   94      up
25    hdd  14.65039   1.00000   15 TiB  4.2 TiB  4.1 TiB   41 MiB  7.7 GiB   10 TiB  28.79  1.01  149      up
 8    ssd   1.45549   1.00000  1.5 TiB  637 GiB  635 GiB   34 MiB  1.7 GiB  854 GiB  42.71  1.49   65      up
21    ssd   6.98630   1.00000  7.0 TiB  2.5 TiB  2.5 TiB   96 MiB  7.5 GiB  4.5 TiB  35.49  1.24  260      up
10    hdd   9.17380   1.00000  9.2 TiB  2.2 TiB  2.1 TiB   26 MiB  4.5 GiB  7.0 TiB  24.21  0.85   77      up
11    hdd   9.17380   1.00000  9.2 TiB  2.5 TiB  2.4 TiB   30 MiB  5.0 GiB  6.7 TiB  27.24  0.95   87      up
26    hdd  14.65039   1.00000   15 TiB  3.6 TiB  3.5 TiB   37 MiB  6.6 GiB   11 TiB  24.64  0.86  127      up
 6    ssd   1.45549   1.00000  1.5 TiB  572 GiB  570 GiB   29 MiB  1.5 GiB  918 GiB  38.38  1.34   57      up
22    ssd   6.98630   1.00000  7.0 TiB  2.3 TiB  2.3 TiB   77 MiB  7.0 GiB  4.7 TiB  33.23  1.16  243      up
13    hdd   9.17380   1.00000  9.2 TiB  2.4 TiB  2.3 TiB   25 MiB  4.8 GiB  6.8 TiB  26.07  0.91   84      up
14    hdd   9.17380   1.00000  9.2 TiB  2.3 TiB  2.2 TiB   54 MiB  4.6 GiB  6.9 TiB  25.13  0.88   80      up
27    hdd  14.65039   1.00000   15 TiB  3.7 TiB  3.6 TiB   54 MiB  6.9 GiB   11 TiB  25.55  0.89  131      up
12    ssd   1.45540   1.00000  1.5 TiB  619 GiB  617 GiB  163 MiB  2.3 GiB  871 GiB  41.53  1.45   63      up
16    ssd   1.74660   1.00000  1.7 TiB  671 GiB  669 GiB   23 MiB  2.2 GiB  1.1 TiB  37.51  1.31   69      up
17    ssd   3.49309         0      0 B      0 B      0 B      0 B      0 B      0 B      0     0    0      up
18    ssd   1.74660   1.00000  1.7 TiB  512 GiB  509 GiB   18 MiB  2.3 GiB  1.2 TiB  28.62  1.00   52      up
19    ssd   1.74649   1.00000  1.7 TiB  709 GiB  707 GiB   64 MiB  2.0 GiB  1.1 TiB  39.64  1.39   72      up
                        TOTAL  205 TiB   59 TiB   57 TiB  1.3 GiB  128 GiB  147 TiB  28.60
MIN/MAX VAR: 0.85/1.49  STDDEV: 6.81

will give fio a try tomorrow morning..
 
Code:
128 Queues ...

root@xx-ceph01:~# fio -ioengine=rbd -direct=1 -name=test -bs=4k -iodepth=1 -rw=randwrite -pool=SSD -runtime=30 -rbdname=testimg -iodepth=128
test: (g=0): rw=randwrite, bs=(R) 4096B-4096B, (W) 4096B-4096B, (T) 4096B-4096B, ioengine=rbd, iodepth=128
fio-3.12
Starting 1 process
Jobs: 1 (f=1): [w(1)][100.0%][w=44.8MiB/s][w=11.5k IOPS][eta 00m:00s]

1 Queue ...

root@xx-ceph01:~# fio -ioengine=rbd -direct=1 -name=test -bs=4k -iodepth=1 -rw=randwrite -pool=SSD -runtime=30 -rbdname=testimg
test: (g=0): rw=randwrite, bs=(R) 4096B-4096B, (W) 4096B-4096B, (T) 4096B-4096B, ioengine=rbd, iodepth=1
fio-3.12
Starting 1 process
Jobs: 1 (f=1): [w(1)][100.0%][w=2200KiB/s][w=550 IOPS][eta 00m:00s]
 
What makes me wonder and what i can not explain is that the cluster used to be I/O bottlenecked (if i interpret it correctly) and since the update this changed. See the two example CEPH nodes below ... Updated PVE to PVE7.x two days ago, running the latest kernel, but no changes

Screenshot 2021-11-23 at 17.01.28.pngScreenshot 2021-11-23 at 17.01.47.png
 
Hello,

could it be a RAM bottleneck. I somewhere read that default "per osd buffer" increased. just a guess.
 
We observed better overall performance and lower latency after upgrading to Pacific. We had another issue during this maintenance window where memory DIMMs were marked as failed and subsequently reduced available RAM. This led us down a garden path but Pacific is outperforming our experience on Octopus, restoring what we relied on whilst running Nautilus...

Some graphs in this post:
https://forum.proxmox.com/threads/incentive-to-upgrade-ceph-to-pacific-16-2-6.97686/
 
We have approx 30GB cached, so i guess its not this. Still we will double the ram soon.

Meanwhile I am hesitating to "escape" forward to Pacific unless i found some valid reasoning for the problem...
 
We doubled our RAM but not difference. As i am starting to hunt down the bug i would like to see the PVE compile flags for CEPH or even compile it myself. Is there a guide how to rebuild the ProxMoxx packages on your own?
 
2 weeks later everything got "normal", rados bench gives these values

Code:
Total time run:         60.0139
Total writes made:      2301842
Write size:             4096
Object size:            4096
Bandwidth (MB/sec):     149.825
Stddev Bandwidth:       6.85404
Max bandwidth (MB/sec): 163.844
Min bandwidth (MB/sec): 134.137
Average IOPS:           38355
Stddev IOPS:            1754.63
Max IOPS:               41944
Min IOPS:               34339
Average Latency(s):     0.00667062
Stddev Latency(s):      0.00470653
Max latency(s):         0.0429603
Min latency(s):         0.000886471
Cleaning up (deleting benchmark objects)
Removed 2301842 objects
Clean up completed and total clean up time :59.4781

The same for a fio benchmark
Code:
# fio --rw=write --size=64G --ioengine=rbd --direct=1 --iodepth=256 --pool=SSD --rbdname=testimg --name=testimg --blocksize=4k
testimg: (g=0): rw=write, bs=(R) 4096B-4096B, (W) 4096B-4096B, (T) 4096B-4096B, ioengine=rbd, iodepth=256
fio-3.25
Starting 1 process
bs: 1 (f=1): [W(1)][21.7%][w=169MiB/s][w=43.2k IOPS][eta 05m:11s]

...

1640126688915.png

We have no clue what made the eventual change, but we optimized our system by

- pushing RAM to 128 GB
- disabling write cache on the SSDs on boot time (they are PowerLoss / SuperCap'd)
- splitting the 7TB SSD's into multiple OSD's using ceph-volume lvm batch --osds-per-device 4 /dev/sdX

Still we don't believe, this was the real problem. Rather some background jobs, such as a still ongoing OMAP conversion, an unfinished compaction or similar but unfortunately it did not really became clear...

Closing this ticket, thanks for the help!
 
Last edited:
Some more investigation reveals, that since the day(s) we split our 7TB SSD's into 4 OSD's (around Dec 8th), the latencies on this OSD's dropped significantly and never spiked again, so we can at least say, that this solved our issue. What caused the high latencies on these drives after the update to Octopus is not clear to us.

The Graph shows OSD15 which was a single 7TB drive OSD and is now an 1.7TB partition on the same drive. The last spike is our 4k IOPS test.

1640128239049.png
 
I have same problem with:
Code:
# ceph --version
ceph version 16.2.7 (f9aa029788115b5df5eeee328f584156565ee5b7) pacific (stable)

8 nodes (CPU 2xEPYC 64 cores/RAM 2TB/Eth 2x10Gbit/s LACP), fresh install pve 7.1
2 nvme SSDPE2KE076T8 7.68TB per node used for CEPH, each nvme device splitted on 4 pices by nvme namespacing per 1.92TB (4K formatted)

Code:
# rados bench -p bench 30 -t 256 -b 1024 write
hints = 1
Maintaining 256 concurrent writes of 1024 bytes to objects of size 1024 for up to 30 seconds or 0 objects
...
Total time run:         31.7774
Total writes made:      446888
Write size:             1024
Object size:            1024
Bandwidth (MB/sec):     13.7335
Stddev Bandwidth:       3.07327
Max bandwidth (MB/sec): 17.707
Min bandwidth (MB/sec): 0.00585938
Average IOPS:           14063
Stddev IOPS:            3147.03
Max IOPS:               18132
Min IOPS:               6
Average Latency(s):     0.0175379
Stddev Latency(s):      0.0747707
Max latency(s):         7.80775
Min latency(s):         0.000653032
Cleaning up (deleting benchmark objects)
Removed 446888 objects
Clean up completed and total clean up time :31.5444
 
Last edited:
Hi Alibek,

I would say, that after 3-4 weeks pulling my hair out, the cluster came back to normal operation speed.

We actually never really figured out what the problem was but our feeling is, that the reconstruction of the OMAP data structures took quite some time in. the background. We also recreated several of the OSD's and also (as you did) split up our 7.68 TB SSD's into 4 OSD's each, which in fact rebuild the data forcibly on these OSD's.

Don't know if it is relevant but we have ~40TB of raw SSD storage so our SSD pool is 1/3 of yours in size.

Please also note, that we still run on CEPH 15.2.16 not on 16.x. Hope that helps.
 
  • Like
Reactions: Alibek
Hi FXKai!

Can you explain next, please:
1) which switch using in your cluster?
2) mellanox drivers from pve or installed expetialy?
3) do you use dpdk?
 
1.) We use 2 x Mellanox SX1012 with 40GE QSFP+ and MLAG (before we used 2 x Lenovo GE8124E on MLAG with 10GE QSFP, similar performance).
Note : both switches, the Lenovo and the SX1012 are cut-through switches
2.) default Linux/PVE driver with Mellanox 40GE CX-354 QSFP+
3.) no Intel DPDK running

Our cluster can achieve around 38k IOPS in this setup. I guess using Mellanox drivers and DPDK might give you another 10%.

One thing which you must check is your NUMA set, the EPYC's are much more split then our Intel Servers and you want to make sure, that the the OSD's and the NIC's can run on the same numa node. Otherwise you might encounter strong memory access time penalties
 
@FXKai thx!
Our network stack: Cisco Nexus 3172 (with n9k firmware) with Intel 82599ES

CPU NUMA on 2xAMD EPYC 7702 64-Core Processor:
Code:
NUMA node0 CPU(s):               0-63,128-191
NUMA node1 CPU(s):               64-127,192-255
 
@FXKai thx!
Our network stack: Cisco Nexus 3172 (with n9k firmware) with Intel 82599ES

CPU NUMA on 2xAMD EPYC 7702 64-Core Processor:
Code:
NUMA node0 CPU(s):               0-63,128-191
NUMA node1 CPU(s):               64-127,192-255

For the Nexus, i dont know which exact Model you have but one of the faster ones, a 3172PQ seems to be around 850ns, other models might be (significantly) slower, but you will need to google this. The Lenovo switch I mentioned above is around 570ns, while the Mellanox goes down to 270ns for 10GbE or even 220ns for 40GbE. This affects only the IOPS.

Can you please for one of the EPYC nodes send the output of

numactl --hardware
 
@FXKai
Code:
# numactl --hardware
available: 2 nodes (0-1)
node 0 cpus: 0 1 2 3 4 5 6 7 8 9 10 11 12 13 14 15 16 17 18 19 20 21 22 23 24 25 26 27 28 29 30 31 32 33 34 35 36 37 38 39 40 41 42 43 44 45 46 47 48 49 50 51 52 53 54 55 56 57 58 59 60 61 62 63 128 129 130 131 132 133 134 135 136 137 138 139 140 141 142 143 144 145 146 147 148 149 150 151 152 153 154 155 156 157 158 159 160 161 162 163 164 165 166 167 168 169 170 171 172 173 174 175 176 177 178 179 180 181 182 183 184 185 186 187 188 189 190 191
node 0 size: 1019855 MB
node 0 free: 960229 MB
node 1 cpus: 64 65 66 67 68 69 70 71 72 73 74 75 76 77 78 79 80 81 82 83 84 85 86 87 88 89 90 91 92 93 94 95 96 97 98 99 100 101 102 103 104 105 106 107 108 109 110 111 112 113 114 115 116 117 118 119 120 121 122 123 124 125 126 127 192 193 194 195 196 197 198 199 200 201 202 203 204 205 206 207 208 209 210 211 212 213 214 215 216 217 218 219 220 221 222 223 224 225 226 227 228 229 230 231 232 233 234 235 236 237 238 239 240 241 242 243 244 245 246 247 248 249 250 251 252 253 254 255
node 1 size: 1032111 MB
node 1 free: 995332 MB
node distances:
node   0   1
  0:  10  32
  1:  32  10
 

About

The Proxmox community has been around for many years and offers help and support for Proxmox VE, Proxmox Backup Server, and Proxmox Mail Gateway.
We think our community is one of the best thanks to people like you!

Get your subscription!

The Proxmox team works very hard to make sure you are running the best software and getting stable updates and security enhancements, as well as quick enterprise support. Tens of thousands of happy customers have a Proxmox subscription. Get yours easily in our online shop.

Buy now!