10 Gigabit slow speed down to 3 Gbit . Warum ?

Proxmoxbeginner30

New Member
Mar 18, 2022
24
1
3
31
Hallo an alle Netzwerk und Proxmox Experten, folgendes ist passiert:
Ich habe meinen Proxmox Home Server ein stromsparendes Upgrade gegönnt.
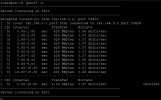
Nachdem ich diesen zusammengebaut hatte, die Mellanox Connect X2 Single Port Karte (Server) wieder mit meinem Hauptsystem Debian 11 Bullseye über ein SFP+ DAC Kabel ordnungsgemäß miteinander verbunden habe, zeigt er mir beim ersten Test mit iperf3 zwischen beiden 10,9 an, aktuell leider nur noch 3,7. Intern von VM zu Proxmox passt alles, aber das Hauptproblem besteht zwischen den beiden Systemen, die direkt ohne Switch verbunden sind. MTU habe ich auf beiden Systemen Jumbo Frames eingestellt entspricht 9000 An welcher Einstellung kann es liegen ?
Freue mich über hilfreiche Vorschläge

Systemkomponenten Server:
CPU = Intel i3 6100
RAM = Kingston Fury DDR 4 8GB
MB = Gigabyte Q170M - D3H
System = Proxmox 7.2-7
Netzteil = Compat Power 550W
HDD = 2x 1TB NAS Platten
SSD: 2x Crucial MX 500GB und 1x Emtec X 150 120GB
Netzwerk: Mellanox Connect X2
Intel Gigabit LAN

Debian 11.3 (Bullseye) Desktop Rechner keine VM!
CPU = Intel i5 7400
RAM = Kingston Fury DDR4 8GB
MB: = Asus Prime B250
Netzteil = Cooler Master 550W
GPU: Nvidia GTX 660ti
Netzwerk = Intel Gigabit Lan
Mellanox Connect X2


Code:
Linux pve 5.15.39-3-pve #2 SMP PVE 5.15.39-3 (Wed, 27 Jul 2022 13:45:39 +0200) x86_64

The programs included with the Debian GNU/Linux system are free software;
the exact distribution terms for each program are described in the
individual files in /usr/share/doc/*/copyright.

Debian GNU/Linux comes with ABSOLUTELY NO WARRANTY, to the extent
permitted by applicable law.
Last login: Fri Aug  5 10:59:24 CEST 2022 on pts/0
root@pve:~# cat /etc/network/interfaces
# network interface settings; autogenerated
# Please do NOT modify this file directly, unless you know what
# you're doing.
#
# If you want to manage parts of the network configuration manually,
# please utilize the 'source' or 'source-directory' directives to do
# so.
# PVE will preserve these directives, but will NOT read its network
# configuration from sourced files, so do not attempt to move any of
# the PVE managed interfaces into external files!

auto lo
iface lo inet loopback

auto enp0s31f6
iface enp0s31f6 inet manual
        mtu 9000

auto enp1s0
iface enp1s0 inet manual
        mtu 9000

auto vmbr0
iface vmbr0 inet static
        address 192.168.188.55/24
        gateway 192.168.188.1
        bridge-ports enp0s31f6
        bridge-stp off
        bridge-fd 0

auto vmbr1
iface vmbr1 inet static
        address 192.168.5.1/24
        bridge-ports enp1s0
        bridge-stp off
        bridge-fd 0
        mtu 9000
 

Attachments

  • Screenshot 2022-08-01 at 16-43-50 pve - Proxmox Console.png
    Screenshot 2022-08-01 at 16-43-50 pve - Proxmox Console.png
    38.3 KB · Views: 22
Last edited:
Verstehe ich das richtig? Zwischen Proxmox VE Server und Desktop direkt bekommst du ~10 Gbit zusammen, aber zwischen einer VM auf dem Proxmox VE Server und dem Desktop nur noch knapp 4Gbit?

Kannst du die Config der VM posten?
Code:
qm config <vmid>
 
Hallo Aaron, leider ist es genau umgekehrt. Zwischen VM und Proxmox VE bekomme ich sogar bis zu 15,7 GBytes.

Nextcloud Container zu VM 15,5GBytes. Nextcloud Container zu Proxmox VE 63,3 Gbytes. Alle Tests mit Iperf3.
Zwischen Proxmox VE Server und Desktop direkt bekomme ich 4.16 GBytes statt 10,9 . VM zum Desktop Rechner genauso langsam.
Kabel getauscht hatte ich gestern, gleiches Ergebnis, demnach muss Kabel ok sein. Zu wenig RAM ?
 
Last edited:
Okay, dass innerhalb der Proxmox VE Servers sehr viel bessere Werte herauskommen, wundert mich nicht. Hier ist praktisch nur die CPU und der RAM das Limit.
Das heißt jegliche physische Verbindung über das 10Gbit Netz zum Desktop schafft nur ~4Gbit? Egal ob aus der VM, Container oder vom PVE Host selbst?


IIUC haben Server wie Desktop Mellanox Karten?

Ich würde dir auf jeden Fall raten, falls noch nicht passiert, die Firmware auf den Mellanox NICs zu aktualisieren. Das geht erstaunlich einfach. Unter https://network.nvidia.com/support/firmware/mlxup-mft/ Linux->x64 auswählen, dann das "mlxup" herunterladen. Den sha256 Hash am besten noch vergleichen (sha256sum mlxup). Dann das Binary ausführbar machen (chmod +x mlxup) und ausführen (./mlxup).
Die NIC sollte erkannt werden und auch ob es neue Firmware gibt.
Evtl. hilft das schon.
Ansonsten könnte man mal schauen was ip a sagt. Ob da bei dem vmbr bzw. der physischen NIC viele Fehler geloggt werden.
 
Ja beide haben eine Mellanox Connect x2 Karte verbaut, und das Problem besteht lediglich über die physische Verbindung. Werde mal schauen ob es ein Firmware Update gibt. mlxup findet meine Karte nicht, zumindest nicht automatisch, was muss ich in der >Konsole eingeben damit es funktioniert.


Code:
Querying Mellanox devices firmware ...


Device #1:

----------


  Device Type:      N/A

  Part Number:      --

  Description:     

  PSID:           

  PCI Device Name:  enp1s0

  Port1 MAC:        N/A

  Port1 GUID:       N/A

  Port2 MAC:        N/A

  Port2 GUID:       N/A

  Versions:         Current        Available   

     FW             --                         


  Status:           Failed to open device


---------

-E- Failed to query enp1s0 device, error : No such file or directory. MFE_CR_ERROR

Anbei meine log Dateien
 

Attachments

  • messages.zip
    635.7 KB · Views: 0
Last edited:
Hmm, habe selbst keine Erfahrung mit ConnectX-2 Karten. Evtl. sind sie auch schon zu alt: https://network.nvidia.com/support/firmware/firmware-downloads/ Hier werden sie zB nicht mehr gelistet.
Google findet noch die Seite https://network.nvidia.com/support/firmware/connectx2en/ mit dem manuelleren Prozess und die neueste Firmware für die meisten Varianten scheint vom Mai 2012 zu sein.
Abgesehen davon eben mal ip -details -statistics addr anschauen ob es viele dropped packets gibt.
Iperf3 hat auch noch die `--verbose` / `-V` Option die mitunter mehr Details liefert, welche vielleicht Aufschluss geben könnten wieso nicht die volle Bandbreite erreicht wird.
 
Das ergibt sich mit Iperf -s -d
Code:
root@pve:~# iperf3 -s -d
-----------------------------------------------------------
Server listening on 5201
-----------------------------------------------------------
get_parameters:
{
        "tcp":  true,
        "omit": 0,
        "time": 10,
        "parallel":     1,
        "len":  131072,
        "pacing_timer": 1000,
        "client_version":       "3.9"
}
SNDBUF is 16384, expecting 0
RCVBUF is 131072, expecting 0
Accepted connection from 192.168.5.2, port 34078
Congestion algorithm is cubic
[  5] local 192.168.5.1 port 5201 connected to 192.168.5.2 port 34094
tcpi_snd_cwnd 10 tcpi_snd_mss 8948 tcpi_rtt 54
interval_len 1.000016 bytes_transferred 446227896
interval forces keep
[ ID] Interval           Transfer     Bitrate
[  5]   0.00-1.00   sec   426 MBytes  3.57 Gbits/sec                 
tcpi_snd_cwnd 10 tcpi_snd_mss 8948 tcpi_rtt 54
interval_len 0.999991 bytes_transferred 446916808
interval forces keep
[  5]   1.00-2.00   sec   426 MBytes  3.58 Gbits/sec                 
tcpi_snd_cwnd 10 tcpi_snd_mss 8948 tcpi_rtt 54
interval_len 1.000000 bytes_transferred 446907860
interval forces keep
[  5]   2.00-3.00   sec   426 MBytes  3.58 Gbits/sec                 
tcpi_snd_cwnd 10 tcpi_snd_mss 8948 tcpi_rtt 54
interval_len 1.000025 bytes_transferred 446898912
interval forces keep
[  5]   3.00-4.00   sec   426 MBytes  3.58 Gbits/sec                 
tcpi_snd_cwnd 10 tcpi_snd_mss 8948 tcpi_rtt 54
interval_len 0.999982 bytes_transferred 446215372
interval forces keep
[  5]   4.00-5.00   sec   426 MBytes  3.57 Gbits/sec                 
tcpi_snd_cwnd 10 tcpi_snd_mss 8948 tcpi_rtt 54
interval_len 0.999989 bytes_transferred 446737848
interval forces keep
[  5]   5.00-6.00   sec   426 MBytes  3.57 Gbits/sec                 
tcpi_snd_cwnd 10 tcpi_snd_mss 8948 tcpi_rtt 54
interval_len 1.000001 bytes_transferred 446791536
interval forces keep
[  5]   6.00-7.00   sec   426 MBytes  3.57 Gbits/sec                 
tcpi_snd_cwnd 10 tcpi_snd_mss 8948 tcpi_rtt 54
interval_len 1.000005 bytes_transferred 446362032
interval forces keep
[  5]   7.00-8.00   sec   426 MBytes  3.57 Gbits/sec                 
tcpi_snd_cwnd 10 tcpi_snd_mss 8948 tcpi_rtt 54
interval_len 0.999996 bytes_transferred 446702056
interval forces keep
[  5]   8.00-9.00   sec   426 MBytes  3.57 Gbits/sec                 
tcpi_snd_cwnd 10 tcpi_snd_mss 8948 tcpi_rtt 54
interval_len 0.999997 bytes_transferred 446657316
interval forces keep
[  5]   9.00-10.00  sec   426 MBytes  3.57 Gbits/sec                 
tcpi_snd_cwnd 10 tcpi_snd_mss 8948 tcpi_rtt 54
interval_len 0.001610 bytes_transferred 715840
interval forces keep
[  5]  10.00-10.00  sec   699 KBytes  3.56 Gbits/sec                 
- - - - - - - - - - - - - - - - - - - - - - - - -
[ ID] Interval           Transfer     Bitrate
[  5]   0.00-10.00  sec  4.16 GBytes  3.57 Gbits/sec                  receiver
get_results
{
        "cpu_util_total":       12.837460778160494,
        "cpu_util_user":        0.37761736360057335,
        "cpu_util_system":      12.459823419994445,
        "sender_has_retransmits":       1,
        "congestion_used":      "cubic",
        "streams":      [{
                        "id":   1,
                        "bytes":        4470339268,
                        "retransmits":  0,
                        "jitter":       0,
                        "errors":       0,
                        "packets":      0,
                        "start_time":   0,
                        "end_time":     10.000079
                }]
}
send_results
{
        "cpu_util_total":       11.671047035344667,
        "cpu_util_user":        1.2214589337730488,
        "cpu_util_system":      10.449588101571619,
        "sender_has_retransmits":       -1,
        "congestion_used":      "cubic",
        "streams":      [{
                        "id":   1,
                        "bytes":        4467133476,
                        "retransmits":  -1,
                        "jitter":       0,
                        "errors":       0,
                        "packets":      0,
                        "start_time":   0,
                        "end_time":     10.001612
                }]
}
 
Last edited:
Code:
3: enp1s0: <BROADCAST,MULTICAST,UP,LOWER_UP> mtu 9000 qdisc mq master vmbr1 state UP group default qlen 1000
    link/ether 00:02:c9:53:03:1e brd ff:ff:ff:ff:ff:ff promiscuity 1 minmtu 68 maxmtu 9600
    bridge_slave state forwarding priority 32 cost 2 hairpin off guard off root_block off fastleave off learning on flood on port_id 0x8001 port_no 0x1 designated_port 32769 designated_cost 0 designated_bridge 8000.0:2:c9:53:3:1e designated_root 8000.0:2:c9:53:3:1e hold_timer    0.00 message_age_timer    0.00 forward_delay_timer    0.00 topology_change_ack 0 config_pending 0 proxy_arp off proxy_arp_wifi off mcast_router 1 mcast_fast_leave off mcast_flood on mcast_to_unicast off neigh_suppress off group_fwd_mask 0 group_fwd_mask_str 0x0 vlan_tunnel off isolated off numtxqueues 256 numrxqueues 128 gso_max_size 65536 gso_max_segs 65535 portid 0002c9030053031e
    RX: bytes  packets  errors  dropped missed  mcast   
    31508831404 3495794  0       0       0       75     
    TX: bytes  packets  errors  dropped carrier collsns
    112808084  1709085  0       0       0       0

Gibt keine dropped packets. Ich versteh das nicht, wieso immer 4.16Gbytes statt 10,9GBytes. Vllt. doch CPU oder RAM ?
 
Probier bitte mal mehrere Streams nebeneinander, also iperf mit -P
z.B. 2 und 4

Dann auch mal in die andere Richtung, also einmal Desktop als iperf-Server, einmal den Proxmox als Iperf-Server.

Meine Vermutung ist, dass der i3-6100 durch Interrupts ans Limit kommt (iperf ist singlethreaded). Die 4.16 GBytes ergeben sich aus der langsamen Bandbreite - Iperf3 läuft per default 10 Sekunden.
 
Last edited:
  • Like
Reactions: aaron

About

The Proxmox community has been around for many years and offers help and support for Proxmox VE, Proxmox Backup Server, and Proxmox Mail Gateway.
We think our community is one of the best thanks to people like you!

Get your subscription!

The Proxmox team works very hard to make sure you are running the best software and getting stable updates and security enhancements, as well as quick enterprise support. Tens of thousands of happy customers have a Proxmox subscription. Get yours easily in our online shop.

Buy now!