Sorry for the late answer. We went back to 6.17.13-19-pve, since we still hitting the same problems on newer 7.x as you are.Any news about this ?


You are using an out of date browser. It may not display this or other websites correctly.
You should upgrade or use an alternative browser.
You should upgrade or use an alternative browser.
Upgraded to proxmox 9.2.10 on Sunday September the 6th.
Have had two downtimes of a host because of that since.
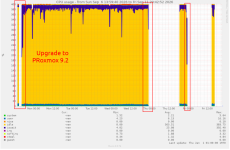
Both downtimes occurred during the Proxmox Backup of some other machines which places an extra burden on the physical disks. And in the second case I had to revert to the last Backup because the filesystem was irrecoverably damaged due to the IO-Error.
It might get some more easily reproducible when the fio check from here https://forum.proxmox.com/threads/i...system-xfs-shutdown.184360/page-2#post-858168 is done during some extra stress on the host.
This virtual machine affected is a Debian 13 with a 6.12.107+deb13-amd64 #1 SMP PREEMPT_DYNAMIC Debian 6.12.107-1 (2026-08-29) x86_64 GNU/Linux Kernel.
Have had two downtimes of a host because of that since.
Both downtimes occurred during the Proxmox Backup of some other machines which places an extra burden on the physical disks. And in the second case I had to revert to the last Backup because the filesystem was irrecoverably damaged due to the IO-Error.
It might get some more easily reproducible when the fio check from here https://forum.proxmox.com/threads/i...system-xfs-shutdown.184360/page-2#post-858168 is done during some extra stress on the host.
This virtual machine affected is a Debian 13 with a 6.12.107+deb13-amd64 #1 SMP PREEMPT_DYNAMIC Debian 6.12.107-1 (2026-08-29) x86_64 GNU/Linux Kernel.
Had another died guest today. Luckily no disk failure this time. But a died guest is not too good either. This crash here occurred during a vzdump backup. The two other disk failures too.
The chain of events were commonly:
* vzdump starts copying VM YYYYYYYY
* QEMU writes the VMA stream to CIFS
* CIFS/netfs writeback and SMB3 encryption/transformation consume memory
* Host allocation and/or CIFS latency becomes extreme
* QEMU cannot complete the backup-start QMP operation
* VM vCPU scheduling/timer progress stalls
* Guest RCU stall and NMI
* QMP timeout and backup abort
* Guest is dead.
The Proxmox host had in its kern.log:
And the died guest today logged this one:
The other two crashes had no logs in the guest as the file system was readonly.
The chain of events were commonly:
* vzdump starts copying VM YYYYYYYY
* QEMU writes the VMA stream to CIFS
* CIFS/netfs writeback and SMB3 encryption/transformation consume memory
* Host allocation and/or CIFS latency becomes extreme
* QEMU cannot complete the backup-start QMP operation
* VM vCPU scheduling/timer progress stalls
* Guest RCU stall and NMI
* QMP timeout and backup abort
* Guest is dead.
The Proxmox host had in its kern.log:
Code:
2026-09-12T23:13:36.559556+02:00 xxxxxx kernel: Workqueue: writeback wb_workfn (flush-cifs-1)
2026-09-12T23:13:36.559557+02:00 xxxxxx kernel: Call Trace:
2026-09-12T23:13:36.559558+02:00 xxxxxx kernel:  <TASK>
2026-09-12T23:13:36.559558+02:00 xxxxxx kernel:  dump_stack_lvl+0x5f/0x90
2026-09-12T23:13:36.559559+02:00 xxxxxx kernel:  dump_stack+0x10/0x18
2026-09-12T23:13:36.559575+02:00 xxxxxx kernel:  warn_alloc+0x171/0x190
2026-09-12T23:13:36.559577+02:00 xxxxxx kernel:  ? psi_task_change+0xfb/0x110
2026-09-12T23:13:36.559577+02:00 xxxxxx kernel:  __alloc_frozen_pages_noprof+0xd69/0x1700
2026-09-12T23:13:36.559577+02:00 xxxxxx kernel:  ? policy_nodemask+0x111/0x190
2026-09-12T23:13:36.559578+02:00 xxxxxx kernel:  alloc_pages_mpol+0x80/0x180
2026-09-12T23:13:36.559578+02:00 xxxxxx kernel:  folio_alloc_noprof+0x5b/0xc0
2026-09-12T23:13:36.559579+02:00 xxxxxx kernel:  netfs_alloc_folioq_buffer+0x157/0x230 [netfs]
2026-09-12T23:13:36.559584+02:00 xxxxxx kernel:  smb3_init_transform_rq+0xf3/0x3f0 [cifs]
2026-09-12T23:13:36.559585+02:00 xxxxxx kernel:  smb_send_rqst+0xe3/0x260 [cifs]
2026-09-12T23:13:36.559586+02:00 xxxxxx kernel:  cifs_call_async+0x175/0x340 [cifs]
2026-09-12T23:13:36.559586+02:00 xxxxxx kernel:  ? __pfx_smb2_writev_callback+0x10/0x10 [cifs]
2026-09-12T23:13:36.559587+02:00 xxxxxx kernel:  smb2_async_writev+0x3bc/0x770 [cifs]
2026-09-12T23:13:36.559587+02:00 xxxxxx kernel:  ? asm_common_interrupt+0x27/0x40
2026-09-12T23:13:36.559589+02:00 xxxxxx kernel:  cifs_issue_write+0x83/0x250 [cifs]
2026-09-12T23:13:36.559590+02:00 xxxxxx kernel:  ? __pfx_smb2_async_writev+0x10/0x10 [cifs]
2026-09-12T23:13:36.559590+02:00 xxxxxx kernel:  ? cifs_issue_write+0x83/0x250 [cifs]
2026-09-12T23:13:36.559591+02:00 xxxxxx kernel:  netfs_do_issue_write+0x3d/0xe0 [netfs]
2026-09-12T23:13:36.559591+02:00 xxxxxx kernel:  netfs_advance_write+0x108/0x160 [netfs]
2026-09-12T23:13:36.559592+02:00 xxxxxx kernel:  ? rolling_buffer_append+0x4d/0xf0 [netfs]
2026-09-12T23:13:36.559594+02:00 xxxxxx kernel:  netfs_write_folio+0x293/0x890 [netfs]
2026-09-12T23:13:36.559594+02:00 xxxxxx kernel:  netfs_writepages+0x11c/0x420 [netfs]
2026-09-12T23:13:36.559595+02:00 xxxxxx kernel:  do_writepages+0xc4/0x180
2026-09-12T23:13:36.559595+02:00 xxxxxx kernel:  __writeback_single_inode+0x45/0x340
2026-09-12T23:13:36.559596+02:00 xxxxxx kernel:  writeback_sb_inodes+0x26b/0x5f0
2026-09-12T23:13:36.559596+02:00 xxxxxx kernel:  __writeback_inodes_wb+0x54/0x100
2026-09-12T23:13:36.559597+02:00 xxxxxx kernel:  ? queue_io+0x86/0x170
2026-09-12T23:13:36.559607+02:00 xxxxxx kernel:  wb_writeback+0x1a1/0x360
2026-09-12T23:13:36.559611+02:00 xxxxxx kernel:  wb_workfn+0x38a/0x450
2026-09-12T23:13:36.559612+02:00 xxxxxx kernel:  process_one_work+0x1a9/0x3c0
2026-09-12T23:13:36.559612+02:00 xxxxxx kernel:  worker_thread+0x1b8/0x360
2026-09-12T23:13:36.559613+02:00 xxxxxx kernel:  ? __pfx_worker_thread+0x10/0x10
2026-09-12T23:13:36.559613+02:00 xxxxxx kernel:  kthread+0xf7/0x130
2026-09-12T23:13:36.559619+02:00 xxxxxx kernel:  ? __pfx_kthread+0x10/0x10
2026-09-12T23:13:36.559620+02:00 xxxxxx kernel:  ret_from_fork+0x2da/0x3a0
2026-09-12T23:13:36.559620+02:00 xxxxxx kernel:  ? __pfx_kthread+0x10/0x10
2026-09-12T23:13:36.559620+02:00 xxxxxx kernel:  ret_from_fork_asm+0x1a/0x30
2026-09-12T23:13:36.559621+02:00 xxxxxx kernel:  </TASK>
2026-09-12T23:13:36.559621+02:00 xxxxxx kernel: Mem-Info:
2026-09-12T23:13:36.559629+02:00 xxxxxx kernel: active_anon:11446324 inactive_anon:32556703 isolated_anon:0
2026-09-12T23:13:36.559639+02:00 xxxxxx kernel:  active_file:18949 inactive_file:19266066 isolated_file:0
2026-09-12T23:13:36.559644+02:00 xxxxxx kernel:  unevictable:40394 dirty:323249 writeback:2927
2026-09-12T23:13:36.559644+02:00 xxxxxx kernel:  slab_reclaimable:239019 slab_unreclaimable:112057
2026-09-12T23:13:36.559645+02:00 xxxxxx kernel:  mapped:62857 shmem:43646 pagetables:93623
2026-09-12T23:13:36.559645+02:00 xxxxxx kernel:  sec_pagetables:14703 bounce:0
2026-09-12T23:13:36.559646+02:00 xxxxxx kernel:  kernel_misc_reclaimable:0
2026-09-12T23:13:36.559652+02:00 xxxxxx kernel:  free:2009542 free_pcp:221 free_cma:744157
2026-09-12T23:13:36.560892+02:00 xxxxxx kernel: Node 0 active_anon:45785296kB inactive_anon:130226812kB active_file:75796kB inactive_file:77061540kB unevictable:161576kB isolated(anon):0kB isolated(file):0kB mapped:251428kB dirty:1292996kB writeback:11708kB shmem:174584kB shm>
2026-09-12T23:13:36.560899+02:00 xxxxxx kernel: Node 0 DMA free:11264kB boost:0kB min:4kB low:16kB high:28kB reserved_highatomic:0KB free_highatomic:0KB active_anon:0kB inactive_anon:0kB active_file:0kB inactive_file:0kB unevictable:0kB writepending:0kB zspages:0kB present:15>
2026-09-12T23:13:36.560901+02:00 xxxxxx kernel: lowmem_reserve[]: 0 1851 257609 257609 257609
2026-09-12T23:13:36.560902+02:00 xxxxxx kernel: Node 0 DMA32 free:1025080kB boost:0kB min:416kB low:1928kB high:3440kB reserved_highatomic:0KB free_highatomic:0KB active_anon:204800kB inactive_anon:534528kB active_file:0kB inactive_file:124672kB unevictable:0kB writepending:0>
2026-09-12T23:13:36.560902+02:00 xxxxxx kernel: lowmem_reserve[]: 0 0 255757 255757 255757
2026-09-12T23:13:36.560903+02:00 xxxxxx kernel: Node 0 Normal free:7011276kB boost:0kB min:67160kB low:311476kB high:555792kB reserved_highatomic:0KB free_highatomic:0KB active_anon:45580496kB inactive_anon:129692284kB active_file:75796kB inactive_file:76929884kB unevictable:>
2026-09-12T23:13:36.560908+02:00 xxxxxx kernel: lowmem_reserve[]: 0 0 0 0 0
2026-09-12T23:13:36.562796+02:00 xxxxxx kernel: Node 0 DMA: 0*4kB 0*8kB 0*16kB 0*32kB 0*64kB 0*128kB 0*256kB 0*512kB 1*1024kB (U) 1*2048kB (M) 2*4096kB (M) = 11264kB
2026-09-12T23:13:36.562806+02:00 xxxxxx kernel: Node 0 DMA32: 12*4kB (U) 15*8kB (UM) 59*16kB (UE) 33*32kB (UME) 23*64kB (UME) 18*128kB (UME) 17*256kB (UM) 28*512kB (UM) 21*1024kB (UME) 8*2048kB (UMEC) 235*4096kB (UMC) = 1025080kB
2026-09-12T23:13:36.562808+02:00 xxxxxx kernel: Node 0 Normal: 266109*4kB (UMC) 112487*8kB (UMEC) 15947*16kB (UMEC) 16573*32kB (UMEC) 9365*64kB (UMEC) 4255*128kB (UMEC) 1725*256kB (UMC) 2568*512kB (UMC) 1342*1024kB (UMC) 0*2048kB 0*4096kB = 7024444kB
2026-09-12T23:13:36.562808+02:00 xxxxxx kernel: Node 0 hugepages_total=0 hugepages_free=0 hugepages_surp=0 hugepages_size=1048576kB
2026-09-12T23:13:36.562809+02:00 xxxxxx kernel: Node 0 hugepages_total=0 hugepages_free=0 hugepages_surp=0 hugepages_size=2048kB
2026-09-12T23:13:36.562810+02:00 xxxxxx kernel: 19326974 total pagecache pages
2026-09-12T23:13:36.562810+02:00 xxxxxx kernel: 0 pages in swap cache
2026-09-12T23:13:36.563773+02:00 xxxxxx kernel: Free swap  = 0kB
2026-09-12T23:13:36.563782+02:00 xxxxxx kernel: Total swap = 0kB
2026-09-12T23:13:36.563783+02:00 xxxxxx kernel: 67079063 pages RAM
2026-09-12T23:13:36.563784+02:00 xxxxxx kernel: 0 pages HighMem/MovableOnly
2026-09-12T23:13:36.563785+02:00 xxxxxx kernel: 1127080 pages reserved
2026-09-12T23:13:36.563786+02:00 xxxxxx kernel: 0 pages cma reserved
2026-09-12T23:13:36.563787+02:00 xxxxxx kernel: 0 pages hwpoisoned
2026-09-12T23:14:00.917845+02:00 xxxxxx kernel: Memory cgroup min protection 0kB -- low protection 0kB
And the died guest today logged this one:
Code:
2026-09-12T23:21:56.661516+02:00 YYYYYYYY kernel: rcu: INFO: rcu_preempt detected stalls on CPUs/tasks:
2026-09-12T23:21:56.661536+02:00 YYYYYYYY kernel: rcu:     3-...0: (78 ticks this GP) idle=e2a4/1/0x4000000000000000 softirq=7751336/7751336 fqs=1005
2026-09-12T23:21:56.661537+02:00 YYYYYYYY kernel: rcu:     (detected by 2, t=5256 jiffies, g=17314457, q=94 ncpus=4)
2026-09-12T23:21:56.661538+02:00 YYYYYYYY kernel: Sending NMI from CPU 2 to CPUs 3:
2026-09-12T23:21:56.661538+02:00 YYYYYYYY kernel: rcu: rcu_preempt kthread starved for 2475 jiffies! g17314457 f0x0 RCU_GP_DOING_FQS(6) ->state=0x0 ->cpu=1
2026-09-12T23:21:56.661539+02:00 YYYYYYYY kernel: rcu:     Unless rcu_preempt kthread gets sufficient CPU time, OOM is now expected behavior.
2026-09-12T23:21:56.661539+02:00 YYYYYYYY kernel: rcu: RCU grace-period kthread stack dump:
2026-09-12T23:21:56.661542+02:00 YYYYYYYY kernel: task:rcu_preempt     state:I stack:0     pid:18    tgid:18    ppid:2      flags:0x00004000
2026-09-12T23:21:56.661543+02:00 YYYYYYYY kernel: Call Trace:
2026-09-12T23:21:56.661543+02:00 YYYYYYYY kernel:  <TASK>
2026-09-12T23:21:56.661543+02:00 YYYYYYYY kernel:  __schedule+0x505/0xc00
2026-09-12T23:21:56.661544+02:00 YYYYYYYY kernel:  ? __pfx_rcu_gp_kthread+0x10/0x10
2026-09-12T23:21:56.661544+02:00 YYYYYYYY kernel:  schedule+0x27/0xc0
2026-09-12T23:21:56.661545+02:00 YYYYYYYY kernel:  schedule_timeout+0x9e/0x160
2026-09-12T23:21:56.661545+02:00 YYYYYYYY kernel:  ? __pfx_process_timeout+0x10/0x10
2026-09-12T23:21:56.661546+02:00 YYYYYYYY kernel:  rcu_gp_fqs_loop+0x10b/0x530
2026-09-12T23:21:56.661546+02:00 YYYYYYYY kernel:  rcu_gp_kthread+0xdc/0x1a0
2026-09-12T23:21:56.661546+02:00 YYYYYYYY kernel:  kthread+0xd2/0x100
2026-09-12T23:21:56.661547+02:00 YYYYYYYY kernel:  ? __pfx_kthread+0x10/0x10
2026-09-12T23:21:56.661547+02:00 YYYYYYYY kernel:  ret_from_fork+0x34/0x50
2026-09-12T23:21:56.661548+02:00 YYYYYYYY kernel:  ? __pfx_kthread+0x10/0x10
2026-09-12T23:21:56.661548+02:00 YYYYYYYY kernel:  ret_from_fork_asm+0x1a/0x30
2026-09-12T23:21:56.661548+02:00 YYYYYYYY kernel:  </TASK>
2026-09-12T23:21:56.661549+02:00 YYYYYYYY kernel: rcu: Stack dump where RCU GP kthread last ran:
2026-09-12T23:21:56.661549+02:00 YYYYYYYY kernel: Sending NMI from CPU 2 to CPUs 1:
2026-09-12T23:21:56.661550+02:00 YYYYYYYY kernel: NMI backtrace for cpu 1
2026-09-12T23:21:56.661550+02:00 YYYYYYYY kernel: CPU: 1 UID: 0 PID: 0 Comm: swapper/1 Tainted: G             L     6.12.107+deb13-amd64 #1  Debian 6.12.107-1
2026-09-12T23:21:56.661551+02:00 YYYYYYYY kernel: Tainted: [L]=SOFTLOCKUP
2026-09-12T23:21:56.661551+02:00 YYYYYYYY kernel: Hardware name: QEMU Standard PC (i440FX + PIIX, 1996), BIOS rel-1.17.0-0-gb52ca86e094d-prebuilt.qemu.org 04/01/2014
2026-09-12T23:21:56.661552+02:00 YYYYYYYY kernel: RIP: 0010:pv_native_safe_halt+0xf/0x20
2026-09-12T23:21:56.661552+02:00 YYYYYYYY kernel: Code: 09 e9 95 0d 01 00 0f 1f 44 00 00 90 90 90 90 90 90 90 90 90 90 90 90 90 90 90 90 f3 0f 1e fa eb 07 0f 00 2d f5 77 30 00 fb f4 <c3> cc cc cc cc 66 66 2e 0f 1f 84 00 00 00 00 00 90 90 90 90 90 90
2026-09-12T23:21:56.661553+02:00 YYYYYYYY kernel: RSP: 0018:ffffd3ab400c3ed8 EFLAGS: 00000212
2026-09-12T23:21:56.661554+02:00 YYYYYYYY kernel: RAX: 0000000000000001 RBX: 0000000000000000 RCX: 0000000000000000
2026-09-12T23:21:56.661554+02:00 YYYYYYYY kernel: RDX: 0000000000000000 RSI: 0000000000000000 RDI: 000000001f3b0bbc
2026-09-12T23:21:56.661554+02:00 YYYYYYYY kernel: RBP: ffff8c4440356100 R08: 0000000000000001 R09: 0000000000000001
2026-09-12T23:21:56.661555+02:00 YYYYYYYY kernel: R10: 0000000000000001 R11: 0000000000000001 R12: 0000000000000001
2026-09-12T23:21:56.661555+02:00 YYYYYYYY kernel: R13: 0000000000000000 R14: 0000000000000000 R15: 0000000000000000
2026-09-12T23:21:56.661556+02:00 YYYYYYYY kernel: FS:  0000000000000000(0000) GS:ffff8c447bc80000(0000) knlGS:0000000000000000
2026-09-12T23:21:56.661556+02:00 YYYYYYYY kernel: CS:  0010 DS: 0000 ES: 0000 CR0: 0000000080050033
2026-09-12T23:21:56.661556+02:00 YYYYYYYY kernel: CR2: 000000c000425000 CR3: 000000011d662000 CR4: 00000000000006f0
2026-09-12T23:21:56.661574+02:00 YYYYYYYY kernel: Call Trace:
2026-09-12T23:21:56.661574+02:00 YYYYYYYY kernel:  <TASK>
2026-09-12T23:21:56.661575+02:00 YYYYYYYY kernel:  default_idle+0x9/0x20
2026-09-12T23:21:56.661575+02:00 YYYYYYYY kernel:  default_idle_call+0x29/0x100
2026-09-12T23:21:56.661576+02:00 YYYYYYYY kernel:  do_idle+0x269/0x2a0
2026-09-12T23:21:56.661576+02:00 YYYYYYYY kernel:  cpu_startup_entry+0x29/0x30
2026-09-12T23:21:56.661576+02:00 YYYYYYYY kernel:  start_secondary+0x11e/0x140
2026-09-12T23:21:56.661577+02:00 YYYYYYYY kernel:  common_startup_64+0x13e/0x141
2026-09-12T23:21:56.661577+02:00 YYYYYYYY kernel:  </TASK>
2026-09-12T23:22:31.260126+02:00 YYYYYYYY kernel: Uhhuh. NMI received for unknown reason 30 on CPU 3.
2026-09-12T23:22:31.260169+02:00 YYYYYYYY kernel: Dazed and confused, but trying to continue
The other two crashes had no logs in the guest as the file system was readonly.

Hi @fiona,
thanks for your swift reply.
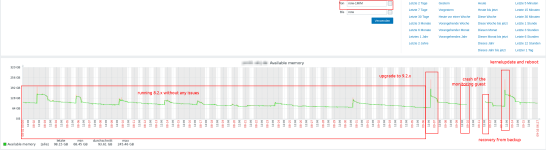
Being not sure which logs from the system describe the memory situation over time I'm just sharing charts from the Zabbix and Munin monitoring over one month.
I've patched and rebooted the node into to the latest kernel 7.0.14-15-pve #1 SMP PREEMPT_DYNAMIC PMX 7.0.14-15 (2026-08-26T14:21Z) x86_64 GNU/Linux on Sunday September 13th pretty much right after the second crash. The system is running without any issues since.
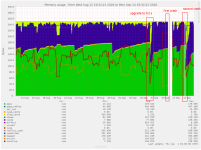
A second chart of the same node has more information about the kinds memory usage but with less granularity. Note that "second crash" and "kernelupdate and reboot" are quite narrow together in this timeframe.
And a zoomed in chart from munin depicting a closer view to the memory situation during the second crash:
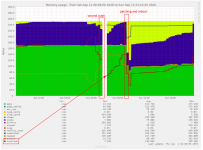
And yes - you're right: The kernel log of the node suggests a tight memory situation during the write of an smb buffer during the vzdump. But I fail to see that from the charts. Except the "inactive" pool falling quite rapidly during right before the second crash.
thanks for your swift reply.
Being not sure which logs from the system describe the memory situation over time I'm just sharing charts from the Zabbix and Munin monitoring over one month.
I've patched and rebooted the node into to the latest kernel 7.0.14-15-pve #1 SMP PREEMPT_DYNAMIC PMX 7.0.14-15 (2026-08-26T14:21Z) x86_64 GNU/Linux on Sunday September 13th pretty much right after the second crash. The system is running without any issues since.
A second chart of the same node has more information about the kinds memory usage but with less granularity. Note that "second crash" and "kernelupdate and reboot" are quite narrow together in this timeframe.
And a zoomed in chart from munin depicting a closer view to the memory situation during the second crash:
And yes - you're right: The kernel log of the node suggests a tight memory situation during the write of an smb buffer during the vzdump. But I fail to see that from the charts. Except the "inactive" pool falling quite rapidly during right before the second crash.
Last edited:
Did I say "no issues since the kernel patching"?
Seems like I stay corrected.
dmesg -T this morning shows:
The guest did not crash this time, but has some serious kernel logs too:
Seems like I stay corrected.
dmesg -T this morning shows:
Code:
[Tue Sep 15 23:06:58 2026] kworker/u48:17: page allocation failure: order:9, mode:0x40c40(GFP_NOFS|__GFP_COMP), nodemask=(null),cpuset=/,mems_allowed=0
[Tue Sep 15 23:06:58 2026] CPU: 5 UID: 0 PID: 2046827 Comm: kworker/u48:17 Tainted: P           O        7.0.14-15-pve #1 PREEMPT(lazy)
[Tue Sep 15 23:06:58 2026] Tainted: [P]=PROPRIETARY_MODULE, [O]=OOT_MODULE
[Tue Sep 15 23:06:58 2026] Hardware name: ASUSTeK COMPUTER INC. Z10PA-U8 Series/Z10PA-U8 Series, BIOS 3801 05/13/2020
[Tue Sep 15 23:06:58 2026] Workqueue: writeback wb_workfn (flush-cifs-1)
[Tue Sep 15 23:06:58 2026] Call Trace:
[Tue Sep 15 23:06:58 2026]  <TASK>
[Tue Sep 15 23:06:58 2026]  dump_stack_lvl+0x5f/0x90
[Tue Sep 15 23:06:58 2026]  dump_stack+0x10/0x18
[Tue Sep 15 23:06:58 2026]  warn_alloc+0x171/0x190
[Tue Sep 15 23:06:58 2026]  ? psi_task_change+0xfb/0x110
[Tue Sep 15 23:06:58 2026]  __alloc_frozen_pages_noprof+0xd69/0x1700
[Tue Sep 15 23:06:58 2026]  ? resched_curr_lazy+0x29/0x40
[Tue Sep 15 23:06:58 2026]  ? wakeup_preempt_fair+0x180/0x430
[Tue Sep 15 23:06:58 2026]  ? policy_nodemask+0x111/0x190
[Tue Sep 15 23:06:58 2026]  alloc_pages_mpol+0x80/0x180
[Tue Sep 15 23:06:58 2026]  folio_alloc_noprof+0x5b/0xc0
[Tue Sep 15 23:06:58 2026]  netfs_alloc_folioq_buffer+0x157/0x230 [netfs]
[Tue Sep 15 23:06:58 2026]  smb3_init_transform_rq+0xf3/0x3f0 [cifs]
[Tue Sep 15 23:06:58 2026]  ? barn_replace_empty_sheaf+0xc0/0x130
[Tue Sep 15 23:06:58 2026]  smb_send_rqst+0xe3/0x260 [cifs]
[Tue Sep 15 23:06:58 2026]  ? bio_associate_blkg_from_css+0xcc/0x350
[Tue Sep 15 23:06:58 2026]  cifs_call_async+0x175/0x340 [cifs]
[Tue Sep 15 23:06:58 2026]  ? __pfx_smb2_writev_callback+0x10/0x10 [cifs]
[Tue Sep 15 23:06:58 2026]  smb2_async_writev+0x3bc/0x770 [cifs]
[Tue Sep 15 23:06:58 2026]  cifs_issue_write+0x83/0x250 [cifs]
[Tue Sep 15 23:06:58 2026]  ? __pfx_smb2_async_writev+0x10/0x10 [cifs]
[Tue Sep 15 23:06:58 2026]  ? cifs_issue_write+0x83/0x250 [cifs]
[Tue Sep 15 23:06:58 2026]  netfs_do_issue_write+0x3d/0xe0 [netfs]
[Tue Sep 15 23:06:58 2026]  netfs_advance_write+0x108/0x160 [netfs]
[Tue Sep 15 23:06:58 2026]  ? rolling_buffer_append+0x4d/0xf0 [netfs]
[Tue Sep 15 23:06:58 2026]  netfs_write_folio+0x293/0x890 [netfs]
[Tue Sep 15 23:06:58 2026]  netfs_writepages+0x11c/0x480 [netfs]
[Tue Sep 15 23:06:58 2026]  do_writepages+0xc4/0x180
[Tue Sep 15 23:06:58 2026]  __writeback_single_inode+0x45/0x340
[Tue Sep 15 23:06:58 2026]  writeback_sb_inodes+0x26b/0x5f0
[Tue Sep 15 23:06:58 2026]  __writeback_inodes_wb+0x54/0x100
[Tue Sep 15 23:06:58 2026]  ? queue_io+0x86/0x170
[Tue Sep 15 23:06:58 2026]  wb_writeback+0x1a1/0x360
[Tue Sep 15 23:06:58 2026]  wb_workfn+0x38a/0x450
[Tue Sep 15 23:06:58 2026]  process_one_work+0x1a9/0x3c0
[Tue Sep 15 23:06:58 2026]  worker_thread+0x1b8/0x360
[Tue Sep 15 23:06:58 2026]  ? __pfx_worker_thread+0x10/0x10
[Tue Sep 15 23:06:58 2026]  kthread+0xf7/0x130
[Tue Sep 15 23:06:58 2026]  ? __pfx_kthread+0x10/0x10
[Tue Sep 15 23:06:58 2026]  ret_from_fork+0x2da/0x3a0
[Tue Sep 15 23:06:58 2026]  ? __pfx_kthread+0x10/0x10
[Tue Sep 15 23:06:58 2026]  ret_from_fork_asm+0x1a/0x30
[Tue Sep 15 23:06:58 2026]  </TASK>
[Tue Sep 15 23:06:58 2026] Mem-Info:
[Tue Sep 15 23:06:58 2026] active_anon:7514393 inactive_anon:31280251 isolated_anon:0
                            active_file:25797 inactive_file:26061574 isolated_file:0
                            unevictable:40342 dirty:312781 writeback:1442
                            slab_reclaimable:196639 slab_unreclaimable:111280
                            mapped:57403 shmem:32739 pagetables:83424
                            sec_pagetables:11741 bounce:0
                            kernel_misc_reclaimable:0
                            free:478455 free_pcp:1150 free_cma:132888
[Tue Sep 15 23:06:58 2026] Node 0 active_anon:30057960kB inactive_anon:125121004kB active_file:103188kB inactive_file:104243968kB unevictable:161368kB isolated(anon):0kB isolated(file):0kB mapped:229612kB dirty:1251124kB writeback:5768kB shmem:130956kB shmem_thp:0kB shmem_pmdmapped:0kB anon_thp:153161728kB kernel_stack:11408kB pagetables:333696kB sec_pagetables:46964kB all_unreclaimable? no Balloon:0kB
[Tue Sep 15 23:06:58 2026] Node 0 DMA free:11264kB boost:0kB min:4kB low:16kB high:28kB reserved_highatomic:0KB free_highatomic:0KB active_anon:0kB inactive_anon:0kB active_file:0kB inactive_file:0kB unevictable:0kB writepending:0kB zspages:0kB present:15988kB managed:15360kB mlocked:0kB bounce:0kB free_pcp:0kB local_pcp:0kB free_cma:0kB
[Tue Sep 15 23:06:58 2026] lowmem_reserve[]: 0 1851 257609 257609 257609
[Tue Sep 15 23:06:58 2026] Node 0 DMA32 free:1024912kB boost:0kB min:416kB low:1928kB high:3440kB reserved_highatomic:0KB free_highatomic:0KB active_anon:16384kB inactive_anon:8256kB active_file:0kB inactive_file:838704kB unevictable:0kB writepending:29984kB zspages:0kB present:1961960kB managed:1896424kB mlocked:0kB bounce:0kB free_pcp:0kB local_pcp:0kB free_cma:299008kB
[Tue Sep 15 23:06:58 2026] lowmem_reserve[]: 0 0 255757 255757 255757
[Tue Sep 15 23:06:58 2026] Node 0 Normal free:885408kB boost:0kB min:67160kB low:311476kB high:555792kB reserved_highatomic:0KB free_highatomic:0KB active_anon:30043172kB inactive_anon:125112748kB active_file:103188kB inactive_file:103390340kB unevictable:161368kB writepending:1227116kB zspages:0kB present:266338304kB managed:261896148kB mlocked:161368kB bounce:0kB free_pcp:11288kB local_pcp:0kB free_cma:232544kB
[Tue Sep 15 23:06:58 2026] lowmem_reserve[]: 0 0 0 0 0
[Tue Sep 15 23:06:58 2026] Node 0 DMA: 0*4kB 0*8kB 0*16kB 0*32kB 0*64kB 0*128kB 0*256kB 0*512kB 1*1024kB (U) 1*2048kB (M) 2*4096kB (M) = 11264kB
[Tue Sep 15 23:06:58 2026] Node 0 DMA32: 48*4kB (UM) 62*8kB (UM) 60*16kB (UME) 59*32kB (UME) 45*64kB (UE) 39*128kB (UM) 31*256kB (UM) 28*512kB (UE) 16*1024kB (UE) 12*2048kB (UMEC) 232*4096kB (UMC) = 1024912kB
[Tue Sep 15 23:06:58 2026] Node 0 Normal: 36866*4kB (UMEC) 52783*8kB (UMEC) 18665*16kB (UMEC) 436*32kB (UME) 20*64kB (U) 2*128kB (ME) 0*256kB 0*512kB 0*1024kB 4*2048kB (MC) 0*4096kB = 892048kB
[Tue Sep 15 23:06:58 2026] Node 0 hugepages_total=0 hugepages_free=0 hugepages_surp=0 hugepages_size=1048576kB
[Tue Sep 15 23:06:58 2026] Node 0 hugepages_total=0 hugepages_free=0 hugepages_surp=0 hugepages_size=2048kB
[Tue Sep 15 23:06:58 2026] 26118814 total pagecache pages
[Tue Sep 15 23:06:58 2026] 0 pages in swap cache
[Tue Sep 15 23:06:58 2026] Free swap  = 0kB
[Tue Sep 15 23:06:58 2026] Total swap = 0kB
[Tue Sep 15 23:06:58 2026] 67079063 pages RAM
[Tue Sep 15 23:06:58 2026] 0 pages HighMem/MovableOnly
[Tue Sep 15 23:06:58 2026] 1127080 pages reserved
[Tue Sep 15 23:06:58 2026] 0 pages cma reserved
[Tue Sep 15 23:06:58 2026] 0 pages hwpoisoned
[Tue Sep 15 23:06:58 2026] Memory cgroup min protection 0kB -- low protection 0kB
The guest did not crash this time, but has some serious kernel logs too:
Code:
[Di Sep 15 23:21:22 2026] rcu: INFO: rcu_preempt detected stalls on CPUs/tasks:
[Di Sep 15 23:21:22 2026] rcu:     2-...0: (54 ticks this GP) idle=db14/1/0x4000000000000000 softirq=7026774/7026775 fqs=1051
[Di Sep 15 23:21:22 2026] rcu:     (detected by 1, t=5254 jiffies, g=15080501, q=204 ncpus=4)
[Di Sep 15 23:21:22 2026] Sending NMI from CPU 1 to CPUs 2:
[Di Sep 15 23:21:32 2026] rcu: rcu_preempt kthread starved for 2475 jiffies! g15080501 f0x0 RCU_GP_DOING_FQS(6) ->state=0x0 ->cpu=3
[Di Sep 15 23:21:32 2026] rcu:     Unless rcu_preempt kthread gets sufficient CPU time, OOM is now expected behavior.
[Di Sep 15 23:21:32 2026] rcu: RCU grace-period kthread stack dump:
[Di Sep 15 23:21:32 2026] task:rcu_preempt     state:I stack:0     pid:18    tgid:18    ppid:2      flags:0x00004000
[Di Sep 15 23:21:32 2026] Call Trace:
[Di Sep 15 23:21:32 2026]  <TASK>
[Di Sep 15 23:21:32 2026]  __schedule+0x505/0xc00
[Di Sep 15 23:21:32 2026]  ? __pfx_rcu_gp_kthread+0x10/0x10
[Di Sep 15 23:21:32 2026]  schedule+0x27/0xc0
[Di Sep 15 23:21:32 2026]  schedule_timeout+0x9e/0x160
[Di Sep 15 23:21:32 2026]  ? __pfx_process_timeout+0x10/0x10
[Di Sep 15 23:21:32 2026]  rcu_gp_fqs_loop+0x10b/0x530
[Di Sep 15 23:21:32 2026]  rcu_gp_kthread+0xdc/0x1a0
[Di Sep 15 23:21:32 2026]  kthread+0xd2/0x100
[Di Sep 15 23:21:32 2026]  ? __pfx_kthread+0x10/0x10
[Di Sep 15 23:21:32 2026]  ret_from_fork+0x34/0x50
[Di Sep 15 23:21:32 2026]  ? __pfx_kthread+0x10/0x10
[Di Sep 15 23:21:32 2026]  ret_from_fork_asm+0x1a/0x30
[Di Sep 15 23:21:32 2026]  </TASK>
[Di Sep 15 23:21:32 2026] rcu: Stack dump where RCU GP kthread last ran:
[Di Sep 15 23:21:32 2026] Sending NMI from CPU 1 to CPUs 3:
[Di Sep 15 23:21:32 2026] NMI backtrace for cpu 3
[Di Sep 15 23:21:32 2026] CPU: 3 UID: 0 PID: 0 Comm: swapper/3 Not tainted 6.12.107+deb13-amd64 #1  Debian 6.12.107-1
[Di Sep 15 23:21:32 2026] Hardware name: QEMU Standard PC (i440FX + PIIX, 1996), BIOS rel-1.17.0-0-gb52ca86e094d-prebuilt.qemu.org 04/01/2014
[Di Sep 15 23:21:32 2026] RIP: 0010:pv_native_safe_halt+0xf/0x20
[Di Sep 15 23:21:32 2026] Code: 09 e9 95 0d 01 00 0f 1f 44 00 00 90 90 90 90 90 90 90 90 90 90 90 90 90 90 90 90 f3 0f 1e fa eb 07 0f 00 2d f5 77 30 00 fb f4 <c3> cc cc cc cc 66 66 2e 0f 1f 84 00 00 00 00 00 90 90 90 90 90 90
[Di Sep 15 23:21:32 2026] RSP: 0018:ffffca45800d3ed8 EFLAGS: 00000206
[Di Sep 15 23:21:32 2026] RAX: 0000000000000003 RBX: 0000000000000000 RCX: ffff88f086f994e8
[Di Sep 15 23:21:32 2026] RDX: 0000000000000000 RSI: 0000000000000003 RDI: 00000000229ca764
[Di Sep 15 23:21:32 2026] RBP: ffff88f080356100 R08: 0000000000000001 R09: 0000000000000001
[Di Sep 15 23:21:32 2026] R10: 0000000000000003 R11: 0000000000000001 R12: 0000000000000003
[Di Sep 15 23:21:32 2026] R13: 0000000000000000 R14: 0000000000000000 R15: 0000000000000000
[Di Sep 15 23:21:32 2026] FS:  0000000000000000(0000) GS:ffff88f0bbd80000(0000) knlGS:0000000000000000
[Di Sep 15 23:21:32 2026] CS:  0010 DS: 0000 ES: 0000 CR0: 0000000080050033
[Di Sep 15 23:21:32 2026] CR2: 000000c000433000 CR3: 000000010222a000 CR4: 00000000000006f0
[Di Sep 15 23:21:32 2026] Call Trace:
[Di Sep 15 23:21:32 2026]  <TASK>
[Di Sep 15 23:21:32 2026]  default_idle+0x9/0x20
[Di Sep 15 23:21:32 2026]  default_idle_call+0x29/0x100
[Di Sep 15 23:21:32 2026]  do_idle+0x269/0x2a0
[Di Sep 15 23:21:32 2026]  cpu_startup_entry+0x29/0x30
[Di Sep 15 23:21:32 2026]  start_secondary+0x11e/0x140
[Di Sep 15 23:21:32 2026]  common_startup_64+0x13e/0x141
[Di Sep 15 23:21:32 2026]  </TASK>
[Di Sep 15 23:21:56 2026] watchdog: BUG: soft lockup - CPU#1 stuck for 48s! [khugepaged:57]
[Di Sep 15 23:21:56 2026] Modules linked in: binfmt_misc ext4 crc16 mbcache jbd2 bochs button drm_vram_helper vga16fb drm_ttm_helper vgastate ttm virtio_balloon pcspkr drm_kms_helper joydev evdev sg drm configfs efi_pstore nfnetlink vsock_loopback vmw_vsock_virtio_transport_common vmw_vsock_vmci_transport vsock vmw_vmci qemu_fw_cfg ip_tables x_tables autofs4 xfs libcrc32c crc32c_generic dm_mod hid_generic usbhid hid sr_mod cdrom ata_generic ata_piix sd_mod libata uhci_hcd ehci_pci ehci_hcd virtio_scsi psmouse scsi_mod usbcore i2c_piix4 virtio_net serio_raw net_failover usb_common failover scsi_common i2c_smbus floppy
[Di Sep 15 23:21:56 2026] CPU: 1 UID: 0 PID: 57 Comm: khugepaged Not tainted 6.12.107+deb13-amd64 #1  Debian 6.12.107-1
[Di Sep 15 23:21:56 2026] Hardware name: QEMU Standard PC (i440FX + PIIX, 1996), BIOS rel-1.17.0-0-gb52ca86e094d-prebuilt.qemu.org 04/01/2014
[Di Sep 15 23:21:56 2026] RIP: 0010:smp_call_function_many_cond+0x345/0x4c0
[Di Sep 15 23:21:56 2026] Code: e8 80 5a 4d 00 3b 05 ba 19 ca 01 0f 83 e1 fd ff ff 48 63 d0 49 8b 34 24 48 03 34 d5 20 9e 1f 9b 8b 56 08 83 e2 01 74 0a f3 90 <8b> 4e 08 83 e1 01 75 f6 83 c0 01 eb bb 65 8b 05 93 fc 26 66 48 0f
[Di Sep 15 23:21:56 2026] RSP: 0018:ffffca45801efc18 EFLAGS: 00000202
[Di Sep 15 23:21:56 2026] RAX: 0000000000000002 RBX: 0000000000000000 RCX: 0000000000000001
[Di Sep 15 23:21:56 2026] RDX: 0000000000000001 RSI: ffff88f0bbd3d180 RDI: 0000000000000002
[Di Sep 15 23:21:56 2026] RBP: 0000000000000000 R08: ffff88f080054d30 R09: 0000000000000000
[Di Sep 15 23:21:56 2026] R10: 0000000000000000 R11: 0000000000000000 R12: ffff88f0bbcb7300
[Di Sep 15 23:21:56 2026] R13: ffff88f080054078 R14: 0000000000000001 R15: 0000000000000003
[Di Sep 15 23:21:56 2026] FS:  0000000000000000(0000) GS:ffff88f0bbc80000(0000) knlGS:0000000000000000
[Di Sep 15 23:21:56 2026] CS:  0010 DS: 0000 ES: 0000 CR0: 0000000080050033
[Di Sep 15 23:21:56 2026] CR2: 000000c0004fd07c CR3: 000000010348e000 CR4: 00000000000006f0
[Di Sep 15 23:21:56 2026] Call Trace:
[Di Sep 15 23:21:56 2026]  <TASK>
[Di Sep 15 23:21:56 2026]  ? __pfx_tlb_remove_table_smp_sync+0x10/0x10
[Di Sep 15 23:21:56 2026]  smp_call_function+0x2c/0x50
[Di Sep 15 23:21:56 2026]  collapse_huge_page+0x4b3/0x13c0
[Di Sep 15 23:21:56 2026]  hpage_collapse_scan_pmd+0x60e/0x6f0
[Di Sep 15 23:21:56 2026]  khugepaged+0x6c7/0x940
[Di Sep 15 23:21:56 2026]  ? __pfx_khugepaged+0x10/0x10
[Di Sep 15 23:21:56 2026]  kthread+0xd2/0x100
[Di Sep 15 23:21:56 2026]  ? __pfx_kthread+0x10/0x10
[Di Sep 15 23:21:56 2026]  ret_from_fork+0x34/0x50
[Di Sep 15 23:21:56 2026]  ? __pfx_kthread+0x10/0x10
[Di Sep 15 23:21:56 2026]  ret_from_fork_asm+0x1a/0x30
[Di Sep 15 23:21:56 2026]  </TASK>
[Di Sep 15 23:22:15 2026] Uhhuh. NMI received for unknown reason 20 on CPU 2.
[Di Sep 15 23:22:15 2026] Dazed and confused, but trying to continue
[Di Sep 15 23:22:15 2026] clocksource: Long readout interval, skipping watchdog check: cs_nsec: 72757318380 wd_nsec: 72757296446The original issue in this post has been identified and fixed in kernel
7.0.14-19. More info here: https://bugzilla.proxmox.com/show_bug.cgi?id=7734