[SOLVED] IO-Trouble wit zfs-mirror on pve7.2 (5.15.39-1-pve) - BUG: soft lockup inside VMs

udo

Distinguished Member
Apr 22, 2009
5,975
196
163
Ahrensburg; Germany
Hi,
last week I moved VMs to an fresh installed new cluster-node, but it's don't run well. Most of the VMs has massive trouble to do IO.
After migrating all VM-Disks to ceph (local-zfs before) the VMs work.

The big quesiton is, where are the issue? Host-Kernel?

The system is an Dell R6515 with 48 x AMD EPYC 7402P 24-Core Processor, 384GB Ram, actual Bios 2.7.3 and following pve-version:
Code:
proxmox-ve: 7.2-1 (running kernel: 5.15.39-1-pve)
pve-manager: 7.2-7 (running version: 7.2-7/d0dd0e85)
pve-kernel-5.15: 7.2-6
pve-kernel-helper: 7.2-6
pve-kernel-5.13: 7.1-9
pve-kernel-5.15.39-1-pve: 5.15.39-1
pve-kernel-5.13.19-6-pve: 5.13.19-15
pve-kernel-5.13.19-2-pve: 5.13.19-4
ceph-fuse: 15.2.16-pve1
corosync: 3.1.5-pve2
criu: 3.15-1+pve-1
glusterfs-client: 9.2-1
ifupdown2: 3.1.0-1+pmx3
ksm-control-daemon: 1.4-1
libjs-extjs: 7.0.0-1
libknet1: 1.24-pve1
libproxmox-acme-perl: 1.4.2
libproxmox-backup-qemu0: 1.3.1-1
libpve-access-control: 7.2-4
libpve-apiclient-perl: 3.2-1
libpve-common-perl: 7.2-2
libpve-guest-common-perl: 4.1-2
libpve-http-server-perl: 4.1-3
libpve-storage-perl: 7.2-7
libspice-server1: 0.14.3-2.1
lvm2: 2.03.11-2.1
lxc-pve: 5.0.0-3
lxcfs: 4.0.12-pve1
novnc-pve: 1.3.0-3
openvswitch-switch: 2.15.0+ds1-2+deb11u1
proxmox-backup-client: 2.2.5-1
proxmox-backup-file-restore: 2.2.5-1
proxmox-mini-journalreader: 1.3-1
proxmox-widget-toolkit: 3.5.1
pve-cluster: 7.2-2
pve-container: 4.2-2
pve-docs: 7.2-2
pve-edk2-firmware: 3.20210831-2
pve-firewall: 4.2-5
pve-firmware: 3.5-1
pve-ha-manager: 3.4.0
pve-i18n: 2.7-2
pve-qemu-kvm: 6.2.0-11
pve-xtermjs: 4.16.0-1
qemu-server: 7.2-3
smartmontools: 7.2-pve3
spiceterm: 3.2-2
swtpm: 0.7.1~bpo11+1
vncterm: 1.7-1
zfsutils-linux: 2.1.4-pve1
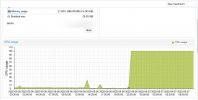
The zfs mem is limited
Code:
cat /etc/modprobe.d/zfs.conf 
options zfs zfs_arc_min=16106127360
options zfs zfs_arc_max=17179869184
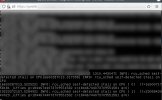
Error inside client (there are different io related errors on different clients):
Code:
Aug  2 20:55:53 vdb01 kernel: [19672.059835] watchdog: BUG: soft lockup - CPU#0 stuck for 34s! [swapper/0:0]
Aug  2 20:55:53 vdb01 kernel: [19672.061236] Modules linked in: edac_mce_amd input_leds joydev serio_raw shpchp qemu_fw_cfg mac_hid sch_fq_codel sunrpc ib_iser rdma_cm iw_cm ib_cm i
b_core iscsi_tcp libiscsi_tcp libiscsi scsi_transport_iscsi ip_tables x_tables autofs4 btrfs zstd_compress raid10 raid456 async_raid6_recov async_memcpy async_pq async_xor async_tx xor rai
d6_pq libcrc32c raid1 raid0 multipath linear pcbc bochs_drm ttm aesni_intel drm_kms_helper aes_x86_64 crypto_simd glue_helper cryptd syscopyarea sysfillrect sysimgblt psmouse virtio_net vi
rtio_scsi fb_sys_fops drm i2c_piix4 pata_acpi floppy
Aug  2 20:55:53 vdb01 kernel: [19672.061266] CPU: 0 PID: 0 Comm: swapper/0 Tainted: G             L   4.15.0-176-generic #185-Ubuntu
Aug  2 20:55:53 vdb01 kernel: [19672.061267] Hardware name: QEMU Standard PC (i440FX + PIIX, 1996), BIOS rel-1.15.0-0-g2dd4b9b3f840-prebuilt.qemu.org 04/01/2014
Aug  2 20:55:53 vdb01 kernel: [19672.061274] RIP: 0010:native_safe_halt+0x12/0x20
Aug  2 20:55:53 vdb01 kernel: [19672.061275] RSP: 0018:ffffffffa0e03e28 EFLAGS: 00000246 ORIG_RAX: ffffffffffffff11
Aug  2 20:55:53 vdb01 kernel: [19672.061276] RAX: ffffffffa03d0a50 RBX: 0000000000000000 RCX: 0000000000000000
Aug  2 20:55:53 vdb01 kernel: [19672.061277] RDX: 0000000000000000 RSI: 0000000000000000 RDI: 0000000000000000
Aug  2 20:55:53 vdb01 kernel: [19672.061278] RBP: ffffffffa0e03e28 R08: 0000000000000002 R09: ffffb2344124fe30
Aug  2 20:55:53 vdb01 kernel: [19672.061278] R10: 0000000000000005 R11: 0000000000000000 R12: 0000000000000000
Aug  2 20:55:53 vdb01 kernel: [19672.061279] R13: 0000000000000000 R14: 0000000000000000 R15: 0000000000000000
Aug  2 20:55:53 vdb01 kernel: [19672.061282] FS:  0000000000000000(0000) GS:ffff9f7f7fc00000(0000) knlGS:0000000000000000
Aug  2 20:55:53 vdb01 kernel: [19672.061282] CS:  0010 DS: 0000 ES: 0000 CR0: 0000000080050033
Aug  2 20:55:53 vdb01 kernel: [19672.061283] CR2: 00007f85fee92180 CR3: 0000000231a1e000 CR4: 00000000000006f0
Aug  2 20:55:53 vdb01 kernel: [19672.061287] Call Trace:
Aug  2 20:55:53 vdb01 kernel: [19672.061291]  default_idle+0x20/0x100
Aug  2 20:55:53 vdb01 kernel: [19672.061295]  arch_cpu_idle+0x15/0x20
Aug  2 20:55:53 vdb01 kernel: [19672.061296]  default_idle_call+0x23/0x30
Aug  2 20:55:53 vdb01 kernel: [19672.061299]  do_idle+0x172/0x1f0
Aug  2 20:55:53 vdb01 kernel: [19672.061300]  cpu_startup_entry+0x73/0x80
Aug  2 20:55:53 vdb01 kernel: [19672.061303]  rest_init+0xae/0xb0
Aug  2 20:55:53 vdb01 kernel: [19672.061306]  start_kernel+0x4dc/0x500
Aug  2 20:55:53 vdb01 kernel: [19672.061308]  x86_64_start_reservations+0x24/0x26
Aug  2 20:55:53 vdb01 kernel: [19672.061309]  x86_64_start_kernel+0x74/0x77
Aug  2 20:55:53 vdb01 kernel: [19672.061312]  secondary_startup_64+0xa5/0xb0
Aug  2 20:55:53 vdb01 kernel: [19672.061313] Code: 00 3e 80 48 02 20 48 8b 00 a8 08 0f 84 7b ff ff ff eb bd 90 90 90 90 90 90 55 48 89 e5 e9 07 00 00 00 0f 00 2d 00 90 43 00 fb f4 <
5d> c3 66 90 66 2e 0f 1f 84 00 00 00 00 00 55 48 89 e5 e9 07 00 
Aug  2 20:58:58 vdb01 kernel: [19857.455318] INFO: rcu_sched self-detected stall on CPU
Aug  2 20:58:58 vdb01 kernel: [19857.456302]     0-...!: (1 ticks this GP) idle=91e/1/0 softirq=1110456/1110456 fqs=0 
Aug  2 20:58:58 vdb01 kernel: [19857.457715]      (t=44897 jiffies g=417485 c=417484 q=8814)
Aug  2 20:58:58 vdb01 kernel: [19857.458721] rcu_sched kthread starved for 44897 jiffies! g417485 c417484 f0x0 RCU_GP_WAIT_FQS(3) ->state=0x402 ->cpu=0
Aug  2 20:58:58 vdb01 kernel: [19857.460707] rcu_sched       I    0     8      2 0x80000000
Aug  2 20:58:58 vdb01 kernel: [19857.460709] Call Trace:
Aug  2 20:58:58 vdb01 kernel: [19857.460717]  __schedule+0x24e/0x890
Aug  2 20:58:58 vdb01 kernel: [19857.460719]  schedule+0x2c/0x80
Aug  2 20:58:58 vdb01 kernel: [19857.460720]  schedule_timeout+0x15d/0x370
Aug  2 20:58:58 vdb01 kernel: [19857.460723]  ? __next_timer_interrupt+0xe0/0xe0
Aug  2 20:58:58 vdb01 kernel: [19857.460726]  rcu_gp_kthread+0x53a/0x980
Aug  2 20:58:58 vdb01 kernel: [19857.460729]  kthread+0x121/0x140
Aug  2 20:58:58 vdb01 kernel: [19857.460730]  ? rcu_note_context_switch+0x150/0x150
Aug  2 20:58:58 vdb01 kernel: [19857.460731]  ? kthread_create_worker_on_cpu+0x70/0x70
Aug  2 20:58:58 vdb01 kernel: [19857.460732]  ret_from_fork+0x22/0x40
Aug  2 20:58:58 vdb01 kernel: [19857.460736] NMI backtrace for cpu 0
Aug  2 20:58:58 vdb01 kernel: [19857.460739] CPU: 0 PID: 0 Comm: swapper/0 Tainted: G             L   4.15.0-176-generic #185-Ubuntu
Aug  2 20:58:58 vdb01 kernel: [19857.460739] Hardware name: QEMU Standard PC (i440FX + PIIX, 1996), BIOS rel-1.15.0-0-g2dd4b9b3f840-prebuilt.qemu.org 04/01/2014
Aug  2 20:58:58 vdb01 kernel: [19857.460739] Call Trace:
Aug  2 20:58:58 vdb01 kernel: [19857.460740]  <IRQ>
Aug  2 20:58:58 vdb01 kernel: [19857.460742]  dump_stack+0x6d/0x8b
Aug  2 20:58:58 vdb01 kernel: [19857.460744]  nmi_cpu_backtrace+0x94/0xa0
Aug  2 20:58:58 vdb01 kernel: [19857.460747]  ? lapic_can_unplug_cpu+0xb0/0xb0
Aug  2 20:58:58 vdb01 kernel: [19857.460748]  nmi_trigger_cpumask_backtrace+0xe7/0x130
Aug  2 20:58:58 vdb01 kernel: [19857.460749]  arch_trigger_cpumask_backtrace+0x19/0x20
Aug  2 20:58:58 vdb01 kernel: [19857.460751]  rcu_dump_cpu_stacks+0xa3/0xd5
Aug  2 20:58:58 vdb01 kernel: [19857.460752]  rcu_check_callbacks+0x6cd/0x8e0
Aug  2 20:58:58 vdb01 kernel: [19857.460756]  ? tick_sched_do_timer+0x50/0x50
Aug  2 20:58:58 vdb01 kernel: [19857.460757]  update_process_times+0x2f/0x60
Aug  2 20:58:58 vdb01 kernel: [19857.460758]  tick_sched_handle+0x26/0x70
Aug  2 20:58:58 vdb01 kernel: [19857.460759]  ? tick_sched_do_timer+0x42/0x50
Aug  2 20:58:58 vdb01 kernel: [19857.460760]  tick_sched_timer+0x39/0x80
Aug  2 20:58:58 vdb01 kernel: [19857.460762]  __hrtimer_run_queues+0xdf/0x230
Aug  2 20:58:58 vdb01 kernel: [19857.460765]  hrtimer_interrupt+0xa0/0x1d0
Aug  2 20:58:58 vdb01 kernel: [19857.460768]  smp_apic_timer_interrupt+0x6f/0x140
Aug  2 20:58:58 vdb01 kernel: [19857.460770]  apic_timer_interrupt+0x90/0xa0
Aug  2 20:58:58 vdb01 kernel: [19857.460770]  </IRQ>
Aug  2 20:58:58 vdb01 kernel: [19857.460772] RIP: 0010:native_safe_halt+0x12/0x20
Aug  2 20:58:58 vdb01 kernel: [19857.460773] RSP: 0018:ffffffffa0e03e28 EFLAGS: 00000246 ORIG_RAX: ffffffffffffff11
Aug  2 20:58:58 vdb01 kernel: [19857.460775] RAX: ffffffffa03d0a50 RBX: 0000000000000000 RCX: 0000000000000000
Aug  2 20:58:58 vdb01 kernel: [19857.460776] RDX: 0000000000000000 RSI: 0000000000000000 RDI: 0000000000000000
Aug  2 20:58:58 vdb01 kernel: [19857.460776] RBP: ffffffffa0e03e28 R08: 0000000000000002 R09: 0000000000000002
Aug  2 20:58:58 vdb01 kernel: [19857.460777] R10: 0000000000100000 R11: 0000000000000000 R12: 0000000000000000
Aug  2 20:58:58 vdb01 kernel: [19857.460777] R13: 0000000000000000 R14: 0000000000000000 R15: 0000000000000000
Aug  2 20:58:58 vdb01 kernel: [19857.460779]  ? __sched_text_end+0x1/0x1
Aug  2 20:58:58 vdb01 kernel: [19857.460780]  default_idle+0x20/0x100
Aug  2 20:58:58 vdb01 kernel: [19857.460783]  arch_cpu_idle+0x15/0x20
Aug  2 20:58:58 vdb01 kernel: [19857.460784]  default_idle_call+0x23/0x30
Aug  2 20:58:58 vdb01 kernel: [19857.460786]  do_idle+0x172/0x1f0
Aug  2 20:58:58 vdb01 kernel: [19857.460787]  cpu_startup_entry+0x73/0x80
Aug  2 20:58:58 vdb01 kernel: [19857.460788]  rest_init+0xae/0xb0
Aug  2 20:58:58 vdb01 kernel: [19857.460791]  start_kernel+0x4dc/0x500
Aug  2 20:58:58 vdb01 kernel: [19857.460793]  x86_64_start_reservations+0x24/0x26
Aug  2 20:58:58 vdb01 kernel: [19857.460794]  x86_64_start_kernel+0x74/0x77
Aug  2 20:58:58 vdb01 kernel: [19857.460796]  secondary_startup_64+0xa5/0xb0
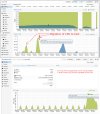
The IO on the host is not realy high during this time (wait ~6%)
Code:
ATOP - pve08                                          2022/08/02  21:07:14                                          ----------------                                           10m0s elapsed
PRC | sys    6m54s | user  88m19s |               | #proc    827 | #trun     10 | #tslpi   969 |               | #tslpu     0 | #zombie    0 | clones 126e4 |               | #exit >62415 |
CPU | sys     173% | user    884% |  irq       6% | idle   3731% | wait      6% | steal     0% |  guest   858% |              | ipc     1.14 | cycl  756MHz |  curf 2.94GHz | curscal   ?% |
CPL | avg1   10.70 | avg5   10.83 |               | avg15  10.76 |              |              |  csw 61541446 | intr 48058e3 |              |              |  numcpu    48 |              |
MEM | tot   377.3G | free  214.1G |  cache   1.1G | dirty   0.1M | buff    1.1M | slab   14.0G |  slrec  93.1M | shmem 163.0M | shrss   0.0M | vmbal   0.0M |  zfarc  78.6G | hptot   0.0M |
SWP | tot     0.0M | free    0.0M |               |              |              | swcac   0.0M |               |              |              | vmcom 181.3G |               | vmlim 188.7G |
PSI | cpusome   0% | memsome   0% |  memfull   0% | iosome    0% | iofull    0% | cs     0/0/0 |               | ms     0/0/0 | mf     0/0/0 | is     0/0/0 |  if     0/0/0 |              |
DSK |      nvme0n1 | busy     23% |  read 2341879 |              | write 215248 | KiB/r     13 |  KiB/w     62 | MBr/s   50.0 | MBw/s   21.7 |              |  avq     2.36 | avio 53.1 µs |
DSK |      nvme1n1 | busy     23% |  read 2341757 |              | write 218268 | KiB/r     13 |  KiB/w     61 | MBr/s   49.9 | MBw/s   21.7 |              |  avq     2.37 | avio 53.0 µs |
NFC | rpc      120 | read       0 |  write      0 |              | retxmit    0 | autref   120 |               |              |              |              |               |              |
NET | transport    | tcpi 5691913 |  tcpo 26574e3 | udpi  194747 | udpo  195878 | tcpao    962 |  tcppo    281 | tcprs   6979 | tcpie      0 | tcpor    669 |  udpnp      0 | udpie      0 |
NET | network      | ipi  5886747 |  ipo  4361404 |              | ipfrw      0 | deliv 5887e3 |               |              |              |              |  icmpi     24 | icmpo      0 |
NET | enp196s ---- | pcki 5670759 |  pcko 26556e3 | sp    0 Mbps | si 6072 Kbps | so 3164 Mbps |  coll       0 | mlti     330 | erri       0 | erro       0 |  drpi       0 | drpo       0 |
NET | vlan130 ---- | pcki 5670347 |  pcko 4141809 | sp    0 Mbps | si 5013 Kbps | so 3144 Mbps |  coll       0 | mlti       0 | erri       0 | erro       0 |  drpi       0 | drpo       0 |
Only 62415 exited processes handled -- 1190531 skipped!
    PID     SYSCPU      USRCPU     RDELAY       VGROW       RGROW      RDDSK       WRDSK      RUID         EUID          ST     EXC       THR      S     CPUNR       CPU      CMD     1/1747
 445040      9.72s      11m07s      1.18s      208.0M      51244K     37944K      275.4M      root         root          --       -         9      S        41      114%      kvm
2125592      2.12s      10m33s      0.43s          0K          0K        12K      21588K      root         root          --       -         8      S        41      106%      kvm
2296177      1.76s      10m00s      0.53s          0K      47104K     22560K      778.3M      root         root          --       -         8      S        40      101%      kvm
 492051      0.31s      10m00s      0.15s          0K          0K         0K          0K      root         root          --       -         5      S        41      101%      kvm
   4157      0.32s      10m00s      0.27s          0K          0K         0K          0K      root         root          --       -         5      S        40      101%      kvm
2335094     16.96s       8m35s      1.44s        1.5G        1.5G      37.1G        3.1G      root         root          --       -        42      S         3       89%      kvm
3560137      1.19s       7m39s      0.34s          0K        -20K      5164K      45872K      root         root          --       -         6      S        18       77%      kvm
 212929      3.24s       6m23s      0.30s          0K          0K       1.0G        1.9G      root         root          --       -         7      S         6       65%      kvm
Due the migrated VMs I can hopefully change the next node during this week and can test there settings, kernel and so on…

Any hints?

Udo
 
@udo

I am seeing IO related issues since upgrading to Proxmox 7 that did not exist in Proxmox 6.

For me the issue seems like it might be related to io_uring:
https://forum.proxmox.com/threads/high-io-wait-during-backups-after-upgrading-to-proxmox-7.113790/
The strange thing is, that I've now migrate all VMs to another server (same hardware, same software-version) and there are no issues.
Tried to reproduce the issue but still without success (can't use production VMs for that and stress swap do not produce much IO).
Even with fio are the issue aren't reproducable…

iothread isn't activate, because on old pve versions iothread prduce sometimes ugly migration issues… don't know if this issues all gone.

Udo
Hi,
the "other" Server run's without issues since yesterday evening.
I migrate live an VM (with app. 130GB zfs disks) and the VM hang, after the migration. I stop the process and boot again - VM starting and during boot I got the messages: rcu_sched self-detected stall on CPU { 0} - and cpu 1 too.
And during this time two VMs on the same server stop to work - cpu 100% and no console/network anymore.
I migrate from all hanging VMs the disks to ceph, and migrate them to the other "problem"-server , where the VMs started (after kill) without trouble (with ceph disks the VMs work well, with zfs not).

Today there is an new kernel available, but the changelog don't look that it's help in this case.
All disks are using the new io_uring - should I try to switch to native or threads? Pro/cons?

The micron 9300 NVMes from both server looks good, so I guess the issue is kernel/zfs related.

Udo
 

Attachments

  • boot_fail_after_migration.jpg
    boot_fail_after_migration.jpg
    71 KB · Views: 10
Hi,
status update: the issue is still there and actual updated hosts are not really production proof!
After Dell release in a short time a new bios-update and also some new pve-updates I'm hopefully to use the new hosts for production.
But with migration of an VM to the host I can still kill running VMs on that node!!

And also without any big IO I got kernel traces inside an VM:
Code:
[Sep 6 21:56] rcu: INFO: rcu_sched self-detected stall on CPU
[  +0.000035] rcu:      0-...!: (1 ticks this GP) idle=eb6/0/0x1 softirq=176383/176383 fqs=1
[  +0.000023]   (t=124020 jiffies g=236141 q=305379)
[  +0.000001] rcu: rcu_sched kthread starved for 124020 jiffies! g236141 f0x0 RCU_GP_WAIT_FQS(5) ->state=0x402 ->cpu=0
[  +0.000025] rcu: RCU grace-period kthread stack dump:
[  +0.000014] rcu_sched       I    0    11      2 0x80004000
[  +0.000003] Call Trace:
[  +0.000008]  __schedule+0x2e3/0x740
[  +0.000001]  schedule+0x42/0xb0
[  +0.000002]  schedule_timeout+0x8a/0x160
[  +0.000003]  ? __next_timer_interrupt+0xe0/0xe0
[  +0.000002]  rcu_gp_kthread+0x48d/0x9a0
[  +0.000002]  kthread+0x104/0x140
[  +0.000001]  ? kfree_call_rcu+0x20/0x20
[  +0.000000]  ? kthread_park+0x90/0x90
[  +0.000002]  ret_from_fork+0x35/0x40
[  +0.000004] NMI backtrace for cpu 0
[  +0.000002] CPU: 0 PID: 0 Comm: swapper/0 Not tainted 5.4.0-113-generic #127-Ubuntu
[  +0.000001] Hardware name: QEMU Standard PC (i440FX + PIIX, 1996), BIOS rel-1.16.0-0-gd239552ce722-prebuilt.qemu.org 04/01/2014
[  +0.000000] Call Trace:
[  +0.000001]  <IRQ>
[  +0.000001]  dump_stack+0x6d/0x8b
[  +0.000002]  ? lapic_can_unplug_cpu+0x80/0x80
[  +0.000001]  nmi_cpu_backtrace.cold+0x14/0x53
[  +0.000002]  nmi_trigger_cpumask_backtrace+0xe8/0xf0
[  +0.000002]  arch_trigger_cpumask_backtrace+0x19/0x20
[  +0.000001]  rcu_dump_cpu_stacks+0x99/0xcb
[  +0.000001]  rcu_sched_clock_irq.cold+0x1b0/0x39c
[  +0.000002]  update_process_times+0x2c/0x60
[  +0.000002]  tick_sched_handle+0x29/0x60
[  +0.000001]  tick_sched_timer+0x3d/0x80
[  +0.000001]  __hrtimer_run_queues+0xf7/0x270
[  +0.000001]  ? tick_sched_do_timer+0x60/0x60
[  +0.000002]  hrtimer_interrupt+0x109/0x220
[  +0.000001]  smp_apic_timer_interrupt+0x71/0x140
[  +0.000001]  apic_timer_interrupt+0xf/0x20
[  +0.000001]  </IRQ>
[  +0.000001] RIP: 0010:native_safe_halt+0xe/0x10
[  +0.000002] Code: 7b ff ff ff eb bd 90 90 90 90 90 90 e9 07 00 00 00 0f 00 2d b6 33 52 00 f4 c3 66 90 e9 07 00 00 00 0f 00 2d a6 33 52 00 fb f4 <c3> 90 66 66 66 66 90 55 48 89 e5 41 55 41 54 53 e8 4d 32 63 ff 65
[  +0.000001] RSP: 0018:ffffffffae403e18 EFLAGS: 00000246 ORIG_RAX: ffffffffffffff13
[  +0.000001] RAX: ffffffffad4e8000 RBX: 0000000000000000 RCX: 0000000000000001
[  +0.000001] RDX: 0000000002151eb2 RSI: ffffffffae403dd8 RDI: 000013b5ec7cae6d
[  +0.000001] RBP: ffffffffae403e38 R08: 0000000000000001 R09: 0000000000000000
[  +0.000000] R10: ffff9fa21f21c848 R11: 0000000000000000 R12: 0000000000000000
[  +0.000000] R13: ffffffffae413780 R14: 0000000000000000 R15: 0000000000000000
[  +0.000002]  ? __cpuidle_text_start+0x8/0x8
[  +0.000001]  ? tick_nohz_idle_stop_tick+0x164/0x290
[  +0.000001]  ? default_idle+0x20/0x140
[  +0.000002]  arch_cpu_idle+0x15/0x20
[  +0.000001]  default_idle_call+0x23/0x30
[  +0.000002]  do_idle+0x1fb/0x270
[  +0.000001]  cpu_startup_entry+0x20/0x30
[  +0.000001]  rest_init+0xae/0xb0
[  +0.000003]  arch_call_rest_init+0xe/0x1b
[  +0.000001]  start_kernel+0x549/0x56a
[  +0.000001]  x86_64_start_reservations+0x24/0x26
[  +0.000001]  x86_64_start_kernel+0x75/0x79
[  +0.000002]  secondary_startup_64+0xa4/0xb0
[  +0.000075] rcu: INFO: rcu_sched self-detected stall on CPU
[  +0.000016] rcu:      0-...!: (2 ticks this GP) idle=eb6/0/0x1 softirq=176383/176383 fqs=1
[  +0.000020]   (t=2323043 jiffies g=236141 q=305379)
[  +0.000001] rcu: rcu_sched kthread starved for 2323043 jiffies! g236141 f0x0 RCU_GP_WAIT_FQS(5) ->state=0x0 ->cpu=0
[  +0.000024] rcu: RCU grace-period kthread stack dump:
[  +0.000014] rcu_sched       R  running task        0    11      2 0x80004000
inside the VM the cpu is idle, but the pve-gui shows 100% since the kernel trace
Code:
top - 10:26:01 up 21:06,  1 user,  load average: 0.02, 0.19, 0.57
Tasks: 115 total,   1 running, 114 sleeping,   0 stopped,   0 zombie
%Cpu(s):  0.3 us,  0.0 sy,  0.0 ni, 99.3 id,  0.0 wa,  0.0 hi,  0.0 si,  0.3 st
MiB Mem :   3982.2 total,   3093.5 free,    275.8 used,    612.9 buff/cache
MiB Swap:      0.0 total,      0.0 free,      0.0 used.   3345.1 avail Mem

    PID USER      PR  NI    VIRT    RES    SHR S  %CPU  %MEM     TIME+ COMMAND                                                                                                     
  57124 root      20   0       0      0      0 I   0.3   0.0   0:00.71 kworker/0:0-events                                                                                          
      1 root      20   0  103648  11264   8284 S   0.0   0.3   0:03.61 systemd                                                                                                     
      2 root      20   0       0      0      0 S   0.0   0.0   0:00.00 kthreadd                                                                                                    
      3 root       0 -20       0      0      0 I   0.0   0.0   0:00.00 rcu_gp                                                                                                      
      4 root       0 -20       0      0      0 I   0.0   0.0   0:00.00 rcu_par_gp                                                                                                  
      6 root       0 -20       0      0      0 I   0.0   0.0   0:00.00 kworker/0:0H-kblockd                                                                                        
      8 root      20   0       0      0      0 I   0.0   0.0   0:00.00 kworker/u32:0-netns
the VM conf
Code:
cat /etc/pve/qemu-server/853.conf
agent: 1,fstrim_cloned_disks=1
bootdisk: scsi0
cores: 8
cpu: kvm64,flags=+ibpb;+virt-ssbd;+amd-ssbd;+aes
hotplug: disk,network,usb,memory,cpu
memory: 4096
name: vxxx.yyyyy.net
net0: virtio=9A:3D:3B:71:33:F3,bridge=vmbr0,tag=2001
numa: 1
onboot: 1
ostype: l26
scsi0: local-zfs:vm-853-disk-0,aio=native,discard=on,format=raw,size=25G
scsihw: virtio-scsi-pci
smbios1: uuid=4e71c2a8-e29d-498d-bfaf-ed5b43f91de1
sockets: 2
tablet: 0
vcpus: 1
vmgenid: bd2ec509-cfe2-4153-91c2-d78a4c6124db
pve is on the latest version
Code:
~# pveversion -v
proxmox-ve: 7.2-1 (running kernel: 5.15.39-4-pve)
pve-manager: 7.2-7 (running version: 7.2-7/d0dd0e85)
pve-kernel-5.15: 7.2-9
pve-kernel-helper: 7.2-9
pve-kernel-5.13: 7.1-9
pve-kernel-5.15.39-4-pve: 5.15.39-4
pve-kernel-5.15.39-1-pve: 5.15.39-1
pve-kernel-5.13.19-6-pve: 5.13.19-15
pve-kernel-5.13.19-2-pve: 5.13.19-4
ceph-fuse: 15.2.16-pve1
corosync: 3.1.5-pve2
criu: 3.15-1+pve-1
glusterfs-client: 9.2-1
ifupdown2: 3.1.0-1+pmx3
ksm-control-daemon: 1.4-1
libjs-extjs: 7.0.0-1
libknet1: 1.24-pve1
libproxmox-acme-perl: 1.4.2
libproxmox-backup-qemu0: 1.3.1-1
libpve-access-control: 7.2-4
libpve-apiclient-perl: 3.2-1
libpve-common-perl: 7.2-2
libpve-guest-common-perl: 4.1-2
libpve-http-server-perl: 4.1-3
libpve-storage-perl: 7.2-8
libspice-server1: 0.14.3-2.1
lvm2: 2.03.11-2.1
lxc-pve: 5.0.0-3
lxcfs: 4.0.12-pve1
novnc-pve: 1.3.0-3
openvswitch-switch: 2.15.0+ds1-2+deb11u1
proxmox-backup-client: 2.2.5-1
proxmox-backup-file-restore: 2.2.5-1
proxmox-mini-journalreader: 1.3-1
proxmox-widget-toolkit: 3.5.1
pve-cluster: 7.2-2
pve-container: 4.2-2
pve-docs: 7.2-2
pve-edk2-firmware: 3.20220526-1
pve-firewall: 4.2-5
pve-firmware: 3.5-1
pve-ha-manager: 3.4.0
pve-i18n: 2.7-2
pve-qemu-kvm: 7.0.0-2
pve-xtermjs: 4.16.0-1
qemu-server: 7.2-4
smartmontools: 7.2-pve3
spiceterm: 3.2-2
swtpm: 0.7.1~bpo11+1
vncterm: 1.7-1
zfsutils-linux: 2.1.5-pve1
I have an Maintenance window for another host this week, but still now it's looks, that I don't update this node to pve7.2 - pve6.4 are running well.

Udo
 

Attachments

  • cpu_20220907_102334.jpg
    cpu_20220907_102334.jpg
    97.7 KB · Views: 5
Last edited:
Hi,
status update: the issue is still there and actual updated hosts are not really production proof!
After Dell release in a short time a new bios-update and also some new pve-updates I'm hopefully to use the new hosts for production.
But with migration of an VM to the host I can still kill running VMs on that node!!

And also without any big IO I got kernel traces inside an VM:
Code:
[Sep 6 21:56] rcu: INFO: rcu_sched self-detected stall on CPU
[  +0.000035] rcu:      0-...!: (1 ticks this GP) idle=eb6/0/0x1 softirq=176383/176383 fqs=1
[  +0.000023]   (t=124020 jiffies g=236141 q=305379)
[  +0.000001] rcu: rcu_sched kthread starved for 124020 jiffies! g236141 f0x0 RCU_GP_WAIT_FQS(5) ->state=0x402 ->cpu=0
[  +0.000025] rcu: RCU grace-period kthread stack dump:
[  +0.000014] rcu_sched       I    0    11      2 0x80004000
[  +0.000003] Call Trace:
[  +0.000008]  __schedule+0x2e3/0x740
[  +0.000001]  schedule+0x42/0xb0
[  +0.000002]  schedule_timeout+0x8a/0x160
[  +0.000003]  ? __next_timer_interrupt+0xe0/0xe0
[  +0.000002]  rcu_gp_kthread+0x48d/0x9a0
[  +0.000002]  kthread+0x104/0x140
[  +0.000001]  ? kfree_call_rcu+0x20/0x20
[  +0.000000]  ? kthread_park+0x90/0x90
[  +0.000002]  ret_from_fork+0x35/0x40
[  +0.000004] NMI backtrace for cpu 0
[  +0.000002] CPU: 0 PID: 0 Comm: swapper/0 Not tainted 5.4.0-113-generic #127-Ubuntu
[  +0.000001] Hardware name: QEMU Standard PC (i440FX + PIIX, 1996), BIOS rel-1.16.0-0-gd239552ce722-prebuilt.qemu.org 04/01/2014
[  +0.000000] Call Trace:
[  +0.000001]  <IRQ>
[  +0.000001]  dump_stack+0x6d/0x8b
[  +0.000002]  ? lapic_can_unplug_cpu+0x80/0x80
[  +0.000001]  nmi_cpu_backtrace.cold+0x14/0x53
[  +0.000002]  nmi_trigger_cpumask_backtrace+0xe8/0xf0
[  +0.000002]  arch_trigger_cpumask_backtrace+0x19/0x20
[  +0.000001]  rcu_dump_cpu_stacks+0x99/0xcb
[  +0.000001]  rcu_sched_clock_irq.cold+0x1b0/0x39c
[  +0.000002]  update_process_times+0x2c/0x60
[  +0.000002]  tick_sched_handle+0x29/0x60
[  +0.000001]  tick_sched_timer+0x3d/0x80
[  +0.000001]  __hrtimer_run_queues+0xf7/0x270
[  +0.000001]  ? tick_sched_do_timer+0x60/0x60
[  +0.000002]  hrtimer_interrupt+0x109/0x220
[  +0.000001]  smp_apic_timer_interrupt+0x71/0x140
[  +0.000001]  apic_timer_interrupt+0xf/0x20
[  +0.000001]  </IRQ>
[  +0.000001] RIP: 0010:native_safe_halt+0xe/0x10
[  +0.000002] Code: 7b ff ff ff eb bd 90 90 90 90 90 90 e9 07 00 00 00 0f 00 2d b6 33 52 00 f4 c3 66 90 e9 07 00 00 00 0f 00 2d a6 33 52 00 fb f4 <c3> 90 66 66 66 66 90 55 48 89 e5 41 55 41 54 53 e8 4d 32 63 ff 65
[  +0.000001] RSP: 0018:ffffffffae403e18 EFLAGS: 00000246 ORIG_RAX: ffffffffffffff13
[  +0.000001] RAX: ffffffffad4e8000 RBX: 0000000000000000 RCX: 0000000000000001
[  +0.000001] RDX: 0000000002151eb2 RSI: ffffffffae403dd8 RDI: 000013b5ec7cae6d
[  +0.000001] RBP: ffffffffae403e38 R08: 0000000000000001 R09: 0000000000000000
[  +0.000000] R10: ffff9fa21f21c848 R11: 0000000000000000 R12: 0000000000000000
[  +0.000000] R13: ffffffffae413780 R14: 0000000000000000 R15: 0000000000000000
[  +0.000002]  ? __cpuidle_text_start+0x8/0x8
[  +0.000001]  ? tick_nohz_idle_stop_tick+0x164/0x290
[  +0.000001]  ? default_idle+0x20/0x140
[  +0.000002]  arch_cpu_idle+0x15/0x20
[  +0.000001]  default_idle_call+0x23/0x30
[  +0.000002]  do_idle+0x1fb/0x270
[  +0.000001]  cpu_startup_entry+0x20/0x30
[  +0.000001]  rest_init+0xae/0xb0
[  +0.000003]  arch_call_rest_init+0xe/0x1b
[  +0.000001]  start_kernel+0x549/0x56a
[  +0.000001]  x86_64_start_reservations+0x24/0x26
[  +0.000001]  x86_64_start_kernel+0x75/0x79
[  +0.000002]  secondary_startup_64+0xa4/0xb0
[  +0.000075] rcu: INFO: rcu_sched self-detected stall on CPU
[  +0.000016] rcu:      0-...!: (2 ticks this GP) idle=eb6/0/0x1 softirq=176383/176383 fqs=1
[  +0.000020]   (t=2323043 jiffies g=236141 q=305379)
[  +0.000001] rcu: rcu_sched kthread starved for 2323043 jiffies! g236141 f0x0 RCU_GP_WAIT_FQS(5) ->state=0x0 ->cpu=0
[  +0.000024] rcu: RCU grace-period kthread stack dump:
[  +0.000014] rcu_sched       R  running task        0    11      2 0x80004000
inside the VM the cpu is idle, but the pve-gui shows 100% since the kernel trace
Code:
top - 10:26:01 up 21:06,  1 user,  load average: 0.02, 0.19, 0.57
Tasks: 115 total,   1 running, 114 sleeping,   0 stopped,   0 zombie
%Cpu(s):  0.3 us,  0.0 sy,  0.0 ni, 99.3 id,  0.0 wa,  0.0 hi,  0.0 si,  0.3 st
MiB Mem :   3982.2 total,   3093.5 free,    275.8 used,    612.9 buff/cache
MiB Swap:      0.0 total,      0.0 free,      0.0 used.   3345.1 avail Mem

    PID USER      PR  NI    VIRT    RES    SHR S  %CPU  %MEM     TIME+ COMMAND                                                                                                    
  57124 root      20   0       0      0      0 I   0.3   0.0   0:00.71 kworker/0:0-events                                                                                         
      1 root      20   0  103648  11264   8284 S   0.0   0.3   0:03.61 systemd                                                                                                    
      2 root      20   0       0      0      0 S   0.0   0.0   0:00.00 kthreadd                                                                                                   
      3 root       0 -20       0      0      0 I   0.0   0.0   0:00.00 rcu_gp                                                                                                     
      4 root       0 -20       0      0      0 I   0.0   0.0   0:00.00 rcu_par_gp                                                                                                 
      6 root       0 -20       0      0      0 I   0.0   0.0   0:00.00 kworker/0:0H-kblockd                                                                                       
      8 root      20   0       0      0      0 I   0.0   0.0   0:00.00 kworker/u32:0-netns
the VM conf
Code:
cat /etc/pve/qemu-server/853.conf
agent: 1,fstrim_cloned_disks=1
bootdisk: scsi0
cores: 8
cpu: kvm64,flags=+ibpb;+virt-ssbd;+amd-ssbd;+aes
hotplug: disk,network,usb,memory,cpu
memory: 4096
name: vxxx.yyyyy.net
net0: virtio=9A:3D:3B:71:33:F3,bridge=vmbr0,tag=2001
numa: 1
onboot: 1
ostype: l26
scsi0: local-zfs:vm-853-disk-0,aio=native,discard=on,format=raw,size=25G
scsihw: virtio-scsi-pci
smbios1: uuid=4e71c2a8-e29d-498d-bfaf-ed5b43f91de1
sockets: 2
tablet: 0
vcpus: 1
vmgenid: bd2ec509-cfe2-4153-91c2-d78a4c6124db
pve is on the latest version
Code:
~# pveversion -v
proxmox-ve: 7.2-1 (running kernel: 5.15.39-4-pve)
pve-manager: 7.2-7 (running version: 7.2-7/d0dd0e85)
pve-kernel-5.15: 7.2-9
pve-kernel-helper: 7.2-9
pve-kernel-5.13: 7.1-9
pve-kernel-5.15.39-4-pve: 5.15.39-4
pve-kernel-5.15.39-1-pve: 5.15.39-1
pve-kernel-5.13.19-6-pve: 5.13.19-15
pve-kernel-5.13.19-2-pve: 5.13.19-4
ceph-fuse: 15.2.16-pve1
corosync: 3.1.5-pve2
criu: 3.15-1+pve-1
glusterfs-client: 9.2-1
ifupdown2: 3.1.0-1+pmx3
ksm-control-daemon: 1.4-1
libjs-extjs: 7.0.0-1
libknet1: 1.24-pve1
libproxmox-acme-perl: 1.4.2
libproxmox-backup-qemu0: 1.3.1-1
libpve-access-control: 7.2-4
libpve-apiclient-perl: 3.2-1
libpve-common-perl: 7.2-2
libpve-guest-common-perl: 4.1-2
libpve-http-server-perl: 4.1-3
libpve-storage-perl: 7.2-8
libspice-server1: 0.14.3-2.1
lvm2: 2.03.11-2.1
lxc-pve: 5.0.0-3
lxcfs: 4.0.12-pve1
novnc-pve: 1.3.0-3
openvswitch-switch: 2.15.0+ds1-2+deb11u1
proxmox-backup-client: 2.2.5-1
proxmox-backup-file-restore: 2.2.5-1
proxmox-mini-journalreader: 1.3-1
proxmox-widget-toolkit: 3.5.1
pve-cluster: 7.2-2
pve-container: 4.2-2
pve-docs: 7.2-2
pve-edk2-firmware: 3.20220526-1
pve-firewall: 4.2-5
pve-firmware: 3.5-1
pve-ha-manager: 3.4.0
pve-i18n: 2.7-2
pve-qemu-kvm: 7.0.0-2
pve-xtermjs: 4.16.0-1
qemu-server: 7.2-4
smartmontools: 7.2-pve3
spiceterm: 3.2-2
swtpm: 0.7.1~bpo11+1
vncterm: 1.7-1
zfsutils-linux: 2.1.5-pve1
I have an Maintenance window for another host this week, but still now it's looks, that I don't update this node to pve7.2 - pve6.4 are running well.

Udo
Hi again,
for the maintenance tomorrow morning, I've canceled the pve7.2 upgrade!
I've live migrate some VMs from the pve6-host, but first moved all VM-disk to ceph.
The pve6-host has an AMD EPYC 7542 CPU. The target (new 7.4) has an AMD EPYC 7402P.
All VMs was pingable after migration and the console react on Input.
But after some minutes the VMs died - pinging sometimes work but nothing else - CPU 100% and after stop/start-cycle the VM run again.
But also one of the "old" VMs on the host - with local zfs storage are hanging too (so aoi=threads and iothreads are not helpfull!).

Perhaps is on AMD-CPUs only, because the issue is very worse and for that I read not so much in the forum.

Udo
 
Hi,
status update - also with the new kernel pve-kernel-5.15.53-1-pve the same effekt happens. During migrate an big VM to that node, an existing VM hangs… see attached screenshot.
After that I installed the pve-5.13 kernel (pve-kernel-5.13.19-6-pve) and with this kernel I had migrate many VMs to the host and all looks fine!!
Unfortunality I can't purge pve-kernel-5.15 (will removed proxmox-ve) to avoid the wrong kernel at booting.

Udo
 

Attachments

  • trouble_pve7_2.jpg
    trouble_pve7_2.jpg
    403.9 KB · Views: 11
Status Update:
to use our new server in an production ready shape, there are two (in real only one) solutions:
- use Kernel 5.13 - not realy an solution
- use the actual 5.15 Kernel with the VM settings found by @RolandK :
Code:
scsihw: virtio-scsi-single
scsi0: STORAGE:vm-XXX-disk-0,aio=threads,discard=on,format=raw,iothread=1,size=XXG

# discard=on isn't nessesary
I've configured all VMs and the server is stable like expected (and like before).

It's a shame not to have heard from the developers in this thread. I expected an hint…


Udo
 

About

The Proxmox community has been around for many years and offers help and support for Proxmox VE, Proxmox Backup Server, and Proxmox Mail Gateway.
We think our community is one of the best thanks to people like you!

Get your subscription!

The Proxmox team works very hard to make sure you are running the best software and getting stable updates and security enhancements, as well as quick enterprise support. Tens of thousands of happy customers have a Proxmox subscription. Get yours easily in our online shop.

Buy now!