ZFS performance collapse on MegaRAID 9364 with Samsung 870 EVO SSDs (PVE 9)

Radik Makhmudov

New Member
Jul 28, 2026
10
2
3
Hello,

After upgrading from kernel 7.0.2-6-pve to 7.0.14-6-pve, I observed a reproducible and severe storage performance regression.

System:
  • Proxmox VE 9.2.5
  • 4 × Samsung 870 EVO 1TB SSD
  • ZFS pool: two mirrored vdevs
  • Pool status: ONLINE
  • No read/write/checksum errors
  • Latest scrub completed successfully
Test:

The same fio test was executed on both kernels.

fio \
--name=seq-write \
--filename=/tank/testfile \
--rw=write \
--bs=1M \
--direct=1 \
--ioengine=psync \
--size=8G \
--group_reporting

Results:
Kernel 7.0.2-6-pve

WRITE: 257 MiB/s (270 MB/s)
runtime: 31.9 seconds
average latency: ~3.9 ms


Kernel 7.0.14-6-pve
WRITE: 7736 KiB/s (~7.5 MiB/s)
runtime: 1084 seconds
average latency: ~132 ms
maximum latency: >2 seconds


Host behaviour on 7.0.14-6-pve
At the same time the system shows:
  • system CPU: ~85%
  • idle CPU: 2–4%
  • iowait: ~0%
  • load average: 54–60
htop shows all 32 logical CPUs continuously loaded at approximately 90–100%.

The highest CPU consumers are kernel threads:

acpi_pad/2
acpi_pad/6
acpi_pad/9
acpi_pad/14
...
Each thread consumes approximately 95% CPU.

Example:

PID COMMAND
1791079 acpi_pad/18
1790964 acpi_pad/6
1790995 acpi_pad/14
...

Has anyone seen similar behaviour on kernel 7.0.14-6-pve?
Could this be a kernel regression related to ACPI, CPU scheduling, or another subsystem?
Complete report.txt, pveversion -v, fio output, dstat, htop screenshots, and additional diagnostics is attached
 

Attachments

  • cpu_zfs.PNG
    cpu_zfs.PNG
    20.6 KB · Views: 8
  • report.txt
    report.txt
    6.2 KB · Views: 5
Last edited:
Kudos for the thorough report!
What platform/server/hardware are you on?
Anything related in the journal?
 
Thanks for your reply.

Here's the system information for the affected host.
I also reviewed the journal from the affected boot (kernel 7.0.14-6-pve). I couldn't find any obvious kernel warnings or errors related to this issue. The filtered log is attached.

Filters:
journalctl -b -1 -p warning
journalctl -b -1 -p err
journalctl -b -1 | grep -Ei 'BUG|Call Trace|Oops|watchdog|lockup'
journalctl -b -1 | grep -Ei 'acpi_pad|powercap|intel_rapl'


Chassis: server
Machine ID: bac9f42a6bfb404a86efde6502e5715f
Boot ID: 5eab2535db104d39ab18e1b6a47c7671
Operating System: Debian GNU/Linux 13 (trixie)
Kernel: Linux 7.0.2-6-pve
Architecture: x86-64
Hardware Vendor: Lenovo
Hardware Model: 70QNS01J00
Firmware Version: VB3TS505
Firmware Date: Fri 2022-10-14


PRETTY_NAME="Debian GNU/Linux 13 (trixie)"
DEBIAN_VERSION_FULL=13.6


CPU INFORMATION
Logical CPU Cores: 32

Architecture: x86_64
CPU(s): 32
On-line CPU(s) list: 0-31
Model name: Intel(R) Xeon(R) CPU E5-2620 v4 @ 2.10GHz
Thread(s) per core: 2
Core(s) per socket: 8
Socket(s): 2
CPU(s) scaling MHz: 25%
Virtualization: VT-x
NUMA node0 CPU(s): 0-7,16-23
NUMA node1 CPU(s): 8-15,24-31

MEMORY INFORMATION
total used free shared buff/cache available
Mem: 157Gi 64Gi 5.8Gi 81Mi 87Gi 92Gi
Swap: 8.0Gi 20Mi 8.0Gi
 

Attachments

Last edited:
please post a full, unfiltered journal at least until multi-user.target has been hit.
 
Hi,
As requested, I've attached the full journal from the affected boot. The log is from the system running the 7.0.14-6-pve kernel, from boot until the system reached multi-user.target.

No log messages or kernel output were modified; only some identifiers were anonymized.

Please let me know if you need any additional logs or if you'd like me to test something else.

Thanks!
 

Attachments

There was somethink like zfs modul has no longer access to kernel cpu xyz hw access for checksum computation which was activated in any 7.x... by kernel developers. Cannot find again in this internet yet ... maybe that's the reason and maybe that will change back or not in the future as even don't know the reason for. That's not specific against zfs, it's against external kernel modules have kind of hw access which should not have, maybe for security reasons implemented.
 
Last edited:
That's an interesting hypothesis. However, if OpenZFS had generally lost access to hardware checksum acceleration due to a kernel change, I would expect to see a similar performance regression on other Proxmox VE 9 nodes running the same OpenZFS version.

In my case, that's not what I'm seeing. I have several other PVE 9 systems based on AMD EPYC, and they don't exhibit this behavior. The same fio workload on those systems reaches about 420 MiB/s, while this particular Intel Broadwell (Xeon E5-2620 v4 / C610 chipset) only reaches around 206 MiB/s under the same conditions, and the newer kernel degrades it even further.

So far, this appears to be specific to this Intel platform rather than a generic OpenZFS issue. It could still be related to the interaction between the kernel, OpenZFS, and this particular hardware, but the AMD systems don't show the same regression.
 
if I read the logs correctly, your monitoring only starts complaining about CPU load 1.5 days after booting? the first signs of overload are a bit before that (Jul 28 4:17), shortly after the nightly backups are done. is there anything else going on at that time?
 
Yes, that's correct. The first signs of increased CPU usage appear around Jul 28 at approximately 04:17, shortly after the scheduled nightly backups.


The backups themselves completed successfully, and there are no other scheduled jobs (scrubs, replication, or similar maintenance tasks) running at that time.


I also considered whether the backups could be triggering the issue, but I have several other Proxmox VE 9 nodes with similar backup schedules, and they do not show this behavior. This is currently the only Intel-based node (Xeon E5-2620 v4 / C610 chipset); the other nodes are AMD EPYC systems and remain stable.


So it's possible that the backup workload is exposing or triggering the issue on this particular platform, but it doesn't appear to be the root cause by itself.
 
since you write it is reproducible - how do you reproduce it?
 
By "reproducible" I mean the performance benchmarks. Running the same fio workload under the same conditions consistently produces the same results on this node.
The increased CPU usage after ~1.5 days of uptime is not yet reproducible on demand. It has happened after the nightly backup window, but I don't yet know whether the backup is the actual trigger or just a coincidence.

I have already migrated the production VMs off this node, but I'll start a test VM again, schedule regular nightly backups, and let it run for a few days. If the issue reappears, I'll collect additional diagnostics around the time it starts.
 
okay. that ZFS consistently gets slow if something is pegging all CPU cores is kind of expected - consistently getting the system *into* that state would be more interesting!
 
That is exactly what I am trying to determine. It may actually be the other way around: the ZFS workload could first enter a very CPU-expensive slow path, after which work starts accumulating and eventually pegs all CPU cores.

On the host I found a reproducible difference:
  • ZFS dataset, compression=lz4, 1 MiB sequential writes, fio --direct=1: about 35 MiB/s with high system CPU.
  • The same dataset and workload without --direct=1: about 527 MiB/s.
  • A zvol on the same pool performs around 190 MiB/s.

So my current hypothesis is not simply “high CPU makes ZFS slow”, but that a particular ZFS filesystem I/O path may consume excessive CPU per unit of work, allowing the workload to accumulate until all cores are busy.

I have not yet proven that this synthetic case is the same mechanism as the original issue, so I am now trying to capture which rises first: ZFS latency/queue depth or CPU utilization.
 
I repeated the test after rebooting into both kernels.
Results are reproducible.

Environment:
  • kernel 7.0.14-6-pve
  • kernel 7.0.2-6-pve
  • OpenZFS 2.4.3

After a clean boot:
  • buffered sequential write is about 290 MB/s
  • direct sequential write (fio, direct=1) is about 31–36 MiB/s
Rebooting into the older kernel does not change the result.

I attached:
  • system information after boot;
  • CPU baseline;
  • ZFS configuration;
  • buffered fio result;
  • direct fio result
  • ...

Please let me know if there is any additional information or tracing that would be useful.
 

Attachments

that doesn't really tell us much, and in any case, that consumer SSDs don't give much performance with ZFS is not a kernel bug ;)

if you can reproduce the acpi_pad kernel threads pegging the CPU and have a reliable trigger for that, please report back!
 
  • Like
Reactions: news
Thanks. I understand that consumer SSDs are not ideal for ZFS, but I do not think the SSD model alone explains this case.
This same server previously ran a KVM-based setup with good storage performance, and I also have other comparable Proxmox/ZFS nodes using the same Samsung 870 EVO SSDs which do not show this behaviour.

So there appears to be something specific to this node or its current configuration, rather than simply “consumer SSDs are slow with ZFS.”

I agree that the acpi_pad issue is separate. At the moment I do not have a reliable trigger for it. If I can reproduce the acpi_pad/* threads pegging the CPUs again, I will capture the state before rebooting and report back.

For now, I will compare this node against one of the working nodes component by component: controller mode and firmware, ZFS module/version, pool properties, CPU/NUMA layout and BIOS power settings.
 
Hi everyone, I'd like to summarize this investigation in case someone encounters a similar issue in the future.

First of all, thank you to everyone who took the time to review the logs and suggest ideas. This was my first serious OpenZFS performance investigation and also my first experience troubleshooting a MegaRAID controller in JBOD mode under Proxmox VE. I learned a great deal during this process.

The issue appeared during a planned migration from my previous production virtualization platform to Proxmox VE.
The migration itself was straightforward:
  • one production node was scheduled for maintenance;
  • I brought the new Proxmox node online;
  • virtual machines started normally;
  • production traffic resumed.
Shortly afterwards users began reporting that the system was noticeably slower than before.

Because this was a production environment, restoring service became the priority. I immediately started moving workloads back to the previous platform while collecting as much diagnostic information as possible.

Unfortunately, this node had not yet been connected to my monitoring system. Deploying monitoring was planned for the following day, so I have no historical graphs showing exactly when or how the degradation developed.

For that reason I cannot honestly claim that ZFS performance suddenly dropped from one specific value to another.
The only objective comparison I could make was against the previous production storage stack: KVM+ mdadm RAID1+ext4

The new Proxmox/OpenZFS installation performed significantly worse under the same production workload, which is what started this investigation.

Test environment
  • Lenovo ThinkServer RD350
  • 2 × Intel Xeon E5-2620 v4
  • 160 GB RAM
  • Broadcom / LSI MegaRAID SAS3 9364-8i (JBOD mode)
  • Samsung 870 EVO SSDs
  • Proxmox VE
  • Kernel 7.0.14-6-pve
  • OpenZFS 2.4.3-pve1

During the investigation I tried to isolate every possible variable rather than jumping to conclusions. Among the things I tested were:
  • different fio workloads
  • direct vs buffered I/O
  • psync, libaio and io_uring
  • datasets vs zvols
  • compression and checksum combinations
  • different recordsize values
  • pool recreation
  • mirror removal
  • comparison with two additional Proxmox systems running the same OpenZFS version
At one point I also observed acpi_pad kernel threads consuming significant CPU time, which initially made me suspect a kernel issue.

However, I was never able to reproduce that behavior reliably, and I no longer have enough evidence to conclude that acpi_pad was the root cause. It may simply have been a secondary symptom once the storage subsystem was already under heavy load.

One important finding was that the MegaRAID firmware was several releases behind Lenovo's current version.
The controller firmware was updated from 24.12.0-0033 to 24.21.0-0151 using Lenovo's official firmware package.

Since every system disk is attached to the controller, the update was performed from a Live Linux environment running entirely from RAM.

After the firmware update and rebuilding the test configuration, storage performance improved significantly.

Current sequential direct-write performance is consistently around 280 MiB/s, which is substantially better than the worst results observed during troubleshooting.

I cannot conclude that the firmware update alone resolved the original production issue, but it was the only major hardware change made during the investigation and all subsequent tests were performed using the updated firmware.

I'm attaching the outputs that I believe are the most useful for anyone investigating a similar issue:

  1. System and hardware information
  2. Storage controller and ZFS configuration
  3. Benchmark results and summary
One thing I learned during this investigation is that looking only at throughput (BW) can be misleading.

The most useful fields in the fio output turned out to be:
  • BW / IOPS
  • submission latency (slat)
  • completion latency (clat)
  • total latency
  • CPU usage (usr/sys)
  • bandwidth stability (min/max/stdev)
  • latency percentiles
Those values often explain where time is being spent, not just how fast the benchmark completed. I hope this summary may also help someone investigating a similar storage performance issue.
If anyone has additional ideas or would like me to run specific tests while this hardware is still available, I'll be happy to do so.
 

Attachments

  • Like
Reactions: _gabriel and UdoB
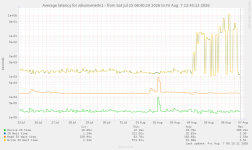
I am experiencing the same disk performance regression (particularly with write operations). However, I am not using ZFS, but LXC containers with attached LVM logical volumes formatted in EXT4.

The hypervisor was updated and rebooted on August 4, 2026, at ~10:30 AM. The kernel was upgraded from version 7.0.2-4-pve to 7.0.14-8-pve. The first disk latency alerts occurred the same day shortly before 2:00 PM. Since this is a pre-production environment, overall load and usage are low.
Note that the containers were updated at the same time, but none of those updates should account for this disk latency issue.

As for the physical server hardware:
  • CPU: AMD Ryzen 9 5900X 12-Core Processor
  • RAM: 128 GB ECC 2666 MHz
  • Storage: 2× 960 GB NVMe SSD SAMSUNG MZQL2960HCJR-00A07 in RAID 1 (mdadm)
I have not yet attempted to reboot into the old kernel. I will likely perform this test next week to confirm or rule out the source of the regression.
I have attached a graph showing the main disk's average latency, where the change in behavior is clearly visible.
 

Attachments

  • 2026-08-07_hypervior-disk-latency.png
    2026-08-07_hypervior-disk-latency.png
    71.3 KB · Views: 5
Welcome, @bdr
The issue you are describing may be (or may be not) other than the one in this thread.

Important question is whether you experience real regression in performance (proven e.g. with fio tests) or if it's only shown by statistics sources delivered by the kernel and read by a monitoring system (Munin in your case).

I'm asking because - as noticed in the thread I'm linking below:

"It's also possible that nothing is wrong in reality, and the statistics sources provided by the kernel are off for some reason - in particular I'm using data from /sys/block/<dev>/stat as parsed by the Munin diskstats module."

and

"Proxmox metrics and VM performance do not seems affected but munin start to show latency peeks"


Please read a similar case thread:
 
In fact, I think I'm in the same situation as the ticket you mentioned. After performance tests on both kernels (7.0.2-4-pve and 7.0.14-8-pve), I don't notice any major difference.

Bash:
# 7.0.2-4-pve
+ 4K random
  + read: IOPS=1141k, BW=4456MiB/s (4673MB/s)(240GiB/55149msec)
  + write: IOPS=330k, BW=1289MiB/s (1352MB/s)(75.5GiB/60003msec); 0 zone resets
+ sequential read/write
  + read: IOPS=11.5k, BW=11.3GiB/s (12.1GB/s)(10.0GiB/888msec)
  + write: IOPS=1421, BW=1421MiB/s (1490MB/s)(10.0GiB/7204msec); 0 zone resets

# 7.0.14-8-pve
+ 4K random
  + read: IOPS=1140k, BW=4455MiB/s (4671MB/s)(240GiB/55166msec)
  + write: IOPS=293k, BW=1143MiB/s (1198MB/s)(67.0GiB/60002msec); 0 zone resets
+ sequential read/write
  + read: IOPS=11.4k, BW=11.1GiB/s (11.9GB/s)(10.0GiB/901msec)
  + write: IOPS=1429, BW=1430MiB/s (1499MB/s)(10.0GiB/7162msec); 0 zone resets

Thank you for your help, and sorry for the noise caused by my response. I will add a comment to the ticket you pointed out.