Hi, I've a i5 4590 CPU, 16GB ram, 2x1TB velociraptor as Raid1, a Intel 3710 200GB as zil (16GB) and L2ARC (110GB). Arc RAM is limited to 4GB since I've not too much.
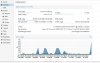
When I start a VM, the server load skyrockets to > 30-40, I've 3 VMs and I had to start one after the other, because if they start at the same time the server becomes unusable (100% CPU).
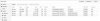
Here some details when I start only the first VM (4GB ram assigned, Win2003-32 bit, Virtio) and I have 32 of iowait:
sda and sdb are for raid1, while sdc is for zil and l2arc.
and
I'm very disappointed and scared by this, is the first time I try Proxmox ZFS on real hardware and pveperf fsync index was very good (> 5000).
Thanks for the help
When I start a VM, the server load skyrockets to > 30-40, I've 3 VMs and I had to start one after the other, because if they start at the same time the server becomes unusable (100% CPU).
Here some details when I start only the first VM (4GB ram assigned, Win2003-32 bit, Virtio) and I have 32 of iowait:
Code:
# iostat -x 2 5
avg-cpu:  %user  %nice %system %iowait  %steal  %idle
  7.02  0.00  3.62  32.41  0.00  56.94

Device:  rrqm/s  wrqm/s  r/s  w/s  rkB/s  wkB/s avgrq-sz avgqu-sz  await r_await w_await  svctm  %util
sda  0.04  0.00  124.86  21.15  8762.27  1118.12  135.34  1.18  8.09  9.27  1.13  4.20  61.31
sdb  0.03  0.00  123.95  21.12  8611.94  1118.12  134.15  1.18  8.14  9.34  1.15  4.21  61.10
sdc  0.00  0.00  7.59  205.97  203.32 12381.30  117.86  0.20  0.94  20.82  0.20  0.56  11.89
sdd  0.00  0.00  1.51  0.01  12.17  0.03  16.06  0.00  0.59  0.54  6.40  0.48  0.07
zd0  0.00  0.00  0.35  0.00  2.79  0.00  16.17  0.00  0.00  0.00  0.00  0.00  0.00
Code:
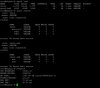
root@prox02:~# zpool iostat
  capacity  operations  bandwidth
pool  alloc  free  read  write  read  write
----------  -----  -----  -----  -----  -----  -----
rpool  417G  511G  208  100  13.6M  2.01M
#
Code:
root@prox02:~# zpool iostat -v
  capacity  operations  bandwidth
pool  alloc  free  read  write  read  write
--------------------------------------------------  -----  -----  -----  -----  -----  -----
rpool  417G  511G  216  101  14.1M  2.04M
  mirror  417G  511G  216  74  14.1M  1.11M
  sda2  -  -  104  21  7.15M  1.13M
  sdb2  -  -  103  21  7.01M  1.13M
logs  -  -  -  -  -  -
  sdc1  23.2M  16.6G  0  27  2.93K  945K
cache  -  -  -  -  -  -
  ata-INTEL_SSDSC2BA200G4_BTHV52640CXE200MGN-part2  4.43G  107G  6  136  174K  9.60M
--------------------------------------------------  -----  -----  -----  -----  -----  -----
I'm very disappointed and scared by this, is the first time I try Proxmox ZFS on real hardware and pveperf fsync index was very good (> 5000).
Thanks for the help