Zabbix template
- Thread starter curly882
- Start date
You are using an out of date browser. It may not display this or other websites correctly.
You should upgrade or use an alternative browser.
You should upgrade or use an alternative browser.
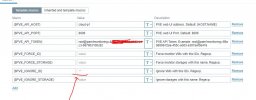
If you don't want to monitor guests (so VMs and LXCs) at all you can use the regex valueHey
how can I disable tracking of vm machines?
.* for the macro {$PVE_IGNORE_ID}.If you just want to monitor your LXCs but no VMs, you would need to block all the IDs of all VMs using the macro
{$PVE_IGNORE_ID} too. Easiest would be if you give all your VMs a VMID of 2000-2999 and all LXCs a VMID of 1000-1999. That way you could block the complete VMID range of all VM with a value like ^2[0-9][0-9][0-9]$ instead of blocking all individual VMIDs like for example ^(102|103|105|106|107|108|109|110|111|113|115|116|117|118|119|120|122|123|124|125|134)$.Most of my guests are VMs, so it was easier to me to just whitelist the few LXCs that I want to monitor, so I first blocked all guests by using
{$PVE_IGNORE_ID} = .* and then I whitelisted the LXCs like this {$PVE_FORCE_ID} = ^(100|101|121|126|133)$
Last edited:

I added "*" but the vm information keeps showing. Am I doing something wrong?If you don't want to monitor guests (so VMs and LXCs) at all you can use the regex value.*for the macro{$PVE_IGNORE_ID}.
If you just want to monitor your LXCs but no VMs, you would need to block all the IDs of all VMs using the macro{$PVE_IGNORE_ID}too. Easiest would be if you give all your VMs a VMID of 2000-2999 and all LXCs a VMID of 1000-1999. That way you could block the complete VMID range of all VM with a value like2[0-9][0-9][0-9]instead of blocking all individual VMIDs like for example^(102|103|105|106|107|108|109|110|111|113|115|116|117|118|119|120|122|123|124|125|134)$.
Most of my guests are VMs, so it was easier to me to just whitelist the few LXCs that I want to monitor, so I first blocked all guests by using{$PVE_IGNORE_ID} = .*and then I whitelisted the LXCs like this{$PVE_FORCE_ID} = ^(100|101|121|126|133)$
Attachments
A ".*" should be fine. But keep in mind that these filters will only prevent the template from discovering. If you already discovered all the VMs they will continue to be monitored. So in order to really make use of it you need to remove the template first from your host (Configuration -> Hosts -> YourHostsName -> Templates -> right side of "Proxmox VE by HTTP" click the "unlink and clear" and then click the "update" button) and add the template again afterwards.I added "*" but the vm information keeps showing. Am I doing something wrong?
Last edited:
Thank youA ".*" should be fine. But keep in mind that this filters will only prevent the template from discovering. If you already discovered all the VMs they will continue to be monitored. So in order to really make use of it you need to remove the template first from your host (Configuration -> Hosts -> YourHostsName -> Templates -> right side of "Proxmox VE by HTTP" click the "unlink and clear" and then click the "update" button) and add the template again afterwards.
Hi all,
@vashvampir great work.
I have question - some lxc's has got additional disk (mount point), how to monitor usage of this disk ?
Wojtek
@vashvampir great work.
I have question - some lxc's has got additional disk (mount point), how to monitor usage of this disk ?
Wojtek
I'Ve upgraded to Zabbix 6.0 LTS and looks there are some new problems:
1.) looks like used RAM/Storage percentage are now wrong. For example instead of a 30% I now see 0.3019 %. I think the numbers would be right after multiplying with 100 and rounding.
2.) Its hard to view the PVE statistics because there is no "Application" filter in the "see latest results" anymore. Previously I would select there "PVE ct" if I wanted to see LXC statistics. That is now gone and I need to filter results by "Tag" and looks like your template isn't using tags.
Last edited:
Hi all! I apologize, I did not appear here at first because of the coronovirus, and then because I was sent on a "business trip" to the border of Russia and Ukraine (these are the disadvantages of working as a system administrator for the government of the country)...
The template does not use tags, I will add it soon. Probably combined with a rework for fresh Zabbix.
By the way, now my git is unavailable, I will raise it tomorrow. Will be available at the new address https://git.ismv.ru
The template should monitor zfs using autodiscovery. Can you screenshot the pve storage discovery items?Hi
template from "vashvampir" can't monitor lvm /zfs storage where vm is located? or am I doing something wrong?
This requires the template to be modified. Thanks for the feedback, I'll try to implement detection not only of the container system disk.Hi all,
@vashvampir great work.
I have question - some lxc's has got additional disk (mount point), how to monitor usage of this disk ?
Wojtek
This requires the refinement of the template for Zabbix 6. As soon as we switch to the new version at work, I will remake it.I'Ve upgraded to Zabbix 6.0 LTS and looks there are some new problems:
1.) looks like used RAM/Storage percentage are now wrong. For example instead of a 30% I now see 0.3019 %. I think the numbers would be right after multiplying with 100 and rounding.
2.) Its hard to view the PVE statistics because there is no "Application" filter in the "see latest results" anymore. Previously I would select there "PVE ct" if I wanted to see LXC statistics. That is now gone and I need to filter results by "Tag" and looks like your template isn't using tags.
The template does not use tags, I will add it soon. Probably combined with a rework for fresh Zabbix.
By the way, now my git is unavailable, I will raise it tomorrow. Will be available at the new address https://git.ismv.ru
Last edited:
The implementation of Zabbix 6 and Proxmox Backup Server is planned at my work for the end of March - beginning of April. Then I will start adapting the template for fresh Zabbix and will make the template for PBSI'Ve upgraded to Zabbix 6.0 LTS and looks there are some new problems:
1.) looks like used RAM/Storage percentage are now wrong. For example instead of a 30% I now see 0.3019 %. I think the numbers would be right after multiplying with 100 and rounding.
2.) Its hard to view the PVE statistics because there is no "Application" filter in the "see latest results" anymore. Previously I would select there "PVE ct" if I wanted to see LXC statistics. That is now gone and I need to filter results by "Tag" and looks like your template isn't using tags.
How long the update will take - I can’t say for sure yet, it’s very difficult to guess what will go wrong when updating Zabbix, which monitors about 15k virtual machines
Last edited:
Hi!
Zabbix team develop Integration with Proxmox.
https://support.zabbix.com/browse/ZBXNEXT-7506
Please register and vote for this issue")
Zabbix team develop Integration with Proxmox.
https://support.zabbix.com/browse/ZBXNEXT-7506
Please register and vote for this issue
Added a comment in Zabbix Jira that in theory they can use my template as the basis for the official template.Hi!
Zabbix team develop Integration with Proxmox.
https://support.zabbix.com/browse/ZBXNEXT-7506
Please register and vote for this issue
ZBXNEXT-7506 status changed to "Resolved" and i've found template in ZBXNEXT-7506-6.0 branch in Zabbix git (added by commit 93a1f02092ba7d4a3288f08772fabfed0943ccad by Alexander Bakaldin)
Perhaps the template will officially appear in Zabbix 6.0.3 (according to Fix Version/s in their jira)
Perhaps the template will officially appear in Zabbix 6.0.3 (according to Fix Version/s in their jira)
"ceph-mgr Zabbix module" via https://docs.ceph.com/en/latest/mgr/zabbix/How are people monitoring CEPH on their proxmox clusters? The default "Ceph by Zabbix Agent 2" quickly goes "unsupported" when added to a PMX host.
Migrated repo from git.isaev.tech to https://github.com/ismvru/zbx-tmplt-pve
Created new template - Proxmox Backup Server by HTTP. https://github.com/ismvru/zbx-tmplt-pbs
Sample latest data:

Sample latest data:
Last edited:
Tried it but looks like only the "PBS: version" and "PBS: API ping" can be monitored. "PBS: Node status" shows the error "Response code "403" did not match any of the required status codes "200"". But when I look at the URL of the item and put my macros in that URL and open the URL in my browser I get this:
Code:
{"data":{"cpu":0.013017751479289963,"cpuinfo":{"cpus":3,"model":"Intel(R) Xeon(R) CPU E3-1230 v3 @ 3.30GHz","sockets":1},"info":{"fingerprint":"xx:xx:xx:xx:xx:xx:xx"},"kversion":"Linux 5.15.39-4-pve #1 SMP PVE 5.15.39-4 (Mon, 08 Aug 2022 15:11:15 +0200)","loadavg":[0.01,0.0,0.0],"memory":{"free":1058140160,"total":2071568384,"used":1013428224},"root":{"avail":24949886976,"total":33105428480,"used":6447726592},"swap":{"free":4292866048,"total":4292866048,"used":0},"uptime":537764,"wait":0.0}}
Last edited:
Try to set Audit permissions to / for your token in PBS Configuraion -> Access Control -> PermissionsTried it but looks like only the "PBS: version" and "PBS: API ping" can be monitored. "PBS: Node status" shows the error "Response code "403" did not match any of the required status codes "200"". But when I look at the URL of the item and put my macros in that URL and open the URL in my browser I get this:
Code:{"data":{"cpu":0.013017751479289963,"cpuinfo":{"cpus":3,"model":"Intel(R) Xeon(R) CPU E3-1230 v3 @ 3.30GHz","sockets":1},"info":{"fingerprint":"xx:xx:xx:xx:xx:xx:xx"},"kversion":"Linux 5.15.39-4-pve #1 SMP PVE 5.15.39-4 (Mon, 08 Aug 2022 15:11:15 +0200)","loadavg":[0.01,0.0,0.0],"memory":{"free":1058140160,"total":2071568384,"used":1013428224},"root":{"avail":24949886976,"total":33105428480,"used":6447726592},"swap":{"free":4292866048,"total":4292866048,"used":0},"uptime":537764,"wait":0.0}}
I also thought about that. But I created a new token for it with "Audit" for "/" and copy pasted it to "{$PBS.TOKEN.ID}" and "{$PBS.TOKEN.SECRET}" so I guess that should work.Try to set Audit permissions to / for your token in PBS Configuraion -> Access Control -> Permissions
Edit:
Yes, looks like permission problems. The PBS log shows this:
Aug 29 17:22:55 PBS proxmox-backup-proxy[594]: GET /api2/json/nodes/PBS/status: 403 Forbidden: [client [::ffff:192.168.43.70]:47816] permission check failed
Last edited: