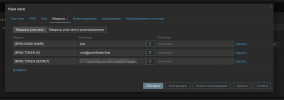
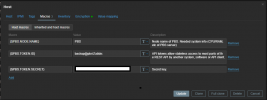
Zabbix template

When changing the tokens permission from "Audit" to "Admin" it will be able to monitor my datastores but "node status" still fails with error 403. So when polling datastore infos is possible the IP, port, node name, token name and token secret should be fine, right? Maybe the "::fff:" of the PBS syslog message is a problem?
Aug 29 17:23:54 PBS proxmox-backup-proxy[594]: GET /api2/json/nodes/PBS/status: 403 Forbidden: [client [::ffff:192.168.43.70]:47826] permission check failed
 
Last edited:
can you try to open /api2/json/nodes in your browser? node name there is in upper case?
When changing the tokens permission from "Audit" to "Admin" it will be able to monitor my datastores but "node status" still fails with error 403. Maybe the "::fff:" of the PBS syslog message is a problem?
Aug 29 17:23:54 PBS proxmox-backup-proxy[594]: GET /api2/json/nodes/PBS/status: 403 Forbidden: [client [::ffff:192.168.43.70]:47826] permission check failed
 
I guess there really is a problem with the node name. Because URL of datastore discovery works and doesn`t make use of node names.

I tested different node names in browser and all return the status page with correct metrics:

https://192.168.43.63:8007/api2/json/nodes/foo/status -> works, but shouldn`t as its definitely not names "foo"
https://192.168.43.63:8007/api2/json/nodes/pbs/status -> works
https://192.168.43.63:8007/api2/json/nodes/PBS/status -> works

Not sure how my node is named. I thought it should be "PBS" because that is what my PBS got this in its "/etc/host" file. Is there a way to see the node name? Wasn't able to find it in the webUI.
I don't know how to see node name in Web ui... You can see it in /api2/json/nodes page.

I'm not sure if the problem is in this api endpoint, maybe the problem is in the template. What version of pbs do you have installed?
 
I don't know how to see node name in Web ui... You can see it in /api2/json/nodes page.
https://192.168.43.63:8007/api2/json/nodes returns {"data":[{"node":"PBS"}]} so "PBS" I used as "{$PBS.NODE.NAME}" should be fine.
I'm not sure if the problem is in this api endpoint, maybe the problem is in the template. What version of pbs do you have installed?
Its the latest "Backup Server 2.2-5" with everything updated. Zabbix Server is 6.0.7 and PBS uses "zabbix-agentd" 6.0.7. Both are from the 6.X LTS repo for debian.

Edit:
Updated zabbix server and client now to latest 6.0.8 LTS and rebooted both Zabbix server and PBS but still the same problem.
 
Last edited:
pbs1.pngpbs2.pngpbs3.pngpbs4.pngpbs5.png
When accessed from a browser where I'm logged in to PBS as root@pam:
pbs6.png

When accessed from a browser where I'm not logged in to PBS:
pbs7.png
 
Last edited:
View attachment 40489View attachment 40490View attachment 40491View attachment 40492View attachment 40493
When accessed from a browser where I'm logged in to PBS as root@pam:
View attachment 40494

When accessed from a browser where I'm not logged in to PBS:
View attachment 40495
You have issued a token on behalf of the user backup@pbs , which has rights: DatastorePowerUser . In order for node monitoring to work, you must either issue a token on behalf of root@pam, or give Audit rights to the user backup@pbs.
 
  • Like
Reactions: Dunuin
Your are right. With "root@pam!Zabbix" and the same permissions for the token it works.
But now I'm unsure if that's a good idea. I want my Zabbix token to have as less privileges as needed. Would a "root@pam!Zabbix" with "Audit" for "/" really only got the privileges to audit stuff or does it inherit rights from the root user?
I think that in PBS, assigning permissions to a token really limits the ability to use the token. But not sure, we need to ask Proxmox Staff.
Well, or put a couple of experiments with the API :)

UPD. To be honest, I haven't studied the PBS API much, only in terms of monitoring. It is even possible to reduce the rights of the token for monitoring from Audit to some completely Readonly
 
Last edited:
Created a new User "zabbix@pbs" with privilege "Audit" for "/" and also a Token "zabbix@pbs!Audit" with privilege "Audit" for "/" to be on the save side. Looks like that is working too.
 
Created a new User "zabbix@pbs" with privilege "Audit" for "/" and also a Token "zabbix@pbs!Audit" with privilege "Audit" for "/" to be on the save side. Looks like that is working too.
Great, thanks, I need to remember that this can be done.

I think, it is necessary to add something else to this template or not?

UPD

Looked at the API documentation and realized that:

1. /api2/json/version is accessible by all authenticated users. Any user with token can access this API endpoint.
2. /api2/json/ping is accessible by all.
3. /api2/json/nodes/NODE_NAME/status is accessible by users who has privilege "Audit" for /system/status.
2. /api2/json/status/datastore-usage is accessible by users who has privilege "Audit" for /datastore

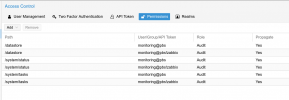
UPD2. Minimum privileges that the template works with

1661795903164.png
 
Last edited:
I guess for most stuff you could use other templates. Like ZFS template for ZFS pool monitoring, APT template for update monitoring, Linux template for disk/CPU/RAM/NIC/filesystem monitoring, ...

Most interesting would be PBS specific features like datastore space monitoring what you already got.
Great would be a trigger for failed jobs, so you don't have to login to PBS webUI to have a look at the "Task summary (30 days)" to see if a sync/backup/Gc/prune/verify job failed recently. I also don't like that task summary because it keeps the errors for 30 days so you have to keep in mind how much failed job there were yesterday and compare that to today. Would be great if your template could keep track of the numbers of failed jobs and then could trigger a warning in case it increased since the last update.
I can count the number of tasks with status != OK in /api2/json/nodes/NODE_NAME/tasks.
Can you see if this is what you need?
 
I guess for most stuff you could use other templates. Like ZFS template for ZFS pool monitoring, APT template for update monitoring, Linux template for disk/CPU/RAM/NIC/filesystem monitoring, ...

Most interesting would be PBS specific features like datastore space monitoring what you already got.
Great would be a trigger for failed jobs, so you don't have to login to PBS webUI to have a look at the "Task summary (30 days)" to see if a sync/backup/Gc/prune/verify job failed recently. I also don't like that task summary because it keeps the errors for 30 days so you have to keep in mind how much failed job there were yesterday and compare that to today. Would be great if your template could keep track of the numbers of failed jobs and then could trigger a warning in case it increased since the last update.
Added new item and trigger with count of failed tasks since install (i hope that PBS doesn't remove task history...)
New permission: /system/tasks - Audit

UPD
1. Api request: /nodes/{$PBS.NODE.NAME}/tasks?errors=true&limit=0
2. Current minimal permissions for user and token:
1661797544884.png
 
Last edited:
  • Like
Reactions: Dunuin
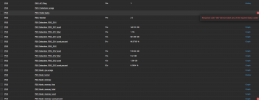
Something isn't working there with logging failed tasks as failed task counter is quite high, got up and down but got no non-OK task results for weeks according to the webUI:
pbs8.png
pbs9.png
 
Something isn't working there with logging failed tasks as failed task counter is quite high, got up and down but got no non-OK task results for weeks according to the webUI:
View attachment 40511
View attachment 40512
I think it can slightly redo the logic of work and look for failed tasks, for example, from the beginning of the day? Then there will be a history of failed daily tasks, with the value reset to 0 at 00:00.
 
Daily reset of the failed tasks to 0 at 00:00 should be fine as long as the alerts won't get autocleared when it drops to 0 again. So that users will even notice the failed jobs when not logged in to zabbix webUI for 24 hours.
 

About

The Proxmox community has been around for many years and offers help and support for Proxmox VE, Proxmox Backup Server, and Proxmox Mail Gateway.
We think our community is one of the best thanks to people like you!

Get your subscription!

The Proxmox team works very hard to make sure you are running the best software and getting stable updates and security enhancements, as well as quick enterprise support. Tens of thousands of happy customers have a Proxmox subscription. Get yours easily in our online shop.

Buy now!