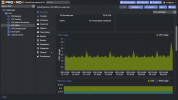
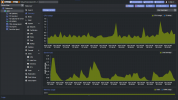
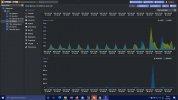
So... new user here. I noticed that for some reason when I wanted to look at the charts on the 'Summary' section for a given VM, I can't seem to scroll down or see all the chart on the default zoom of 110% on my Chromebook. I had to keep reducing the zoom down to 70-75% before I could see all the graphs and axis for the graphs - there never was any scrolling in that 'pane'.
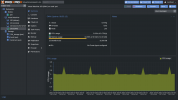
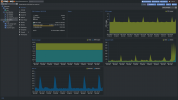
Is there something I'm doing wrong here, or is this a known, existing 'feature'/bug? Or is there somewhere I should file a ticket about this sort of thing?


Is there something I'm doing wrong here, or is this a known, existing 'feature'/bug? Or is there somewhere I should file a ticket about this sort of thing?


