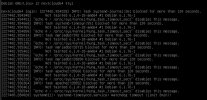
VMs hung after backup

Sorry, I have to correct.

The backup of the VM happened yesterday at 22:30 and afterwards it worked fine until 04:05. Last journal entries:
Code:
...
Mar 19 04:05:02 nextcloud64 qemu-ga[621]: info: guest-ping called
Mar 19 04:05:03 nextcloud64 qemu-ga[621]: info: guest-fsfreeze called
Mar 19 04:05:08 nextcloud64 qemu-ga[621]: info: guest-ping called
Mar 19 04:05:09 nextcloud64 qemu-ga[621]: info: guest-fsfreeze called
(vm stop & start by me)
-- Boot a6539a246aee4e9d8bd2ab2c7b1cec86 --
Mar 19 07:02:37 nextcloud64 kernel: Linux version 6.1.0-18-amd64 (debian-kernel@lists.debian.org) (gcc-12 (Debian 12.2.0-14) 12.2.0, GNU ld (GNU Binutils for Debian) 2.40) #1 SMP PREEMPT_DYNAMIC Debian 6.1.76-1 (2024-02-01)
...

So it seems the hanging was not caused by PBS, at least not directly.

Is there anything special about this VM compared to other VMs? Did the same VM already fail multiple times?

It was the only VM that failed on a pbs backup. Nothing special, just the VM used the most on this cluster.
 
Last edited:
Sorry, I have to correct.

The backup of the VM happened yesterday at 22:30 and afterwards it worked fine until 04:05. Last journal entries:
Code:
...
Mar 19 04:05:02 nextcloud64 qemu-ga[621]: info: guest-ping called
Mar 19 04:05:03 nextcloud64 qemu-ga[621]: info: guest-fsfreeze called
Mar 19 04:05:08 nextcloud64 qemu-ga[621]: info: guest-ping called
Mar 19 04:05:09 nextcloud64 qemu-ga[621]: info: guest-fsfreeze called
(vm stop & start by me)
-- Boot a6539a246aee4e9d8bd2ab2c7b1cec86 --
Mar 19 07:02:37 nextcloud64 kernel: Linux version 6.1.0-18-amd64 (debian-kernel@lists.debian.org) (gcc-12 (Debian 12.2.0-14) 12.2.0, GNU ld (GNU Binutils for Debian) 2.40) #1 SMP PREEMPT_DYNAMIC Debian 6.1.76-1 (2024-02-01)
...

So it seems the hanging was not caused by PBS, at least not directly.
There are two fsfreeze calls right after each other. What happened around that time? Snapshot?

Please check the host's system log/journal between start of the PBS backup and the restart of the VM.
 
No, nothing particular was going on at that time. No backup, no snapshot. No load on VM and also nothing on host (also no pbs activities).

I think that the guest agent is calling those freezes for the replication, which happens every minute to both other nodes.

guest journal before and after reboot:
Code:
Mar 19 01:46:00 nextcloud64 qemu-ga[621]: info: guest-ping called
Mar 19 01:46:01 nextcloud64 qemu-ga[621]: info: guest-fsfreeze called
Mar 19 01:46:07 nextcloud64 qemu-ga[621]: info: guest-ping called
Mar 19 01:46:07 nextcloud64 qemu-ga[621]: info: guest-fsfreeze called
Mar 19 01:47:00 nextcloud64 qemu-ga[621]: info: guest-ping called
Mar 19 01:47:01 nextcloud64 qemu-ga[621]: info: guest-fsfreeze called
Mar 19 01:47:06 nextcloud64 qemu-ga[621]: info: guest-ping called
Mar 19 01:47:07 nextcloud64 qemu-ga[621]: info: guest-fsfreeze called
Mar 19 01:48:00 nextcloud64 qemu-ga[621]: info: guest-ping called
Mar 19 01:48:02 nextcloud64 qemu-ga[621]: info: guest-fsfreeze called
Mar 19 01:48:07 nextcloud64 qemu-ga[621]: info: guest-ping called
Mar 19 01:48:08 nextcloud64 qemu-ga[621]: info: guest-fsfreeze called
Mar 19 01:49:00 nextcloud64 qemu-ga[621]: info: guest-ping called
Mar 19 01:49:01 nextcloud64 qemu-ga[621]: info: guest-fsfreeze called
Mar 19 01:49:06 nextcloud64 qemu-ga[621]: info: guest-ping called
Mar 19 01:49:07 nextcloud64 qemu-ga[621]: info: guest-fsfreeze called
Mar 19 01:50:00 nextcloud64 qemu-ga[621]: info: guest-ping called
Mar 19 01:50:01 nextcloud64 qemu-ga[621]: info: guest-fsfreeze called
Mar 19 01:50:06 nextcloud64 qemu-ga[621]: info: guest-ping called
Mar 19 01:50:07 nextcloud64 qemu-ga[621]: info: guest-fsfreeze called
Mar 19 01:51:00 nextcloud64 qemu-ga[621]: info: guest-ping called
Mar 19 01:51:01 nextcloud64 qemu-ga[621]: info: guest-fsfreeze called
Mar 19 01:51:06 nextcloud64 qemu-ga[621]: info: guest-ping called
Mar 19 01:51:07 nextcloud64 qemu-ga[621]: info: guest-fsfreeze called
Mar 19 01:52:00 nextcloud64 qemu-ga[621]: info: guest-ping called
Mar 19 01:52:01 nextcloud64 qemu-ga[621]: info: guest-fsfreeze called
Mar 19 01:52:06 nextcloud64 qemu-ga[621]: info: guest-ping called
Mar 19 01:52:07 nextcloud64 qemu-ga[621]: info: guest-fsfreeze called
Mar 19 01:53:00 nextcloud64 qemu-ga[621]: info: guest-ping called
Mar 19 01:53:01 nextcloud64 qemu-ga[621]: info: guest-fsfreeze called
Mar 19 01:53:06 nextcloud64 qemu-ga[621]: info: guest-ping called
Mar 19 01:53:07 nextcloud64 qemu-ga[621]: info: guest-fsfreeze called
Mar 19 01:54:00 nextcloud64 qemu-ga[621]: info: guest-ping called
Mar 19 01:54:02 nextcloud64 qemu-ga[621]: info: guest-fsfreeze called
Mar 19 01:54:07 nextcloud64 qemu-ga[621]: info: guest-ping called
Mar 19 01:54:07 nextcloud64 qemu-ga[621]: info: guest-fsfreeze called
Mar 19 01:55:00 nextcloud64 qemu-ga[621]: info: guest-ping called
Mar 19 01:55:01 nextcloud64 qemu-ga[621]: info: guest-fsfreeze called
Mar 19 01:55:06 nextcloud64 qemu-ga[621]: info: guest-ping called
Mar 19 01:55:07 nextcloud64 qemu-ga[621]: info: guest-fsfreeze called
Mar 19 01:56:00 nextcloud64 qemu-ga[621]: info: guest-ping called
Mar 19 01:56:01 nextcloud64 qemu-ga[621]: info: guest-fsfreeze called
Mar 19 01:56:06 nextcloud64 qemu-ga[621]: info: guest-ping called
Mar 19 01:56:07 nextcloud64 qemu-ga[621]: info: guest-fsfreeze called
Mar 19 01:57:00 nextcloud64 qemu-ga[621]: info: guest-ping called
Mar 19 01:57:01 nextcloud64 qemu-ga[621]: info: guest-fsfreeze called
Mar 19 01:57:06 nextcloud64 qemu-ga[621]: info: guest-ping called
Mar 19 01:57:07 nextcloud64 qemu-ga[621]: info: guest-fsfreeze called
Mar 19 01:58:00 nextcloud64 qemu-ga[621]: info: guest-ping called
Mar 19 01:58:02 nextcloud64 qemu-ga[621]: info: guest-fsfreeze called
Mar 19 01:58:07 nextcloud64 qemu-ga[621]: info: guest-ping called
Mar 19 01:58:08 nextcloud64 qemu-ga[621]: info: guest-fsfreeze called
Mar 19 01:59:00 nextcloud64 qemu-ga[621]: info: guest-ping called
Mar 19 01:59:01 nextcloud64 qemu-ga[621]: info: guest-fsfreeze called
Mar 19 01:59:06 nextcloud64 qemu-ga[621]: info: guest-ping called
Mar 19 01:59:07 nextcloud64 qemu-ga[621]: info: guest-fsfreeze called
Mar 19 02:00:00 nextcloud64 qemu-ga[621]: info: guest-ping called
Mar 19 02:00:01 nextcloud64 qemu-ga[621]: info: guest-fsfreeze called
Mar 19 02:00:06 nextcloud64 qemu-ga[621]: info: guest-ping called
Mar 19 02:00:07 nextcloud64 qemu-ga[621]: info: guest-fsfreeze called
Mar 19 02:01:00 nextcloud64 qemu-ga[621]: info: guest-ping called
Mar 19 02:01:01 nextcloud64 qemu-ga[621]: info: guest-fsfreeze called
Mar 19 02:01:06 nextcloud64 qemu-ga[621]: info: guest-ping called
Mar 19 02:01:07 nextcloud64 qemu-ga[621]: info: guest-fsfreeze called
Mar 19 02:02:00 nextcloud64 qemu-ga[621]: info: guest-ping called
Mar 19 02:02:01 nextcloud64 qemu-ga[621]: info: guest-fsfreeze called
Mar 19 02:02:07 nextcloud64 qemu-ga[621]: info: guest-ping called
Mar 19 02:02:08 nextcloud64 qemu-ga[621]: info: guest-fsfreeze called
Mar 19 02:03:00 nextcloud64 qemu-ga[621]: info: guest-ping called
Mar 19 02:03:01 nextcloud64 qemu-ga[621]: info: guest-fsfreeze called
Mar 19 02:03:06 nextcloud64 qemu-ga[621]: info: guest-ping called
Mar 19 02:03:07 nextcloud64 qemu-ga[621]: info: guest-fsfreeze called
Mar 19 02:04:00 nextcloud64 qemu-ga[621]: info: guest-ping called
Mar 19 02:04:01 nextcloud64 qemu-ga[621]: info: guest-fsfreeze called
Mar 19 02:04:06 nextcloud64 qemu-ga[621]: info: guest-ping called
Mar 19 02:04:07 nextcloud64 qemu-ga[621]: info: guest-fsfreeze called
Mar 19 02:05:00 nextcloud64 qemu-ga[621]: info: guest-ping called


Mar 19 07:15:03 nextcloud64 qemu-ga[592]: info: guest-fsfreeze called
Mar 19 07:15:08 nextcloud64 qemu-ga[592]: info: guest-ping called
Mar 19 07:15:09 nextcloud64 qemu-ga[592]: info: guest-fsfreeze called
Mar 19 07:16:02 nextcloud64 qemu-ga[592]: info: guest-ping called
Mar 19 07:16:03 nextcloud64 qemu-ga[592]: info: guest-fsfreeze called
Mar 19 07:16:09 nextcloud64 qemu-ga[592]: info: guest-ping called
Mar 19 07:16:09 nextcloud64 qemu-ga[592]: info: guest-fsfreeze called
Mar 19 07:17:02 nextcloud64 qemu-ga[592]: info: guest-ping called
Mar 19 07:17:03 nextcloud64 qemu-ga[592]: info: guest-fsfreeze called
Mar 19 07:17:08 nextcloud64 qemu-ga[592]: info: guest-ping called
Mar 19 07:17:09 nextcloud64 qemu-ga[592]: info: guest-fsfreeze called
Mar 19 07:18:02 nextcloud64 qemu-ga[592]: info: guest-ping called
Mar 19 07:18:03 nextcloud64 qemu-ga[592]: info: guest-fsfreeze called
Mar 19 07:18:08 nextcloud64 qemu-ga[592]: info: guest-ping called
Mar 19 07:18:09 nextcloud64 qemu-ga[592]: info: guest-fsfreeze called
Mar 19 07:20:08 nextcloud64 qemu-ga[592]: info: guest-ping called
Mar 19 07:20:09 nextcloud64 qemu-ga[592]: info: guest-fsfreeze called
Mar 19 07:20:14 nextcloud64 qemu-ga[592]: info: guest-ping called
Mar 19 07:20:15 nextcloud64 qemu-ga[592]: info: guest-fsfreeze called
Mar 19 07:21:08 nextcloud64 qemu-ga[592]: info: guest-ping called
Mar 19 07:21:09 nextcloud64 qemu-ga[592]: info: guest-fsfreeze called
Mar 19 07:21:15 nextcloud64 qemu-ga[592]: info: guest-ping called
Mar 19 07:21:15 nextcloud64 qemu-ga[592]: info: guest-fsfreeze called
Mar 19 07:22:08 nextcloud64 qemu-ga[592]: info: guest-ping called
Mar 19 07:22:09 nextcloud64 qemu-ga[592]: info: guest-fsfreeze called
Mar 19 07:22:14 nextcloud64 qemu-ga[592]: info: guest-ping called
Mar 19 07:22:15 nextcloud64 qemu-ga[592]: info: guest-fsfreeze called
Mar 19 07:23:09 nextcloud64 qemu-ga[592]: info: guest-ping called
Mar 19 07:23:09 nextcloud64 qemu-ga[592]: info: guest-fsfreeze called
Mar 19 07:23:15 nextcloud64 qemu-ga[592]: info: guest-ping called
Mar 19 07:23:16 nextcloud64 qemu-ga[592]: info: guest-fsfreeze called
Mar 19 07:24:08 nextcloud64 qemu-ga[592]: info: guest-ping called
Mar 19 07:24:09 nextcloud64 qemu-ga[592]: info: guest-fsfreeze called
Mar 19 07:24:14 nextcloud64 qemu-ga[592]: info: guest-ping called
Mar 19 07:24:15 nextcloud64 qemu-ga[592]: info: guest-fsfreeze called

journal on host does not seem to contain anything relevant. Many ssh sessions from the other nodes (again, for replication most probably). Around 4:05 nothing special happens.
 
I think that the guest agent is calling those freezes for the replication, which happens every minute to both other nodes.
Right, that explains the guest agent calls. Question is if there is a rare issue where the thaw failed for some reason and the hung tasks are related to that or if they have another cause. It's unfortunate that there is no further hint in the logs.

Should it happen again, could you try issuing
Code:
qm guest cmd 107 fsfreeze-status
qm guest cmd 107 fsfreeze-thaw
?
 
Yes, I will do that and report back here if the problem occurs again.

It would have been helpful, if thaw commands would also be logged, maybe this is something that can be implemented in the future.

Thanks for your help.
 
It would have been helpful, if thaw commands would also be logged, maybe this is something that can be implemented in the future.
The guest agent is not developed by Proxmox VE, but comes from your distro. So this would need be changed in the QEMU guest agent upstream. Didn't check, but it might just be that it can't log receiving the thaw command, because the log file is on the frozen filesystem.
 
The latest patches to qemu and the kernel have not fixed the deadlocked processes during backups for me. Every time it gets to a large data transfer during a backup, the backup process and all the VMs go into D state.

Code:
# ps -eo s,pid,user,comm | grep '^D'
D    1489 root     pvestatd
D    1580 root     kvm
D    1824 root     kvm
D    2956 root     kmmpd-loop0
D    2977 100000   systemd
D    3074 root     kmmpd-loop1
D    3124 100000   systemd
D    3181 100000   systemd-journal
D    3420 100000   systemd-journal
D    4591 root     kmmpd-loop2
D    4667 100000   systemd
D    4847 100000   systemd-journal
D    5210 100000   nmbd
D    5257 100000   smbd
D    5260 100000   smbd-notifyd
D    5261 100000   cleanupd
D  404488 root     kworker/u16:0+loop0
D  446740 root     kworker/u16:6+loop0
D  448343 100100   pickup
D  448344 100100   qmgr
D  448412 root     kworker/u16:7+loop2
D  453559 root     kworker/u16:1+loop1
D  457542 root     kworker/u16:8+loop2
D  459212 100100   qmgr
D  459213 100100   pickup
D  463042 100100   pickup
D  463043 100100   qmgr
D  464088 100000   tar
D  464129 root     kworker/u16:5+loop1

Code:
# pveversion --verbose
proxmox-ve: 8.1.0 (running kernel: 6.5.13-3-pve)
pve-manager: 8.1.5 (running version: 8.1.5/60e01c6ac2325b3f)
proxmox-kernel-helper: 8.1.0
pve-kernel-5.15: 7.4-10
proxmox-kernel-6.5.13-3-pve-signed: 6.5.13-3
proxmox-kernel-6.5: 6.5.13-3
proxmox-kernel-6.5.13-1-pve-signed: 6.5.13-1
pve-kernel-5.15.136-1-pve: 5.15.136-1
pve-kernel-5.15.102-1-pve: 5.15.102-1
ceph-fuse: 16.2.11+ds-2
corosync: 3.1.7-pve3
criu: 3.17.1-2
glusterfs-client: 10.3-5
ifupdown2: 3.2.0-1+pmx8
ksm-control-daemon: 1.4-1
libjs-extjs: 7.0.0-4
libknet1: 1.28-pve1
libproxmox-acme-perl: 1.5.0
libproxmox-backup-qemu0: 1.4.1
libproxmox-rs-perl: 0.3.3
libpve-access-control: 8.1.2
libpve-apiclient-perl: 3.3.1
libpve-cluster-api-perl: 8.0.5
libpve-cluster-perl: 8.0.5
libpve-common-perl: 8.1.1
libpve-guest-common-perl: 5.0.6
libpve-http-server-perl: 5.0.5
libpve-network-perl: 0.9.5
libpve-rs-perl: 0.8.8
libpve-storage-perl: 8.1.0
libspice-server1: 0.15.1-1
lvm2: 2.03.16-2
lxc-pve: 5.0.2-4
lxcfs: 5.0.3-pve4
novnc-pve: 1.4.0-3
proxmox-backup-client: 3.1.4-1
proxmox-backup-file-restore: 3.1.4-1
proxmox-kernel-helper: 8.1.0
proxmox-mail-forward: 0.2.3
proxmox-mini-journalreader: 1.4.0
proxmox-widget-toolkit: 4.1.4
pve-cluster: 8.0.5
pve-container: 5.0.9
pve-docs: 8.1.4
pve-edk2-firmware: 4.2023.08-4
pve-firewall: 5.0.3
pve-firmware: 3.9-2
pve-ha-manager: 4.0.3
pve-i18n: 3.2.1
pve-qemu-kvm: 8.1.5-4
pve-xtermjs: 5.3.0-3
qemu-server: 8.1.1
smartmontools: 7.3-pve1
spiceterm: 3.3.0
swtpm: 0.8.0+pve1
vncterm: 1.8.0
zfsutils-linux: 2.2.3-pve1
 

Attachments

  • hung task syslog messages.txt
    20.8 KB · Views: 3
Hi,
The latest patches to qemu and the kernel have not fixed the deadlocked processes during backups for me. Every time it gets to a large data transfer during a backup, the backup process and all the VMs go into D state.
what kind of storage and physical disks are you using? Did you already try setting a bandwidth limit?
 
Hi,

what kind of storage and physical disks are you using? Did you already try setting a bandwidth limit?
The Proxmox boot drive and the location of my two VMs is a SATA SSD (local-lvm). The containers are located on an NFS share, which is also the location where all the backups are stored. That NFS share is provided by a TrueNAS VM (one of the two whose boot image is stored on the SSD), and handles a RAID-Z2 ZFS pool based on 7 SATA HDDs passed through via virtio. Proxmox is not directly handling any ZFS business. All of this is on one physical machine (homelab kinda thing).

During the failing backup, a temporary image of one of the container's drives (~26GB) is made by copying from NFS to /tmp on the SSD. Then that image is copied (and compressed by tar) back to NFS, which is when the failure happens.

All the containers boot fine and I can read and write to their disks fine, including relatively large amounts of data as quickly as my network connection allows (50-100MB/s). TrueNAS is also able to directly support (over SMB and rsync) heavy loads as well, as it has multiple computers backing up to it hourly. Without running the backups, the system is totally stable and is fine to run for a month+ without issue.

Regarding bandwidth limit, I tried to set it to 1MB/s using the following command followed by a reboot, but the backups are still going at full speed and the system is still blowing up. The limit shows up in the GUI under the storage listing, but it doesn't seem to have an effect.
pvesm set TrueNAS --bwlimit clone=1024,default=1024,migration=1024,move=1024,restore=1024

If it is of any use, I spammed my previous ps command while the system was backing up (showing about 500MB/s in iotop). It appears kvm is the first task to die/go into permanent D state.
Code:
# ps -eo s,pid,user,comm | grep '^D'
D    8045 root     kworker/3:1+events
D    8683 100000   tar
# ps -eo s,pid,user,comm | grep '^D'
D      24 root     kworker/1:0-events
# ps -eo s,pid,user,comm | grep '^D'
D    8683 100000   tar
# ps -eo s,pid,user,comm | grep '^D'
D    9314 root     lvs
# ps -eo s,pid,user,comm | grep '^D'
D    8683 100000   tar
# ps -eo s,pid,user,comm | grep '^D'
D      85 root     kswapd0
D    8683 100000   tar
# ps -eo s,pid,user,comm | grep '^D'
# iotop
# ps -eo s,pid,user,comm | grep '^D'
D    1576 root     kvm
D    8683 100000   tar
# ps -eo s,pid,user,comm | grep '^D'
D    1576 root     kvm
D    8683 100000   tar
# ps -eo s,pid,user,comm | grep '^D'
D    1576 root     kvm
D    8683 100000   tar
# ps -eo s,pid,user,comm | grep '^D'
D    1576 root     kvm
D    8683 100000   tar
# ps -eo s,pid,user,comm | grep '^D'
D    1576 root     kvm
D    8683 100000   tar
# ps -eo s,pid,user,comm | grep '^D'
D    1576 root     kvm
D    8683 100000   tar
# ps -eo s,pid,user,comm | grep '^D'
D    1576 root     kvm
D    4639 100000   master
D    8683 100000   tar
D    8862 root     kworker/u16:16+loop2
# ps -eo s,pid,user,comm | grep '^D'
D    1576 root     kvm
D    4639 100000   master
D    8683 100000   tar
D    8862 root     kworker/u16:16+loop2
# ps -eo s,pid,user,comm | grep '^D'
D      64 root     kworker/u16:1+loop2
D    1576 root     kvm
D    3868 root     kmmpd-loop2
D    4639 100000   master
D    8683 100000   tar
D    8862 root     kworker/u16:16+loop2
# ps -eo s,pid,user,comm | grep '^D'
^C
# ps -eo s,pid,user,comm | grep '^D'
^C
# echo "1" > /proc/sys/kernel/sysrq
# echo "b" > /proc/sysrq-trigger
 
Last edited:
See here for how to configure the bandwidth limit for backup jobs (not yet exposed in the UI): https://forum.proxmox.com/threads/proxmox-ve-8-0-released.129320/page-21#post-626892
With that bandwidth limit enabled and set to 1MB/s, it failed in the exact same place as before. Because of the bandwidth limit, it took 16 hours to get to this point versus a few minutes when it was copying at 100+MB/s.

Tail of the backup log, indicating the failure is happening during the archive creation step.
Code:
INFO: including mount point rootfs ('/') in backup
INFO: including mount point mp0 ('/mnt/data') in backup
INFO: starting first sync /proc/600556/root/ to /tmp/vzdumptmp601231_104/
INFO: first sync finished - transferred 29.08G bytes in 27748s
INFO: suspending guest
INFO: starting final sync /proc/600556/root/ to /tmp/vzdumptmp601231_104/
INFO: final sync finished - transferred 8.39M bytes in 2s
INFO: resuming guest
INFO: guest is online again after 2 seconds
INFO: creating vzdump archive '/mnt/pve/TrueNAS/dump/vzdump-lxc-104-2024_03_26-08_22_00.tar.zst'

I've effectively had to pull the plug on this storage server without disk sync 5+ times now, so I'd like to stop brutalizing it by doing this, but I recognize this is quite a difficult thing to debug without more information.


Also, I don't think it immediately failed upon the start of the archive creation. I checked on it periodically, and that last log line was there before my final check when I noticed it was locked up again.
 
Last edited:
One other thing I could mention as well: There is a VM that has a 16GB image that gets backed up first, which seems to be successful every time. One other container is successfully backed up (though its images are stored on local-lvm) before it gets to the problematic one. It seems to be reliably triggered by this process of backing up the running container with two images, one of which is rather large, and both of which are stored on the NFS server itself (though copied to /tmp first).

There is nothing in the syslog to really indicate what's going wrong other than the hung task output I included in a previous post attachment, followed by a bunch of lines saying it can no longer access the NFS server.
 
Last edited:
Did you already check the disks of the NFS server are healthy? Does the NFS hang up when you copy a large file manually there?

It's copied to /tmp first, because it can't be copied to the backup target directly if that doesn't support POSIX (otherwise permissions in the archive would be wrong).
 
Did you already check the disks of the NFS server are healthy? Does the NFS hang up when you copy a large file manually there?

It's copied to /tmp first, because it can't be copied to the backup target directly if that doesn't support POSIX (otherwise permissions in the archive would be wrong).
I think the disks are fine -- about 2 years old, no SMART errors, and TrueNAS never gives a "disk causing slow IO" warning except when the whole server locks up. I just successfully rsynced three 25-30GB video files to and from /mnt/pve/TrueNAS at 100+MB/s (saturating gigabit NIC), which is the same place and the same NFS interface the backups are using. There was no issue at all, so it seems like this problem is only triggered by the "creating vzdump archive" step of the backup.

I originally had vzdump copying the container directly to NFS but added the tmpdir: /tmp line to /etc/vzdump.conf after getting lots of NFS permissions errors in the syslog. I did that before my message #67 in hopes it would fix something, but the lockup problem has remained regardless.
 
Last edited:
I was just able to recreate the failure manually by simply copying a file from the local SSD to the NFS share. Evidently the 1Gbit connection + rsync was not fast enough to trigger the problem, or the combined load of reading and writing from local storage at the same time is a problem. I also tried with a simplified version of the command that vzdump runs, which also triggered the failure.

Code:
 OK: cp /root/test.mp4 /root/test2.mp4
DIE: cp /root/test.mp4 /mnt/pve/TrueNAS/test.mp4
DIE: tar cpf - /root/test.mp4 | zstd '--threads=1' >/mnt/pve/TrueNAS/test.zstd

So this seems unrelated to the vzdump tool itself, and might be dependent on write speed. So some kind of race condition or buffer overfilling or something?

In case this is related to device drivers, here is what lspci reports for the SATA controllers I'm using
Code:
CPU: Intel i7-3770
SATA controller: Intel Corporation 7 Series/C210 Series Chipset Family 6-port SATA Controller [AHCI mode] (rev 04) -- serving boot SSD + 3 HDDs
SATA controller: Marvell Technology Group Ltd. 88SE9215 PCIe 2.0 x1 4-port SATA 6 Gb/s Controller (rev 11) -- serving 4 HDDs

EDIT: Did another test copying the boot disk of the TrueNAS VM to its ZFS RAID pool from within the TrueNAS VM. In terms of disk IO, this should have been the same thing as copying from the SSD to the ZFS pool, as was done under Proxmox, since the TrueNAS's VM's boot disk is stored on the SSD. Doing this, not involving NFS and doing everything within the VM, I was successful in copying 16GB of data at 288MB/s, which I think is comparable to the speed under Proxmox that triggered the failure (though it might've hit 400-500MB/s before failing before; don't remember for sure).
Code:
zfs snapshot -r boot-pool@test
zfs send -R boot-pool@test > /mnt/data/Proxmox/test

Since the failure only happens when high speed data crosses the NFS barrier, maybe there is a problem with its implementation? Or perhaps there are some differences in the way ZFS does RAM caching or CPU/KVM loading pattern is different...

EDIT 2: Well my assertion that it only fails when there is high speed data doesn't fit with the previous test showing it failing at 1MB/s.
 
Last edited:
Should it happen again, could you try issuing
Code:
qm guest cmd 107 fsfreeze-status
qm guest cmd 107 fsfreeze-thaw
?

Unfortunately it happened again (and also during time of backup). VM was unresponsive for at least 5 minutes prior to any actions taken.

1000007481.png

vm was only usable again after issue of
Code:
qm reset 107

Edit: It happened also to another (Windows 11) VM. This VM does even have less storage complexity (only a system disk on a nvme backed zfs-mirror). QEMU guest agent also is not running.
Edit2: The other VM unfroze itself. After about 2 minutes to boot up a machine to analyze further, (via console on proxmox web ui), VM was responsive again and also fsfreeze-status responded with thawed
 
Last edited:
It happened again.

console:
qemu-hung.jpg

cpu usage:
qemu-cpuusage.jpg

qemu-guest:
qemu-guest.jpg

journal:
qemu-journal.jpg

I reconfigured the VM to not use iothead once more to test if this helps avoiding the issue.
 
Unfortunately it happened again (and also during time of backup). VM was unresponsive for at least 5 minutes prior to any actions taken.

View attachment 65785

vm was only usable again after issue of
Code:
qm reset 107
So the communication with the guest agent fails. It might be because it actually is not running in the guest anymore (or some other fundamental issue in the guest), or because there's an issue with the QEMU process on the host.
Edit: It happened also to another (Windows 11) VM. This VM does even have less storage complexity (only a system disk on a nvme backed zfs-mirror). QEMU guest agent also is not running.
Edit2: The other VM unfroze itself. After about 2 minutes to boot up a machine to analyze further, (via console on proxmox web ui), VM was responsive again and also fsfreeze-status responded with thawed
This hints it might be the QEMU process on the host.

Should it happen again, please check again that the guest agent is not detected as running. Then you can use
Code:
apt install pve-qemu-kvm-dbgsym gdb
gdb --batch --ex 't a a bt' -p $(cat /var/run/qemu-server/107.pid)
with the correct VM ID instead of 107 to obtain a debugger backtrace. If we are lucky, there is something noticeable there.
 
  • Like
Reactions: mnih
I just updated my system again, and it appears to have entirely resolved my problem. The previous copy commands that killed the system work fine now, and the backup job completes without issue. It seems like the main relevant update was the kernel?

I've re-enabled the daily backups now, so we'll see if there are any further problems.

If it failed again, I was going to attempt to get a backtrace of the stuck processes using sysrq (echo w > /proc/sysrq-trigger) instead of GDB (which just hung due to the broken filesystems I guess). Not necessary anymore, but wanted to mention in case it's useful.

Code:
proxmox-ve: 8.1.0 (running kernel: 6.5.13-5-pve)
pve-manager: 8.1.10 (running version: 8.1.10/4b06efb5db453f29)
proxmox-kernel-helper: 8.1.0
pve-kernel-5.15: 7.4-10
proxmox-kernel-6.5.13-5-pve-signed: 6.5.13-5
proxmox-kernel-6.5: 6.5.13-5
proxmox-kernel-6.5.13-3-pve-signed: 6.5.13-3
pve-kernel-5.15.136-1-pve: 5.15.136-1
pve-kernel-5.15.102-1-pve: 5.15.102-1
ceph-fuse: 16.2.11+ds-2
corosync: 3.1.7-pve3
criu: 3.17.1-2
glusterfs-client: 10.3-5
ifupdown2: 3.2.0-1+pmx8
ksm-control-daemon: 1.5-1
libjs-extjs: 7.0.0-4
libknet1: 1.28-pve1
libproxmox-acme-perl: 1.5.0
libproxmox-backup-qemu0: 1.4.1
libproxmox-rs-perl: 0.3.3
libpve-access-control: 8.1.3
libpve-apiclient-perl: 3.3.2
libpve-cluster-api-perl: 8.0.5
libpve-cluster-perl: 8.0.5
libpve-common-perl: 8.1.1
libpve-guest-common-perl: 5.0.6
libpve-http-server-perl: 5.0.6
libpve-network-perl: 0.9.6
libpve-rs-perl: 0.8.8
libpve-storage-perl: 8.1.5
libspice-server1: 0.15.1-1
lvm2: 2.03.16-2
lxc-pve: 6.0.0-1
lxcfs: 6.0.0-pve2
novnc-pve: 1.4.0-3
proxmox-backup-client: 3.1.5-1
proxmox-backup-file-restore: 3.1.5-1
proxmox-kernel-helper: 8.1.0
proxmox-mail-forward: 0.2.3
proxmox-mini-journalreader: 1.4.0
proxmox-widget-toolkit: 4.1.5
pve-cluster: 8.0.5
pve-container: 5.0.9
pve-docs: 8.1.5
pve-edk2-firmware: 4.2023.08-4
pve-firewall: 5.0.3
pve-firmware: 3.11-1
pve-ha-manager: 4.0.3
pve-i18n: 3.2.1
pve-qemu-kvm: 8.1.5-4
pve-xtermjs: 5.3.0-3
qemu-server: 8.1.1
smartmontools: 7.3-pve1
spiceterm: 3.3.0
swtpm: 0.8.0+pve1
vncterm: 1.8.0
zfsutils-linux: 2.2.3-pve2
 
  • Like
Reactions: fiona and UdoB
I just updated my system again, and it appears to have entirely resolved my problem. The previous copy commands that killed the system work fine now, and the backup job completes without issue. It seems like the main relevant update was the kernel?

I've re-enabled the daily backups now, so we'll see if there are any further problems.

If it failed again, I was going to attempt to get a backtrace of the stuck processes using sysrq (echo w > /proc/sysrq-trigger) instead of GDB (which just hung due to the broken filesystems I guess). Not necessary anymore, but wanted to mention in case it's useful.

Code:
proxmox-ve: 8.1.0 (running kernel: 6.5.13-5-pve)
pve-manager: 8.1.10 (running version: 8.1.10/4b06efb5db453f29)
proxmox-kernel-helper: 8.1.0
pve-kernel-5.15: 7.4-10
proxmox-kernel-6.5.13-5-pve-signed: 6.5.13-5
proxmox-kernel-6.5: 6.5.13-5
proxmox-kernel-6.5.13-3-pve-signed: 6.5.13-3
pve-kernel-5.15.136-1-pve: 5.15.136-1
pve-kernel-5.15.102-1-pve: 5.15.102-1
ceph-fuse: 16.2.11+ds-2
corosync: 3.1.7-pve3
criu: 3.17.1-2
glusterfs-client: 10.3-5
ifupdown2: 3.2.0-1+pmx8
ksm-control-daemon: 1.5-1
libjs-extjs: 7.0.0-4
libknet1: 1.28-pve1
libproxmox-acme-perl: 1.5.0
libproxmox-backup-qemu0: 1.4.1
libproxmox-rs-perl: 0.3.3
libpve-access-control: 8.1.3
libpve-apiclient-perl: 3.3.2
libpve-cluster-api-perl: 8.0.5
libpve-cluster-perl: 8.0.5
libpve-common-perl: 8.1.1
libpve-guest-common-perl: 5.0.6
libpve-http-server-perl: 5.0.6
libpve-network-perl: 0.9.6
libpve-rs-perl: 0.8.8
libpve-storage-perl: 8.1.5
libspice-server1: 0.15.1-1
lvm2: 2.03.16-2
lxc-pve: 6.0.0-1
lxcfs: 6.0.0-pve2
novnc-pve: 1.4.0-3
proxmox-backup-client: 3.1.5-1
proxmox-backup-file-restore: 3.1.5-1
proxmox-kernel-helper: 8.1.0
proxmox-mail-forward: 0.2.3
proxmox-mini-journalreader: 1.4.0
proxmox-widget-toolkit: 4.1.5
pve-cluster: 8.0.5
pve-container: 5.0.9
pve-docs: 8.1.5
pve-edk2-firmware: 4.2023.08-4
pve-firewall: 5.0.3
pve-firmware: 3.11-1
pve-ha-manager: 4.0.3
pve-i18n: 3.2.1
pve-qemu-kvm: 8.1.5-4
pve-xtermjs: 5.3.0-3
qemu-server: 8.1.1
smartmontools: 7.3-pve1
spiceterm: 3.3.0
swtpm: 0.8.0+pve1
vncterm: 1.8.0
zfsutils-linux: 2.2.3-pve2
Unfortunately my celebration was premature. It died in the same way again after working fine for four days. This is pretty strange since triggering the failure was very repeatable before the update (even on a freshly booted system), and was repeatably not reproducible immediately following it. This time, I managed to capture the following backtraces of the KVM processes using sysrq. Again, there are other processes that subsequently go into D state after the KVM ones lock up, and I can provide those if useful, but I assume the KVM ones are the most important.

Code:
[386896.658774] sysrq: Show Blocked State
[386896.658831] task:kvm             state:D stack:0     pid:1579  ppid:1      flags:0x00004002
[386896.658835] Call Trace:
[386896.658837]  <TASK>
[386896.658840]  __schedule+0x3fc/0x1440
[386896.658845]  ? blk_mq_flush_plug_list+0x19/0x30
[386896.658849]  schedule+0x63/0x110
[386896.658852]  wait_on_commit+0x95/0xd0 [nfs]
[386896.658887]  ? __pfx_var_wake_function+0x10/0x10
[386896.658891]  __nfs_commit_inode+0x13b/0x190 [nfs]
[386896.658917]  nfs_wb_folio+0xee/0x240 [nfs]
[386896.658942]  nfs_release_folio+0x95/0x150 [nfs]
[386896.658963]  filemap_release_folio+0x6e/0xb0
[386896.658966]  shrink_folio_list+0x59c/0xc30
[386896.658970]  evict_folios+0x2bd/0x660
[386896.658973]  try_to_shrink_lruvec+0x1c8/0x2d0
[386896.658976]  shrink_one+0x123/0x1e0
[386896.658979]  shrink_node+0x9bd/0xc10
[386896.658981]  do_try_to_free_pages+0xe1/0x5f0
[386896.658983]  ? sched_clock_noinstr+0x9/0x10
[386896.658986]  try_to_free_pages+0xe6/0x210
[386896.658988]  __alloc_pages+0x6d9/0x12f0
[386896.658992]  ? asm_sysvec_apic_timer_interrupt+0x1b/0x20
[386896.658994]  alloc_pages+0x90/0x160
[386896.658997]  __get_free_pages+0x11/0x50
[386896.658999]  __pollwait+0x9e/0xe0
[386896.659002]  eventfd_poll+0x2f/0x70
[386896.659005]  do_sys_poll+0x2f7/0x610
[386896.659009]  ? __pfx___pollwait+0x10/0x10
[386896.659012]  ? __pfx_pollwake+0x10/0x10
[386896.659014]  ? __pfx_pollwake+0x10/0x10
[386896.659016]  ? __pfx_pollwake+0x10/0x10
[386896.659018]  ? __pfx_pollwake+0x10/0x10
[386896.659020]  ? __pfx_pollwake+0x10/0x10
[386896.659023]  ? __pfx_pollwake+0x10/0x10
[386896.659025]  ? __pfx_pollwake+0x10/0x10
[386896.659027]  ? __pfx_pollwake+0x10/0x10
[386896.659029]  ? __pfx_pollwake+0x10/0x10
[386896.659031]  ? _copy_from_user+0x2f/0x80
[386896.659033]  ? __pfx_read_tsc+0x10/0x10
[386896.659036]  __x64_sys_ppoll+0xde/0x170
[386896.659038]  do_syscall_64+0x5b/0x90
[386896.659040]  ? syscall_exit_to_user_mode+0x37/0x60
[386896.659042]  ? do_syscall_64+0x67/0x90
[386896.659044]  ? do_syscall_64+0x67/0x90
[386896.659045]  ? do_syscall_64+0x67/0x90
[386896.659046]  ? do_syscall_64+0x67/0x90
[386896.659047]  ? sysvec_call_function_single+0x4b/0xd0
[386896.659049]  entry_SYSCALL_64_after_hwframe+0x6e/0xd8
[386896.659051] RIP: 0033:0x7f612318b256
[386896.659070] RSP: 002b:00007ffce8298640 EFLAGS: 00000293 ORIG_RAX: 000000000000010f
[386896.659072] RAX: ffffffffffffffda RBX: 000056c7d90e36a0 RCX: 00007f612318b256
[386896.659073] RDX: 00007ffce8298660 RSI: 000000000000000c RDI: 000056c7da56ef70
[386896.659074] RBP: 00007ffce82986cc R08: 0000000000000008 R09: 0000000000000000
[386896.659075] R10: 0000000000000000 R11: 0000000000000293 R12: 00007ffce8298660
[386896.659076] R13: 000056c7d90e36a0 R14: 000056c7d6fd7c48 R15: 00007ffce82986d0
[386896.659078]  </TASK>
[386896.659082] task:kvm             state:D stack:0     pid:1820  ppid:1      flags:0x00024002
[386896.659084] Call Trace:
[386896.659085]  <TASK>
[386896.659086]  __schedule+0x3fc/0x1440
[386896.659088]  ? blk_mq_flush_plug_list+0x19/0x30
[386896.659090]  schedule+0x63/0x110
[386896.659091]  wait_on_commit+0x95/0xd0 [nfs]
[386896.659115]  ? __pfx_var_wake_function+0x10/0x10
[386896.659118]  __nfs_commit_inode+0x13b/0x190 [nfs]
[386896.659142]  nfs_wb_folio+0xee/0x240 [nfs]
[386896.659167]  nfs_release_folio+0x95/0x150 [nfs]
[386896.659187]  filemap_release_folio+0x6e/0xb0
[386896.659189]  shrink_folio_list+0x59c/0xc30
[386896.659193]  evict_folios+0x2bd/0x660
[386896.659196]  try_to_shrink_lruvec+0x1c8/0x2d0
[386896.659199]  shrink_one+0x123/0x1e0
[386896.659202]  shrink_node+0x9bd/0xc10
[386896.659204]  do_try_to_free_pages+0xe1/0x5f0
[386896.659206]  try_to_free_pages+0xe6/0x210
[386896.659209]  __alloc_pages+0x6d9/0x12f0
[386896.659211]  ? ktime_get+0x48/0xc0
[386896.659214]  alloc_pages+0x90/0x160
[386896.659216]  __get_free_pages+0x11/0x50
[386896.659219]  __pollwait+0x9e/0xe0
[386896.659221]  eventfd_poll+0x2f/0x70
[386896.659223]  do_sys_poll+0x2f7/0x610
[386896.659228]  ? __pfx___pollwait+0x10/0x10
[386896.659230]  ? __pfx_pollwake+0x10/0x10
[386896.659232]  ? __pfx_pollwake+0x10/0x10
[386896.659235]  ? __pfx_pollwake+0x10/0x10
[386896.659237]  ? __pfx_pollwake+0x10/0x10
[386896.659239]  ? __pfx_pollwake+0x10/0x10
[386896.659241]  ? __pfx_pollwake+0x10/0x10
[386896.659243]  ? __pfx_pollwake+0x10/0x10
[386896.659245]  ? __pfx_pollwake+0x10/0x10
[386896.659247]  ? __pfx_pollwake+0x10/0x10
[386896.659250]  __x64_sys_ppoll+0xde/0x170
[386896.659253]  do_syscall_64+0x5b/0x90
[386896.659254]  ? exit_to_user_mode_prepare+0x39/0x190
[386896.659257]  ? syscall_exit_to_user_mode+0x37/0x60
[386896.659258]  ? do_syscall_64+0x67/0x90
[386896.659260]  ? do_syscall_64+0x67/0x90
[386896.659261]  ? sysvec_reschedule_ipi+0x7a/0x120
[386896.659263]  entry_SYSCALL_64_after_hwframe+0x6e/0xd8
[386896.659264] RIP: 0033:0x7f95cb98b256
[386896.659268] RSP: 002b:00007ffe6583cd40 EFLAGS: 00000293 ORIG_RAX: 000000000000010f
[386896.659270] RAX: ffffffffffffffda RBX: 000057aa15ebc420 RCX: 00007f95cb98b256
[386896.659271] RDX: 00007ffe6583cd60 RSI: 0000000000000044 RDI: 000057aa16ee9c00
[386896.659271] RBP: 00007ffe6583cdcc R08: 0000000000000008 R09: 0000000000000000
[386896.659272] R10: 0000000000000000 R11: 0000000000000293 R12: 00007ffe6583cd60
[386896.659273] R13: 000057aa15ebc420 R14: 000057aa14514c48 R15: 00007ffe6583cdd0
[386896.659275]  </TASK>

@fiona I know you have been asking for some backtraces, so perhaps these might mean something to you.

I may have more time to mess around with it in a while. I have a few random ideas to check, mainly NFS volume free space (maybe 4 days of backups brought it down to some critical level?) and running a memory test on the server (it passed fine about a year or two ago).
 

About

The Proxmox community has been around for many years and offers help and support for Proxmox VE, Proxmox Backup Server, and Proxmox Mail Gateway.
We think our community is one of the best thanks to people like you!

Get your subscription!

The Proxmox team works very hard to make sure you are running the best software and getting stable updates and security enhancements, as well as quick enterprise support. Tens of thousands of happy customers have a Proxmox subscription. Get yours easily in our online shop.

Buy now!