VirtIO = task xxx blocked for more than 120 seconds.

tytanick

Member
Feb 25, 2013
96
3
8
Hi guys.
I know that there are some topics with this bug but mine still istn solved.

I have still unsolved problem with some of servers.
I have like 3 host servers and many VMs on those.
Sometimes (totally radom time, and VM) of Guest Debian 7 linux hang...
"task xxx blocked for more than 120 seconds"
It happen mostly where there is not mutch going on inside Guest.
After that VM is not responding and only Reset helps.
Anyway i tried may things to solve this

Which all have in common is that
- qcow2 format
- Virt IO driver
- writeback cache

When i set IDE instead of VirtIO problem is solved but also i have poor performance, and some problems while backupping whole VM while running.

Anyway i tried many kernels also in Host (including newest 4.2.6) and also in guest.

Host proxmox kernel: Linux node1 4.2.6-1-pve #1 SMP Thu Jan 21 09:34:06 CET 2016 x86_64 GNU/Linux
VM kernel: 3.2.0-4-amd64 #1 SMP Debian 3.2.68-1+deb7u2 x86_64 GNU/Linux
Sysctl config of VM:
vm.dirty_background_ratio = 5
vm.dirty_ratio = 10

I was able o catch this moment on charts (the moment when cpu drops to zero and also IO disk - after some while you can see that i restarted VM and then everything back to normlal.
This bug is one that i have in half of my setups and its pretty anoying.
Please help :)

Here are screens:

upload_2016-1-27_16-39-21.png upload_2016-1-27_16-39-58.png upload_2016-1-27_16-43-40.png upload_2016-1-27_16-43-53.png
 
nope, didnt tryied that one.
You think this is kernel bug (acting as client of virtio ?)
Is there any bug listed that confirms this ?
 
I have a Jessie kvm and dealing with same issue. here are some notes :

Code:
- ldap  (kvm)syslog

Jan 20 02:55:01 ldap-master kernel: [326520.088154] INFO: task jbd2/vda2-8:129 blocked for more than 120 seconds.
Jan 20 02:55:01 ldap-master kernel: [326520.088159]  Not tainted 3.16.0-4-amd64 #1
Jan 20 02:55:01 ldap-master kernel: [326520.088160] "echo 0 > /proc/sys/kernel/hung_task_timeout_secs" disables this message.
Jan 20 02:55:01 ldap-master kernel: [326520.088161] jbd2/vda2-8  D ffff880036f5b7c8  0  129  2 0x00000000
Jan 20 02:55:01 ldap-master kernel: [326520.088164]  ffff880036f5b370 0000000000000046 0000000000012f00 ffff880036c23fd8
Jan 20 02:55:01 ldap-master kernel: [326520.088166]  0000000000012f00 ffff880036f5b370 ffff88003fc137b0 ffff88003ffa3a30

3- ldap runs on sys3.  I did not see any issues in log.

system is a KVM

104.conf
bootdisk: virtio0
cores: 1
cpu: host
ide2: none,media=cdrom
memory: 1024
name: ldap-master
net0: virtio=06:FE:96:xx:xx:xx,bridge=vmbr1
numa: 0
onboot: 1
ostype: l26
protection: 1
smbios1: uuid=10bbeffd-7a3xxxx78-a679-c9d9xxxxxxxx
sockets: 4
virtio0: kvm-zfs:vm-104-disk-1,cache=writeback,size=8G

try backport kernel
apt-get -t jessie-backports install linux-image-amd64  <<<<<<<<<<<<<<<<<<<<<  ATTEMPTED SOLUTION  1/20  10AM+-

so this is a work in progress. if a month of no issue then I think backports fixed the issue.
 
from wiki :) - so meaby stable kernel in debian 7 is causing this because it has 3.2 and from backports there is 3.16 :)

VirtIO
Use virtIO for disk and network for best performance.

  • Linux has the drivers built in since Linux 2.6.24 as experimental, and since Linux 3.8 as stable
 
unfortunatley .... after 12 days one of my VM just hunged
It happened short (in 2-3 hours) after backupping in snapshot mode ..
Anyway i had to use ide for now, this is in production so i cant let this happen.
Any thoughts what is causing this and how to fix this for sure ?

Ot8hLFh.png
 
Having JUST experienced this same issue, I think that your disk speed/disk cache isn't enough to handle the io when data is dumped.... you don't mention what your disk is. I can see it's "local" in one of the images, but if it's not an SSD, I'm guessing that it's disk/io error. For me, my nas didn't have enough ram to handle the tasks. Going from 8gb to 32 gb of ram solved that issue, but what really fixed my nas was the addition of a "log" drive for zfs.

It isn't a host/vm "cpu" problem, it isn't really a host/vm "ram" problem, nor is it a lack of swap on either. I think this is basically a disk speed/disk cache problem.

QUOTE:
"By default Linux uses up to 40% of the available memory for file system caching. After this mark has been reached the file system flushes all outstanding data to disk causing all following IOs going synchronous. For flushing out this data to disk this there is a time limit of 120 seconds by default. In the case here the IO subsystem is not fast enough to flush the data withing 120 seconds. This especially happens on systems with a lof of memory."

You can try fixing this by lowering the mark for flushing the cache from 40% to 10% by adding the line “vm.dirty_ratio=10″ in /etc/sysctl.conf (In your virtual machine). Basically that forces it to flush faster... so hopefully your disk can catch up before 120 seconds elapse.... however if you have a VERY busy disk, then you might need a disk with a bigger cache, or an ssd. For me, adding ram to my nas in essence increased my cache size, fixing my issues.

Hope that helps you some.
 
Hi,
Unfortunatley its not the case.
- it never happened when ide0 is selected (only with virt0 it is happening)
- mostly there is no load at all in that situation but last hang i see that there was tremendous load but i think its caused due to "not accessible" disk. all 3 virtual machined got big memory consumption but only one of them hang (tle left one "Baza")
So this load catched in zabbix is virtual load not happenning i suppose.
Anyway this setup is 4x500GB Crucial SSD RAID 10 with 1GB cachevault.
Writeback and Virtio was enabled.
It has 2cpu x 20 cores.
I think that ts is virtio bug afterall.

When it is happening i thing all VirtIO machines have problem accesing disk.

This is proxmox Base Host stats (zabbix stats are not avaible due to virt io usage i suppose)
upload_2016-2-15_10-59-36.png
 

Attachments

  • zabbix_stat_virtio.png
    zabbix_stat_virtio.png
    172.5 KB · Views: 11
Hello guys.
After struggling with this problem fro a year in OVH datacenter i finally might have something !
Standard options in sysctl are:
vm.dirty_background_ratio = 10
vm.dirty_ratio = 20

And when my SERVER HAVE 265GB or DDR memory !!! - then :
256 GB * 20% = 50 GB
So in that case if i am thinking right, there are cases when 50GB of data needs to be written to drive.
There is also standard limit of 120 seconds for this operation.
So Lets say that SSD when its already busy, will write 100MBytes of data per second.
In that case it would make 500 seconds to write those data.
In 200MB per second it would be even 250seconds ....
So in that case this task wont make it in 120 seconds so this will casue dmesg throwing those errors !
And here we go, when i see this error , i am thinking "stupid OVH hardware raid" while it could be just bad default configuration !!!

Can anyone confirm that my idea is ok and that can be a cause ?
So if i want to fix this then i need to lower systcl parameters ?
vm.dirty_background_ratio = 1
vm.dirty_ratio = 2
And this should fix the problem ?
If not then should i also rise kernel.hung_task_timeout_secs = 120 to 300 ?

Tell me if i am right (this idea showed me OVH).
I was looking into it a year ago but i didnt saw a sense.
I was thinking that this error is becasue HW error, but it might be just the oposit :)
 
  • Like
Reactions: NKostya
The slowing down of and hung tasks in KVM guests during high IO activity on the host is most likely due to a kernel issue between the virtual memory subsytem and KVM+VirtIO that will hopefully get solved eventually.

We have found that the following settings - while do not solve the problem completely - considerably lessen the impact on guests. All of these settings are for the Proxmox hosts.

1. Linux virtual memory subsystem tuning

vm.dirty_ratio and vm.dirty_background_ratio
You need to lower these considerably from the default values. Purpose is to lessen the IO blocking effect that happens when processes reach their dirty page cache limit in memory and the kernel starts to write them out. Add the following lines to /etc/sysctl.conf
Code:
vm.dirty_ratio=3
vm.dirty_background_ratio=1

vm.min_free_kbytes
You need to increase vm.min_free_kbytes from the Debian default value to about 128M for every 16GB of RAM you have in your server. Purpose is set aside a bit more free memory to avoid allocation problems when reclaim of page cache would be too slow. So choose one of the following lines and add it to your /etc/sysctl.conf
Code:
vm.min_free_kbytes=131072     # for servers under 16GB of RAM
vm.min_free_kbytes=262144     # for servers between 16GB-32GB RAM
vm.min_free_kbytes=393216     # for servers between 32GB-48GB RAM
vm.min_free_kbytes=524288     # for servers above 48GB RAM

vm.swappiness
Swapping out on the host can also cause temporary IO blocking of guests, so you need to limit it while not disabling swapping completely. Add the following line to /etc/sysctl.conf
Code:
vm.swappiness=1

After adding these, don't forget to run sysctl -p (or reboot).

2. ZFS swap tuning
You should absolutely use these settings for system stability if your swap is on a ZFS ZVOL (default installation places it there):
Code:
zfs set primarycache=metadata rpool/swap
zfs set secondarycache=metadata rpool/swap
zfs set compression=zle rpool/swap
zfs set checksum=off rpool/swap
zfs set sync=always rpool/swap
zfs set logbias=throughput rpool/swap
 
Last edited:
The slowing down of and hung tasks in KVM guests during high IO activity on the host is most likely due to a kernel issue between the virtual memory subsytem and KVM+VirtIO that will hopefully get solved eventually.

We have found that the following settings - while do not solve the problem completely - considerably lessen the impact on guests. All of these settings are for the Proxmox hosts.
Hi,
I also have a problem with 3 VMs with 64GB of RAM with Ubuntu 22.04 LTS operating system and kernel 5.15.0-91-generic.
Proxmox VE installed on 3 nodes with 512GB of ram and version pve-manager/8.1.3/b46aac3b42da5d15 (running kernel: 6.5.11-7-pve).

You write that the settings of vm.dirty_ratio etc. should they be done on the host machine? Shouldn't they also be applied on VMs?
Those are old mitigation tips when we did not know the real cause of the problem, but they do not hurt, especially the ZFS settings, they are very useful.

The most important 3 steps to solve this almost perfectly are:

1. Using VirtIO-SCSI-Single disk controller for your VM disks
2. Enabling IOthreads (iothread=1 in VM config) for all disks
3. Using threaded IO (aio=threads in VM config) for all disks


With these 3 enabled for all VMs, running migrations, restores and backups can coexist with VMs doing regular IO, without causing and CPU lockups or other freezes.

According to some people, the new Proxmox 7/8 default setting aio=uring is not working well, not solving this problem, regardless of the fact that it's supposed to be higher performing than aio=threads.

For more information on this issue see my kernel bugreport:
https://bugzilla.kernel.org/show_bug.cgi?id=199727
 
  • Like
Reactions: l.ansaloni
Hi,
I thought I had solved it with your configuration advice but after 8 days a VM crashed again.
These are the messages I find in the system logs:

Code:
Jan 30 06:00:00 docker-cluster-101 qemu-ga: info: guest-ping called
...
...
Jan 30 06:11:45 docker-cluster-101 kernel: [649222.434886] INFO: task jbd2/dm-0-8:988 blocked for more than 120 seconds.
Jan 30 06:11:45 docker-cluster-101 kernel: [649222.434917]       Not tainted 5.15.0-91-generic #101-Ubuntu
Jan 30 06:11:45 docker-cluster-101 kernel: [649222.434927] "echo 0 > /proc/sys/kernel/hung_task_timeout_secs" disables this message.
Jan 30 06:11:45 docker-cluster-101 kernel: [649222.434941] task:jbd2/dm-0-8     state:D stack:    0 pid:  988 ppid:     2 flags:0x00004000
Jan 30 06:11:45 docker-cluster-101 kernel: [649222.434945] Call Trace:
Jan 30 06:11:45 docker-cluster-101 kernel: [649222.434947]  <TASK>
Jan 30 06:11:45 docker-cluster-101 kernel: [649222.434951]  __schedule+0x24e/0x590
Jan 30 06:11:45 docker-cluster-101 kernel: [649222.434958]  schedule+0x69/0x110
Jan 30 06:11:45 docker-cluster-101 kernel: [649222.434960]  io_schedule+0x46/0x80
Jan 30 06:11:45 docker-cluster-101 kernel: [649222.434962]  ? wbt_cleanup_cb+0x20/0x20
Jan 30 06:11:45 docker-cluster-101 kernel: [649222.434966]  rq_qos_wait+0xd0/0x170
Jan 30 06:11:45 docker-cluster-101 kernel: [649222.434969]  ? wbt_rqw_done+0x110/0x110
Jan 30 06:11:45 docker-cluster-101 kernel: [649222.434971]  ? sysv68_partition+0x280/0x280
Jan 30 06:11:45 docker-cluster-101 kernel: [649222.434973]  ? wbt_cleanup_cb+0x20/0x20
Jan 30 06:11:45 docker-cluster-101 kernel: [649222.434975]  wbt_wait+0x9f/0xf0
Jan 30 06:11:45 docker-cluster-101 kernel: [649222.434977]  __rq_qos_throttle+0x25/0x40
Jan 30 06:11:45 docker-cluster-101 kernel: [649222.434979]  blk_mq_submit_bio+0x127/0x610
Jan 30 06:11:45 docker-cluster-101 kernel: [649222.434982]  __submit_bio+0x1ee/0x220
Jan 30 06:11:45 docker-cluster-101 kernel: [649222.434984]  ? mempool_alloc_slab+0x17/0x20
Jan 30 06:11:45 docker-cluster-101 kernel: [649222.434988]  __submit_bio_noacct+0x85/0x200
Jan 30 06:11:45 docker-cluster-101 kernel: [649222.434990]  ? kmem_cache_alloc+0x1ab/0x2f0
Jan 30 06:11:45 docker-cluster-101 kernel: [649222.434994]  submit_bio_noacct+0x4e/0x120
Jan 30 06:11:45 docker-cluster-101 kernel: [649222.434995]  submit_bio+0x4a/0x130
Jan 30 06:11:45 docker-cluster-101 kernel: [649222.434997]  submit_bh_wbc+0x18d/0x1c0
Jan 30 06:11:45 docker-cluster-101 kernel: [649222.435001]  submit_bh+0x13/0x20
Jan 30 06:11:45 docker-cluster-101 kernel: [649222.435002]  jbd2_journal_commit_transaction+0x861/0x1790
Jan 30 06:11:45 docker-cluster-101 kernel: [649222.435007]  kjournald2+0xa9/0x280
Jan 30 06:11:45 docker-cluster-101 kernel: [649222.435010]  ? wait_woken+0x70/0x70
Jan 30 06:11:45 docker-cluster-101 kernel: [649222.435014]  ? load_superblock.part.0+0xc0/0xc0
Jan 30 06:11:45 docker-cluster-101 kernel: [649222.435016]  kthread+0x127/0x150
Jan 30 06:11:45 docker-cluster-101 kernel: [649222.435021]  ? set_kthread_struct+0x50/0x50
Jan 30 06:11:45 docker-cluster-101 kernel: [649222.435023]  ret_from_fork+0x1f/0x30
Jan 30 06:11:45 docker-cluster-101 kernel: [649222.435028]  </TASK>
Jan 30 06:11:45 docker-cluster-101 kernel: [649222.435057] INFO: task dockerd:21240 blocked for more than 120 seconds.
Jan 30 06:11:45 docker-cluster-101 kernel: [649222.435069]       Not tainted 5.15.0-91-generic #101-Ubuntu
Jan 30 06:11:45 docker-cluster-101 kernel: [649222.435079] "echo 0 > /proc/sys/kernel/hung_task_timeout_secs" disables this message.
...
...
Jan 30 06:11:45 docker-cluster-101 kernel: [649222.440430] INFO: task cadvisor:291134 blocked for more than 120 seconds.
Jan 30 06:11:45 docker-cluster-101 kernel: [649222.440866]       Not tainted 5.15.0-91-generic #101-Ubuntu
Jan 30 06:11:45 docker-cluster-101 kernel: [649222.441301] "echo 0 > /proc/sys/kernel/hung_task_timeout_secs" disables this message.
Jan 30 06:11:45 docker-cluster-101 kernel: [649222.441743] task:cadvisor        state:D stack:    0 pid:291134 ppid: 10262 flags:0x00000220
Jan 30 06:11:45 docker-cluster-101 kernel: [649222.441746] Call Trace:
Jan 30 06:11:45 docker-cluster-101 kernel: [649222.441747]  <TASK>
Jan 30 06:11:45 docker-cluster-101 kernel: [649222.441747]  __schedule+0x24e/0x590
Jan 30 06:11:45 docker-cluster-101 kernel: [649222.441750]  ? bit_wait+0x70/0x70
Jan 30 06:11:45 docker-cluster-101 kernel: [649222.441752]  schedule+0x69/0x110
Jan 30 06:11:45 docker-cluster-101 kernel: [649222.441753]  io_schedule+0x46/0x80
Jan 30 06:11:45 docker-cluster-101 kernel: [649222.441755]  bit_wait_io+0x11/0x70
Jan 30 06:11:45 docker-cluster-101 kernel: [649222.441757]  __wait_on_bit+0x31/0xa0
Jan 30 06:11:45 docker-cluster-101 kernel: [649222.441759]  out_of_line_wait_on_bit+0x8d/0xb0
Jan 30 06:11:45 docker-cluster-101 kernel: [649222.441760]  ? var_wake_function+0x30/0x30
Jan 30 06:11:45 docker-cluster-101 kernel: [649222.441762]  do_get_write_access+0x243/0x3b0
Jan 30 06:11:45 docker-cluster-101 kernel: [649222.441765]  jbd2_journal_get_write_access+0x6e/0x90
Jan 30 06:11:45 docker-cluster-101 kernel: [649222.441766]  __ext4_journal_get_write_access+0x8f/0x1b0
Jan 30 06:11:45 docker-cluster-101 kernel: [649222.441768]  ext4_reserve_inode_write+0x92/0xc0
Jan 30 06:11:45 docker-cluster-101 kernel: [649222.441769]  __ext4_mark_inode_dirty+0x57/0x200
Jan 30 06:11:45 docker-cluster-101 kernel: [649222.441771]  ? __ext4_journal_start_sb+0x10b/0x130
Jan 30 06:11:45 docker-cluster-101 kernel: [649222.441773]  ext4_dirty_inode+0x5c/0x80
Jan 30 06:11:45 docker-cluster-101 kernel: [649222.441774]  __mark_inode_dirty+0x5b/0x330
Jan 30 06:11:45 docker-cluster-101 kernel: [649222.441776]  ? current_time+0x2b/0xf0
Jan 30 06:11:45 docker-cluster-101 kernel: [649222.441778]  touch_atime+0x13c/0x150
Jan 30 06:11:45 docker-cluster-101 kernel: [649222.441780]  iterate_dir+0x11f/0x1d0
Jan 30 06:11:45 docker-cluster-101 kernel: [649222.441782]  __x64_sys_getdents64+0x80/0x120
Jan 30 06:11:45 docker-cluster-101 kernel: [649222.441783]  ? __ia32_sys_getdents+0x120/0x120
Jan 30 06:11:45 docker-cluster-101 kernel: [649222.441786]  do_syscall_64+0x59/0xc0
Jan 30 06:11:45 docker-cluster-101 kernel: [649222.441787]  ? __x64_sys_epoll_ctl+0x66/0xa0
Jan 30 06:11:45 docker-cluster-101 kernel: [649222.441789]  ? exit_to_user_mode_prepare+0x37/0xb0
Jan 30 06:11:45 docker-cluster-101 kernel: [649222.441793]  ? syscall_exit_to_user_mode+0x35/0x50
Jan 30 06:11:45 docker-cluster-101 kernel: [649222.441795]  ? do_syscall_64+0x69/0xc0
Jan 30 06:11:45 docker-cluster-101 kernel: [649222.441796]  ? do_syscall_64+0x69/0xc0
Jan 30 06:11:45 docker-cluster-101 kernel: [649222.441797]  entry_SYSCALL_64_after_hwframe+0x62/0xcc
Jan 30 06:11:45 docker-cluster-101 kernel: [649222.441800] RIP: 0033:0x404e2e
Jan 30 06:11:45 docker-cluster-101 kernel: [649222.441801] RSP: 002b:000000c0041d9528 EFLAGS: 00000206 ORIG_RAX: 00000000000000d9
Jan 30 06:11:45 docker-cluster-101 kernel: [649222.441802] RAX: ffffffffffffffda RBX: 000000000000000f RCX: 0000000000404e2e
Jan 30 06:11:45 docker-cluster-101 kernel: [649222.441803] RDX: 0000000000002000 RSI: 000000c0003a2000 RDI: 000000000000000f
Jan 30 06:11:45 docker-cluster-101 kernel: [649222.441804] RBP: 000000c0041d9568 R08: 0000000000000000 R09: 0000000000000000
Jan 30 06:11:45 docker-cluster-101 kernel: [649222.441805] R10: 0000000000000000 R11: 0000000000000206 R12: 000000c0025b4210
Jan 30 06:11:45 docker-cluster-101 kernel: [649222.441806] R13: 0000000000000000 R14: 000000c003e601a0 R15: 0000000000000000
Jan 30 06:11:45 docker-cluster-101 kernel: [649222.441808]  </TASK>

The complete log is in the attached syslog.txt file, the first line of the log (11 minutes before the problem) indicates the start of the backup performed with Proxmox Backup Server installed on a QNAP NAS and finished at 06:08, in the configuration of QEMU Guest Agent I removed the freeze-fs-on-backup option.
Code:
INFO: Backup finished at 2024-01-30 06:08:26
INFO: Backup job finished successfully

After these messages the system does not crash immediately but after a few minutes the docker containers begin to not work and it is impossible to log to the VM, both from the console and via SSH. The only way to regain control of the VM is to perform a shutdown from the Proxmox interface and turn the VM back on.

I configured the VM as suggested:
  1. Using VirtIO-SCSI-Single disk controller for your VM disks
  2. Enabling IOthreads (iothread=1 in VM config) for all disks
  3. Using threaded IO (aio=threads in VM config) for all disks

I tuned the VM following the instructions of another thread that cites this GitHub page:
https://gist.github.com/sergey-dryabzhinsky/bcc1a15cb7d06f3d4606823fcc834824
The complete file can be found attached (98-sysctl-proxmox-tune.conf), in particular:

Code:
vm.swappiness = 1
vm.overcommit_memory = 0
vm.dirty_background_ratio = 1
vm.dirty_ratio = 3

Proxmox storage is implemented with Ceph on NVMe disks and 4 OSDs for each disk as suggested by the ceph documentation and the performance is excellent. If it weren't for this problem that occurs sporadically on a random VM the system has excellent performance.

Is there anything I can do to resolve and/or mitigate the problem? It would be preferable, for example, for the VM to automatically restart in the event of a crash rather than requiring manual intervention.
 

Attachments

  • syslog.txt
    38.6 KB · Views: 1
  • 98-sysctl-proxmox-tune.conf.txt
    6.4 KB · Views: 2
The complete log is in the attached syslog.txt file, the first line of the log (11 minutes before the problem) indicates the start of the backup performed with Proxmox Backup Server installed on a QNAP NAS and finished at 06:08, in the configuration of QEMU Guest Agent I removed the freeze-fs-on-backup option.
Sounds like a known bug that can be solved by deactivating iothread. More about it here: https://forum.proxmox.com/threads/vms-hung-after-backup.137286/page-2#post-627915
 
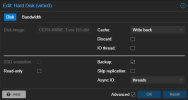
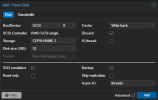
What I noticed in your screenshot is that with CEPH you should always use scsi with discard and SSD flag. Then you can also save storage space on the CEPH with thin provisioning.

And don't forget to stop and start the VM (reboot doesn't help, the process has to be ended).
 
  • Like
Reactions: l.ansaloni
Yes, exactly, that looks good.

Then you can run fstrim -a in the VM. Then the CEPH should get more free space.
 
there is an update for pve-qemu-kvm

pve-qemu-kvm (8.1.5-2) bookworm; urgency=medium

* work around for a situation where guest IO might get stuck, if the VM is
configure with iothread and VirtIO block/SCSI

-- Proxmox Support Team <support@proxmox.com> Fri, 02 Feb 2024 19:41:27 +0100
 

About

The Proxmox community has been around for many years and offers help and support for Proxmox VE, Proxmox Backup Server, and Proxmox Mail Gateway.
We think our community is one of the best thanks to people like you!

Get your subscription!

The Proxmox team works very hard to make sure you are running the best software and getting stable updates and security enhancements, as well as quick enterprise support. Tens of thousands of happy customers have a Proxmox subscription. Get yours easily in our online shop.

Buy now!