Very poor write speeds with Samsung 750 EVO SSD

maichelmann

Member
Apr 4, 2020
5
0
6
25
Hi,

while working in a VM and installing some stuff, I noticed that disk writes are slower than they used to be in the past when running an OS bare-metal on the same hardware without having Proxmox in between. After taking a deeper look with zpool iostat 2 I saw that the write throughput never exceeded 24M, no matter what my VMs are doing.

My pool consists of a single (no redundancy needed) Samsung 750 EVO SATA SSD:
Code:
  pool: rpool
 state: ONLINE
  scan: scrub repaired 0B in 0 days 00:10:15 with 0 errors on Sun Mar  8 00:34:16 2020
config:

    NAME                                                   STATE     READ WRITE CKSUM
    rpool                                                  ONLINE       0     0     0
      ata-Samsung_SSD_750_EVO_500GB_S36SNWAH778789E-part3  ONLINE       0     0     0

errors: No known data errors
Code:
NAME    SIZE  ALLOC   FREE  CKPOINT  EXPANDSZ   FRAG    CAP  DEDUP    HEALTH  ALTROOT
rpool   464G   235G   229G        -         -    46%    50%  1.00x    ONLINE  -

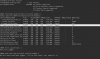
A simple benchmark confirms that (even sequential) write speeds and IOPS are really bad:
Code:
# zfs create -sV 100G -o compression=off rpool/test    # Ensure that compression does not affect my test results
# fio --filename=/dev/zvol/rpool/test --sync=1 --rw=write --bs=1M --numjobs=1 --iodepth=4 --group_reporting --name=test --filesize=10G
test: (g=0): rw=write, bs=(R) 1024KiB-1024KiB, (W) 1024KiB-1024KiB, (T) 1024KiB-1024KiB, ioengine=psync, iodepth=4
fio-3.12
Starting 1 process
Jobs: 1 (f=1): [f(1)][100.0%][eta 00m:00s]                        
test: (groupid=0, jobs=1): err= 0: pid=11262: Sat Apr  4 18:59:19 2020
  write: IOPS=14, BW=14.0MiB/s (14.7MB/s)(10.0GiB/729499msec); 0 zone resets
    clat (msec): min=4, max=874, avg=71.19, stdev=63.00
     lat (msec): min=4, max=874, avg=71.23, stdev=63.00
    clat percentiles (msec):
     |  1.00th=[    6],  5.00th=[    9], 10.00th=[   27], 20.00th=[   33],
     | 30.00th=[   36], 40.00th=[   41], 50.00th=[   51], 60.00th=[   61],
     | 70.00th=[   79], 80.00th=[  108], 90.00th=[  142], 95.00th=[  194],
     | 99.00th=[  313], 99.50th=[  368], 99.90th=[  550], 99.95th=[  592],
     | 99.99th=[  701]
   bw (  KiB/s): min= 2043, max=153600, per=100.00%, avg=14392.80, stdev=13525.47, samples=1456
   iops        : min=    1, max=  150, avg=13.93, stdev=13.22, samples=1456
  lat (msec)   : 10=6.34%, 20=1.63%, 50=41.57%, 100=27.92%, 250=20.35%
  lat (msec)   : 500=2.02%, 750=0.16%, 1000=0.01%
  cpu          : usr=0.06%, sys=1.96%, ctx=355011, majf=0, minf=10
  IO depths    : 1=100.0%, 2=0.0%, 4=0.0%, 8=0.0%, 16=0.0%, 32=0.0%, >=64=0.0%
     submit    : 0=0.0%, 4=100.0%, 8=0.0%, 16=0.0%, 32=0.0%, 64=0.0%, >=64=0.0%
     complete  : 0=0.0%, 4=100.0%, 8=0.0%, 16=0.0%, 32=0.0%, 64=0.0%, >=64=0.0%
     issued rwts: total=0,10240,0,0 short=0,0,0,0 dropped=0,0,0,0
     latency   : target=0, window=0, percentile=100.00%, depth=4

Run status group 0 (all jobs):
  WRITE: bw=14.0MiB/s (14.7MB/s), 14.0MiB/s-14.0MiB/s (14.7MB/s-14.7MB/s), io=10.0GiB (10.7GB), run=729499-729499msec

I know, this SSD is not the newest one and probably never had the greatest IOPS, but I'd still expect much higher speeds than this.
Is there something wrong with my benchmark methodology or configuration? Or is it possible that the SSD performance extemely degraded over time?

Unfortunately, I do not have an up to date bare-metal test result for comparison and cannot create one right now.
 
Here is some more data:

Code:
NAME        PROPERTY              VALUE                  SOURCE
rpool/test  type                  volume                 -
rpool/test  creation              Sat Apr  4 18:46 2020  -
rpool/test  used                  9.96G                  -
rpool/test  available             215G                   -
rpool/test  referenced            9.96G                  -
rpool/test  compressratio         1.00x                  -
rpool/test  reservation           none                   default
rpool/test  volsize               100G                   local
rpool/test  volblocksize          8K                     default
rpool/test  checksum              on                     default
rpool/test  compression           off                    local
rpool/test  readonly              off                    default
rpool/test  createtxg             1094927                -
rpool/test  copies                1                      default
rpool/test  refreservation        none                   default
rpool/test  guid                  16497666588996596212   -
rpool/test  primarycache          all                    default
rpool/test  secondarycache        all                    default
rpool/test  usedbysnapshots       0B                     -
rpool/test  usedbydataset         9.96G                  -
rpool/test  usedbychildren        0B                     -
rpool/test  usedbyrefreservation  0B                     -
rpool/test  logbias               latency                default
rpool/test  objsetid              277                    -
rpool/test  dedup                 off                    default
rpool/test  mlslabel              none                   default
rpool/test  sync                  standard               inherited from rpool
rpool/test  refcompressratio      1.00x                  -
rpool/test  written               9.96G                  -
rpool/test  logicalused           9.90G                  -
rpool/test  logicalreferenced     9.90G                  -
rpool/test  volmode               default                default
rpool/test  snapshot_limit        none                   default
rpool/test  snapshot_count        none                   default
rpool/test  snapdev               hidden                 default
rpool/test  context               none                   default
rpool/test  fscontext             none                   default
rpool/test  defcontext            none                   default
rpool/test  rootcontext           none                   default
rpool/test  redundant_metadata    all                    default
rpool/test  encryption            off                    default
rpool/test  keylocation           none                   default
rpool/test  keyformat             none                   default
rpool/test  pbkdf2iters           0                      default
Code:
Model Family:     Samsung based SSDs
Device Model:     Samsung SSD 750 EVO 500GB
Serial Number:    S36SNWAH778789E
LU WWN Device Id: 5 002538 d702d6448
Firmware Version: MAT01B6Q
User Capacity:    500,107,862,016 bytes [500 GB]
Sector Size:      512 bytes logical/physical
Rotation Rate:    Solid State Device
Form Factor:      2.5 inches
Device is:        In smartctl database [for details use: -P show]
ATA Version is:   ACS-2, ATA8-ACS T13/1699-D revision 4c
SATA Version is:  SATA 3.1, 6.0 Gb/s (current: 6.0 Gb/s)
Local Time is:    Sat Apr  4 18:58:16 2020 CEST
SMART support is: Available - device has SMART capability.
SMART support is: Enabled

=== START OF READ SMART DATA SECTION ===
SMART overall-health self-assessment test result: PASSED

General SMART Values:
Offline data collection status:  (0x00)    Offline data collection activity
                    was never started.
                    Auto Offline Data Collection: Disabled.
Self-test execution status:      (   0)    The previous self-test routine completed
                    without error or no self-test has ever
                    been run.
Total time to complete Offline
data collection:         (    0) seconds.
Offline data collection
capabilities:              (0x53) SMART execute Offline immediate.
                    Auto Offline data collection on/off support.
                    Suspend Offline collection upon new
                    command.
                    No Offline surface scan supported.
                    Self-test supported.
                    No Conveyance Self-test supported.
                    Selective Self-test supported.
SMART capabilities:            (0x0003)    Saves SMART data before entering
                    power-saving mode.
                    Supports SMART auto save timer.
Error logging capability:        (0x01)    Error logging supported.
                    General Purpose Logging supported.
Short self-test routine
recommended polling time:      (   2) minutes.
Extended self-test routine
recommended polling time:      ( 265) minutes.
SCT capabilities:            (0x003d)    SCT Status supported.
                    SCT Error Recovery Control supported.
                    SCT Feature Control supported.
                    SCT Data Table supported.

SMART Attributes Data Structure revision number: 1
Vendor Specific SMART Attributes with Thresholds:
ID# ATTRIBUTE_NAME          FLAG     VALUE WORST THRESH TYPE      UPDATED  WHEN_FAILED RAW_VALUE
  5 Reallocated_Sector_Ct   0x0033   100   100   010    Pre-fail  Always       -       0
  9 Power_On_Hours          0x0032   096   096   000    Old_age   Always       -       16099
12 Power_Cycle_Count       0x0032   099   099   000    Old_age   Always       -       909
177 Wear_Leveling_Count     0x0013   044   044   000    Pre-fail  Always       -       280
179 Used_Rsvd_Blk_Cnt_Tot   0x0013   100   100   010    Pre-fail  Always       -       0
181 Program_Fail_Cnt_Total  0x0032   100   100   010    Old_age   Always       -       0
182 Erase_Fail_Count_Total  0x0032   100   100   010    Old_age   Always       -       0
183 Runtime_Bad_Block       0x0013   100   100   010    Pre-fail  Always       -       0
187 Uncorrectable_Error_Cnt 0x0032   100   100   000    Old_age   Always       -       0
190 Airflow_Temperature_Cel 0x0032   048   044   000    Old_age   Always       -       52
195 ECC_Error_Rate          0x001a   200   200   000    Old_age   Always       -       0
199 CRC_Error_Count         0x003e   100   100   000    Old_age   Always       -       0
235 POR_Recovery_Count      0x0012   099   099   000    Old_age   Always       -       43
241 Total_LBAs_Written      0x0032   099   099   000    Old_age   Always       -       75697271518

SMART Error Log Version: 1
No Errors Logged

SMART Self-test log structure revision number 1
No self-tests have been logged.  [To run self-tests, use: smartctl -t]

SMART Selective self-test log data structure revision number 1
SPAN  MIN_LBA  MAX_LBA  CURRENT_TEST_STATUS
    1        0        0  Not_testing
    2        0        0  Not_testing
    3        0        0  Not_testing
    4        0        0  Not_testing
    5        0        0  Not_testing
  255        0    65535  Read_scanning was never started
Selective self-test flags (0x0):
  After scanning selected spans, do NOT read-scan remainder of disk.
If Selective self-test is pending on power-up, resume after 0 minute delay.
The SSD is probably lying about the block size, right?

EDIT: ashift is 12, the default value for Proxmox.
 
Last edited:
Just noticed that I still had the sync option enabled in the test above.

Here is one more benchmark, this time without sync:

Code:
# fio --filename=/dev/zvol/rpool/test --sync=0 --rw=write --bs=1M --numjobs=1 --iodepth=4 --group_reporting --name=test --filesize=10G
test: (g=0): rw=write, bs=(R) 1024KiB-1024KiB, (W) 1024KiB-1024KiB, (T) 1024KiB-1024KiB, ioengine=psync, iodepth=4
fio-3.12
Starting 1 process
Jobs: 1 (f=1): [f(1)][100.0%][eta 00m:00s]                     
test: (groupid=0, jobs=1): err= 0: pid=7175: Sat Apr  4 22:30:13 2020
  write: IOPS=58, BW=58.8MiB/s (61.7MB/s)(10.0GiB/174139msec); 0 zone resets
    clat (usec): min=215, max=2883.0k, avg=16976.28, stdev=78488.91
     lat (usec): min=224, max=2883.0k, avg=17001.62, stdev=78490.87
    clat percentiles (usec):
     |  1.00th=[    247],  5.00th=[    297], 10.00th=[    334],
     | 20.00th=[    388], 30.00th=[    441], 40.00th=[    537],
     | 50.00th=[    619], 60.00th=[    791], 70.00th=[  15139],
     | 80.00th=[  15533], 90.00th=[  32113], 95.00th=[  71828],
     | 99.00th=[ 160433], 99.50th=[ 455082], 99.90th=[1115685],
     | 99.95th=[1400898], 99.99th=[2768241]
   bw (  KiB/s): min= 2043, max=2641920, per=100.00%, avg=67662.94, stdev=192622.15, samples=309
   iops        : min=    1, max= 2580, avg=66.01, stdev=188.12, samples=309
  lat (usec)   : 250=1.15%, 500=35.20%, 750=22.81%, 1000=1.97%
  lat (msec)   : 2=0.33%, 4=0.03%, 10=0.56%, 20=25.21%, 50=5.87%
  lat (msec)   : 100=4.76%, 250=1.37%, 500=0.31%, 750=0.21%, 1000=0.08%
  cpu          : usr=0.13%, sys=3.01%, ctx=19446, majf=8, minf=12
  IO depths    : 1=100.0%, 2=0.0%, 4=0.0%, 8=0.0%, 16=0.0%, 32=0.0%, >=64=0.0%
     submit    : 0=0.0%, 4=100.0%, 8=0.0%, 16=0.0%, 32=0.0%, 64=0.0%, >=64=0.0%
     complete  : 0=0.0%, 4=100.0%, 8=0.0%, 16=0.0%, 32=0.0%, 64=0.0%, >=64=0.0%
     issued rwts: total=0,10240,0,0 short=0,0,0,0 dropped=0,0,0,0
     latency   : target=0, window=0, percentile=100.00%, depth=4
Run status group 0 (all jobs):
  WRITE: bw=58.8MiB/s (61.7MB/s), 58.8MiB/s-58.8MiB/s (61.7MB/s-61.7MB/s), io=10.0GiB (10.7GB), run=174139-174139msec

Better, but still not as good as I'd expect. Any ideas?
 
Now THAT looks way more promising:

Code:
fio --filename=/dev/zvol/rpool/test --sync=0 --rw=write --bs=1M --numjobs=1 --iodepth=4 --group_reporting --name=test --ioengine=libaio --direct=1 --filesize=10G
test: (g=0): rw=write, bs=(R) 1024KiB-1024KiB, (W) 1024KiB-1024KiB, (T) 1024KiB-1024KiB, ioengine=libaio, iodepth=4
fio-3.12
Starting 1 process
Jobs: 1 (f=1): [f(1)][100.0%][eta 00m:00s]                         
test: (groupid=0, jobs=1): err= 0: pid=17017: Sun Apr  5 00:05:06 2020
  write: IOPS=326, BW=327MiB/s (343MB/s)(10.0GiB/31327msec); 0 zone resets
    slat (usec): min=27, max=3454, avg=77.55, stdev=91.10
    clat (nsec): min=1288, max=2285.4M, avg=12122273.62, stdev=63220621.14
     lat (usec): min=716, max=2285.5k, avg=12200.08, stdev=63218.12
    clat percentiles (usec):
     |  1.00th=[    816],  5.00th=[    947], 10.00th=[   1057],
     | 20.00th=[   1303], 30.00th=[   1549], 40.00th=[   1975],
     | 50.00th=[   2540], 60.00th=[   3458], 70.00th=[   6980],
     | 80.00th=[   9241], 90.00th=[  32113], 95.00th=[  64750],
     | 99.00th=[  87557], 99.50th=[  95945], 99.90th=[1400898],
     | 99.95th=[1501561], 99.99th=[2298479]
   bw (  KiB/s): min=43008, max=2258944, per=100.00%, avg=387737.07, stdev=573009.52, samples=54
   iops        : min=   42, max= 2206, avg=378.59, stdev=559.61, samples=54
  lat (usec)   : 2=0.03%, 4=0.03%, 100=0.03%, 250=0.24%, 500=0.10%
  lat (usec)   : 750=0.16%, 1000=6.76%
  lat (msec)   : 2=33.06%, 4=22.28%, 10=22.18%, 20=2.54%, 50=5.15%
  lat (msec)   : 100=7.28%, 250=0.07%
  cpu          : usr=1.71%, sys=0.78%, ctx=8870, majf=0, minf=11
  IO depths    : 1=0.1%, 2=0.1%, 4=100.0%, 8=0.0%, 16=0.0%, 32=0.0%, >=64=0.0%
     submit    : 0=0.0%, 4=100.0%, 8=0.0%, 16=0.0%, 32=0.0%, 64=0.0%, >=64=0.0%
     complete  : 0=0.0%, 4=100.0%, 8=0.0%, 16=0.0%, 32=0.0%, 64=0.0%, >=64=0.0%
     issued rwts: total=0,10240,0,0 short=0,0,0,0 dropped=0,0,0,0
     latency   : target=0, window=0, percentile=100.00%, depth=4
Run status group 0 (all jobs):
  WRITE: bw=327MiB/s (343MB/s), 327MiB/s-327MiB/s (343MB/s-343MB/s), io=10.0GiB (10.7GB), run=31327-31327msec

It's probably just a question of the right test methodology.
 
@LnxBil Thank you for your answer.
The "Wear_Leveling_Count" value of the SSD changed from 44 (one month ago) to 14 (now) and therefore Proxmox shows a Wearout of 86% now. Am I right that the SSD will probably fail very soon and should be replaced?

These are shitty devices and not suited for ZFS.

Yeah, I know.. I'm only using this Proxmox setup for virtualizing my own workstation, so nothing multiple users rely on. Also the hardware was never built for the purpose of running ZFS on it.
But still it's annoying enough when the storage doesn't perform that well.
 

Attachments

  • 1589194629991.png
    1589194629991.png
    89.4 KB · Views: 7
Am I right that the SSD will probably fail very soon and should be replaced?

Yes, that could be. At least for the pro series, there was a test performed by a german newspaper and they wrote a lot: factor x with 3 < x < 10 of the original DWPD, so the device may not fail soon, but better to have backups ready... and this is not a RMA cause, so samsung will probably not see this as a warranty issue.
 

About

The Proxmox community has been around for many years and offers help and support for Proxmox VE, Proxmox Backup Server, and Proxmox Mail Gateway.
We think our community is one of the best thanks to people like you!

Get your subscription!

The Proxmox team works very hard to make sure you are running the best software and getting stable updates and security enhancements, as well as quick enterprise support. Tens of thousands of happy customers have a Proxmox subscription. Get yours easily in our online shop.

Buy now!